. 2014 May 22;8(5):e2905.
doi: 10.1371/journal.pntd.0002905. eCollection 2014 May.

Dual RNA-seq of parasite and host reveals gene expression dynamics during filarial worm-mosquito interactions

Affiliations

Dual RNA-seq of parasite and host reveals gene expression dynamics during filarial worm-mosquito interactions

Young-Jun Choi et al. PLoS Negl Trop Dis. .

Abstract

Background: Parasite biology, by its very nature, cannot be understood without integrating it with that of the host, nor can the host response be adequately explained without considering the activity of the parasite. However, due to experimental limitations, molecular studies of parasite-host systems have been predominantly one-sided investigations focusing on either of the partners involved. Here, we conducted a dual RNA-seq time course analysis of filarial worm parasite and host mosquito to better understand the parasite processes underlying development in and interaction with the host tissue, from the establishment of infection to the development of infective-stage larva.

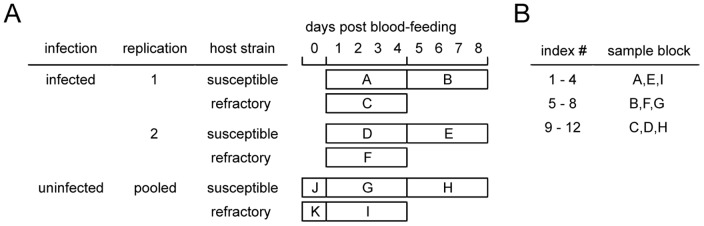
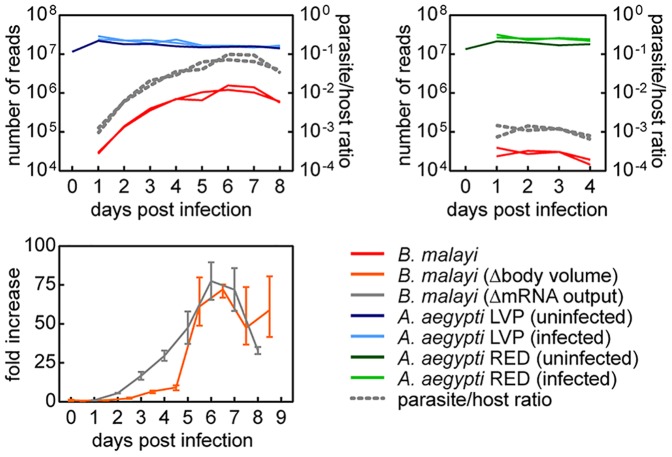
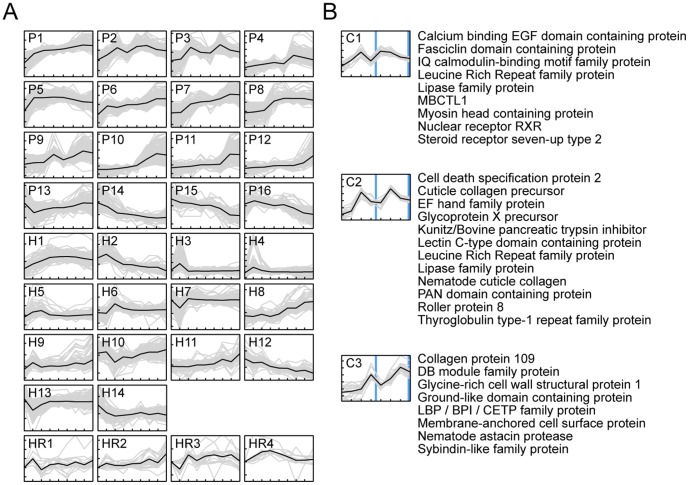
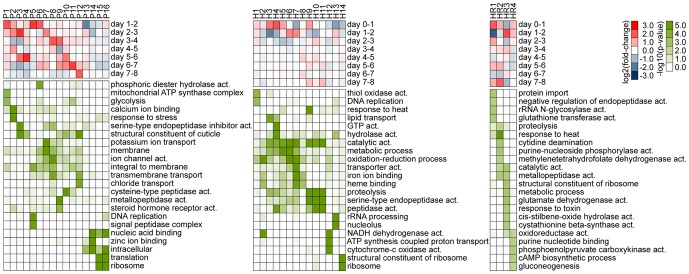
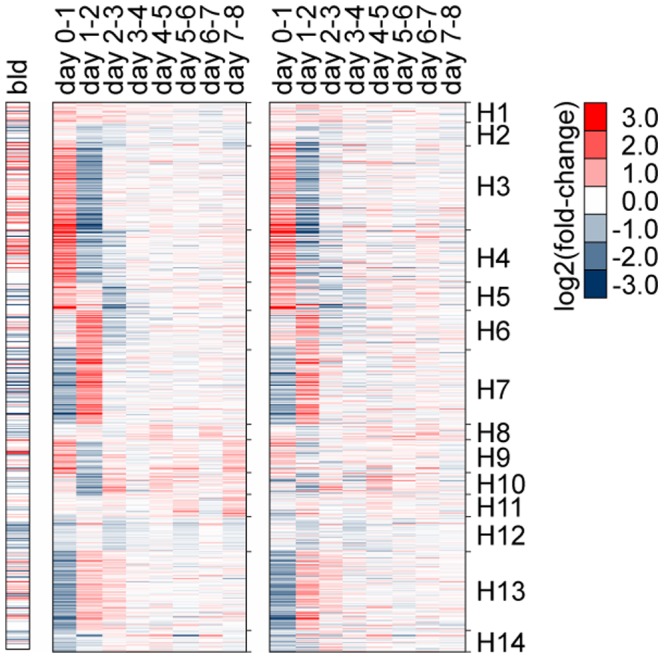
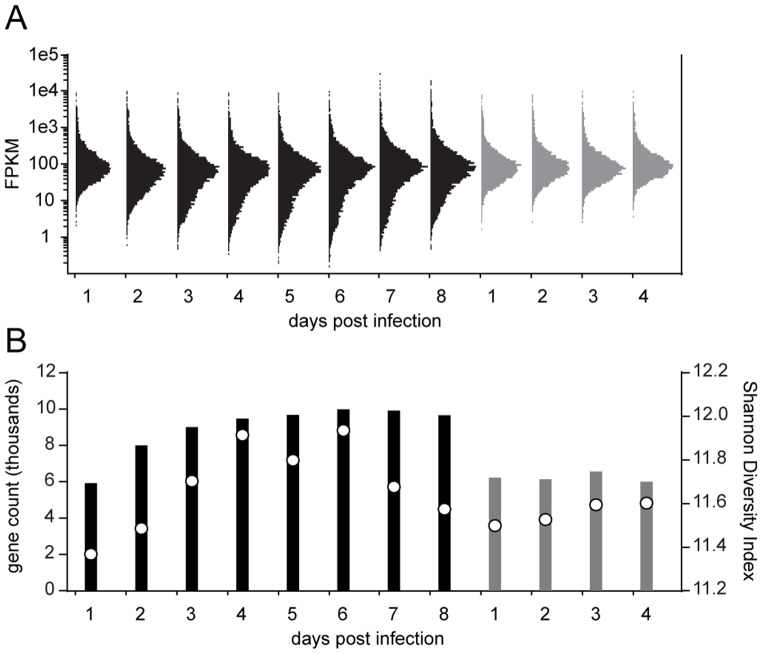
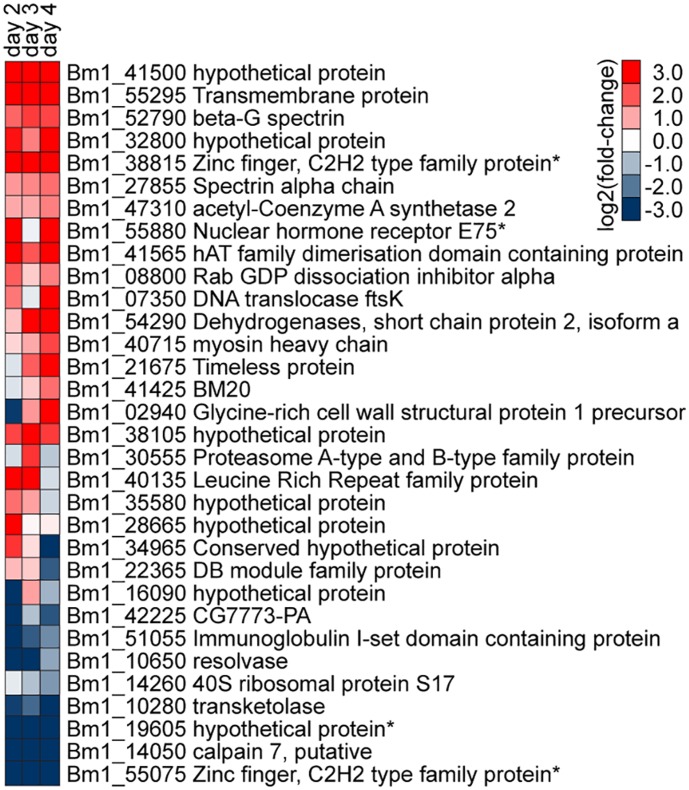
Methodology/principal findings: Using the Brugia malayi-Aedes aegypti system, we report parasite gene transcription dynamics, which exhibited a highly ordered developmental program consisting of a series of cyclical and state-transitioning temporal patterns. In addition, we contextualized these parasite data in relation to the concurrent dynamics of the host transcriptome. Comparative analyses using uninfected tissues and different host strains revealed the influence of parasite development on host gene transcription as well as the influence of the host environment on parasite gene transcription. We also critically evaluated the life-cycle transcriptome of B. malayi by comparing developmental stages in the mosquito relative to those in the mammalian host, providing insight into gene expression changes underpinning the mosquito-borne parasitic lifestyle of this heteroxenous parasite.

Conclusions/significance: The data presented herein provide the research community with information to design wet lab experiments and select candidates for future study to more fully dissect the whole set of molecular interactions of both organisms in this mosquito-filarial worm symbiotic relationship. Furthermore, characterization of the transcriptional program over the complete life cycle of the parasite, including stages within the mosquito, could help devise novel targets for control strategies.


Conflict of interest statement

The authors have declared that no competing interests exist.

Figures

Figure 1
Figure 1. Multiplexing scheme.
(A) Description of sequencing libraries. Except for J and K, each sample block (A through I) represents 4 distinct libraries. The following combinations of sample blocks were multiplexed without indexing conflicts: [A, B, C], [D, E, F], [G, H, I], [A, D, G], [B, E, H] and [C, F, I]. Susceptible, Aedes aegypti LVP; Refractory, Aedes aegypti RED. (B) Indices #1–12 were used to tag specific sample blocks. Index #1, for example, was used to tag the first library of the sample blocks A, E, and I, where each block consisted of 4 individual libraries of sequential time points. This scheme allowed multiplexing of 12 libraries from the sample blocks A, B, and C in a single lane, and also a different combination of 12 libraries from the sample blocks A, D, and G in a single lane.
Figure 2
Figure 2. Sequencing reads aligned to the Aedes aegypti and Brugia malayi reference genomes.
Overall composition of sequencing reads based on alignment to reference genomes, Aedes aegypti [VectorBase: AaegL1] and Brugia malayi [GenBank:DS236884-DS264093].
Figure 3
Figure 3. Total number of aligned paired-end reads.
Upper panels represent paired-end reads that aligned unambiguously to the gene models of Aedes aegypti (left panel LVP, right panel RED) and Brugia malayi. Biological replicates were plotted as separate lines. The lower panel represents the relative changes in transcriptional output and body volume during B. malayi development in Ae. aegypti LVP. Temporal change in transcriptional output was estimated from parasite/host ratio of total read counts, assuming that the host mRNA output is constant over time. Volumetric calculations were based on measurements reported by Murthy and Sen after approximating the shape of the worm to a cylinder. Error bars denote range.
Figure 4
Figure 4. Time-course transcript abundance profiles.
The vertical scale displays log2 fold-change in increments of 2, and the horizontal scale displays time in days. (A) Non-flat profiles (p<0.01 and maximum fold-difference among time points >2) were grouped into common temporal patterns using k-means clustering. Black lines represent mean expression profiles; P1–16, k-means clusters of Brugia malayi during development in Aedes aegypti LVP between day 1 and 8 post infection; H1–14, k-means clusters of Ae. aegypti LVP infected with B. malayi between day 0 and 8 post infection; and HR1–4, host response profile comparing infected vs. uninfected A. aegypti LVP. (B) B. malayi transcripts displaying periodic patterns with respect to molting events (blue vertical lines) during development in Ae. aegypti LVP. For each temporal pattern with distinct kinetics the top 20 transcripts displaying the greatest magnitude of change were plotted along with their respective gene descriptions (C1–3). Uninformative annotations (e.g., hypothetical proteins) were omitted.
Figure 5
Figure 5. Temporal expression dynamics across clusters.
Mean expression changes between sequential time points (red-blue), and over-represented Gene Ontology (GO) terms (green-white) for gene clusters shown in Figure 4A. Significant GO terms were summarized into a representative subset (see Dataset S1 for a full list of terms).
Figure 6
Figure 6. Functional composition of mosquito transcripts.
Transcript abundance changes in Aedes aegypti gene clusters H1–14 (Figures 4 and 5) as compared to blood vs. sugar fed whole mosquitoes at five hours after bloodmeal reported in Bonizzoni et al. (bld) . Brugia malayi-infected (middle heatmap) and uninfected Aedes aegypti LVP (right heatmap) thoracic tissues between day zero and eight after bloodmeal (middle and right heat maps, respectively).
Figure 7
Figure 7. Sampling depth increased over time.
(A) Frequency distribution of Brugia malayi genes over FPKM (fragments per kilobase of exon model per million fragments mapped) values. Black and grey: development in Aedes aegypti LVP and RED, respectively. The area of each distribution curve is proportional to the total number of detected genes for each condition (FPKM>0) (B). Circles represent Shannon Diversity Index values. These data show that increase in sequence sampling depth due to parasite growth (Figure 3) results in the detection of additional genes, mostly transcribed at lower levels, as evidenced by the asymmetrical broadening of shoulders in histograms.
Figure 8
Figure 8. Functional composition of parasite transcripts that were different during infection of susceptible vs. refractory mosquitoes.
Brugia malayi genes showing time dependent transcriptional changes (relative to day one) that are different during infection of Aedes aegypti LVP with respect to RED (i.e., log fold-change during infection of LVP – log fold-change during infection of RED). *Putative transcription factors predicted by DBD database .
Figure 9
Figure 9. Brugia malayi expression profiles enriched for each life cycle stage.
(A) Multi-dimensional scaling plot showing relatedness between transcript expression profiles of Brugia malayi life-cycle stages, including previously reported mammalian stages . Read counts resulting from immature and mature microfilariae (IM and MM), mosquito stages between day 1 and 4 (D1–4), and between day 4 and 8 (D4–8) were combined to generate representative expression profiles enriched for microfilariae (MF), L1, and L2, respectively. AM and AF, adult male and female; EE, eggs/embryos. The resulting data set (indicated in black) were used to examine (B) B. malayi genes differentially transcribed during the mosquito stages relative to the mammalian stages (p<0.01).

References

    1. Mathers CD, Ezzati M, Lopez AD (2007) Measuring the burden of neglected tropical diseases: the global burden of disease framework. PLoS Negl Trop Dis 1: e114. - PMC - PubMed
    1. Global programme to eliminate lymphatic filariasis: progress report for 2012 (2013). Relevé Épidémiologique Hebd Sect Hygiène Secrétariat Société Nations Wkly Epidemiol Rec Health Sect Secr Leag Nations 88: : 389–399. - PubMed
    1. Aliota MT, Fuchs JF, Rocheleau TA, Clark AK, Hillyer JF, et al. (2010) Mosquito transcriptome profiles and filarial worm susceptibility in Armigeres subalbatus . PLoS Negl Trop Dis 4: e666. - PMC - PubMed
    1. Erickson SM, Xi Z, Mayhew GF, Ramirez JL, Aliota MT, et al. (2009) Mosquito infection responses to developing filarial worms. PLoS Negl Trop Dis 3: e529. - PMC - PubMed
    1. Erickson SM, Thomsen EK, Keven JB, Vincent N, Koimbu G, et al. (2013) Mosquito-parasite interactions can shape filariasis transmission dynamics and impact elimination programs. PLoS Negl Trop Dis 7: e2433. - PMC - PubMed

Publication types