. 2014 May 22;5(5):e1239.
doi: 10.1038/cddis.2014.194.

IRE1a constitutes a negative feedback loop with BMP2 and acts as a novel mediator in modulating osteogenic differentiation

Affiliations

IRE1a constitutes a negative feedback loop with BMP2 and acts as a novel mediator in modulating osteogenic differentiation

F-J Guo et al. Cell Death Dis. .

Erratum in

Expression of concern in

Abstract

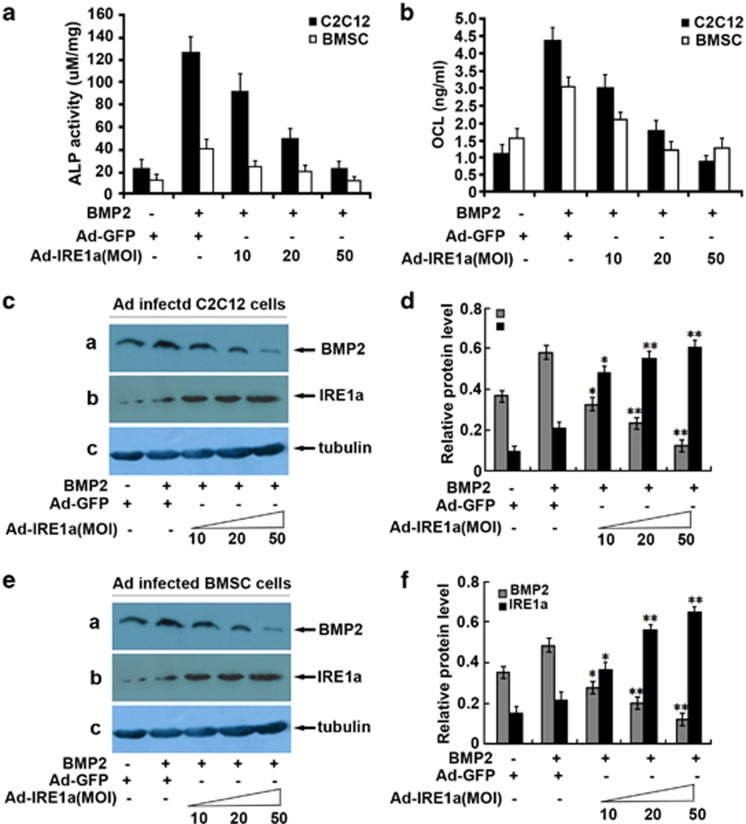
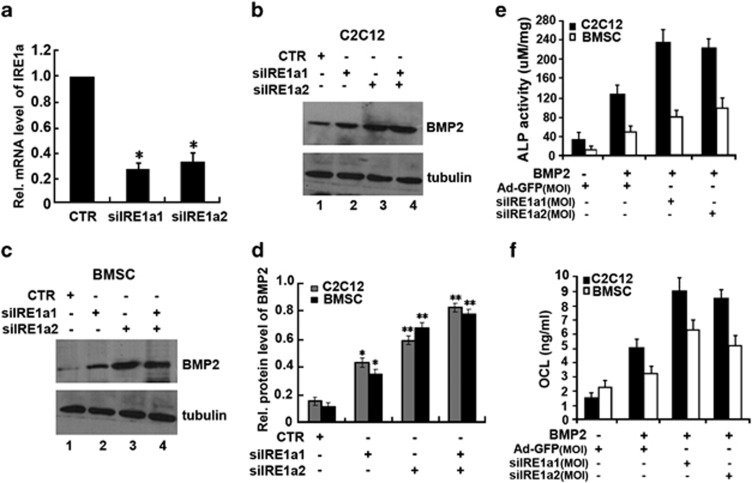
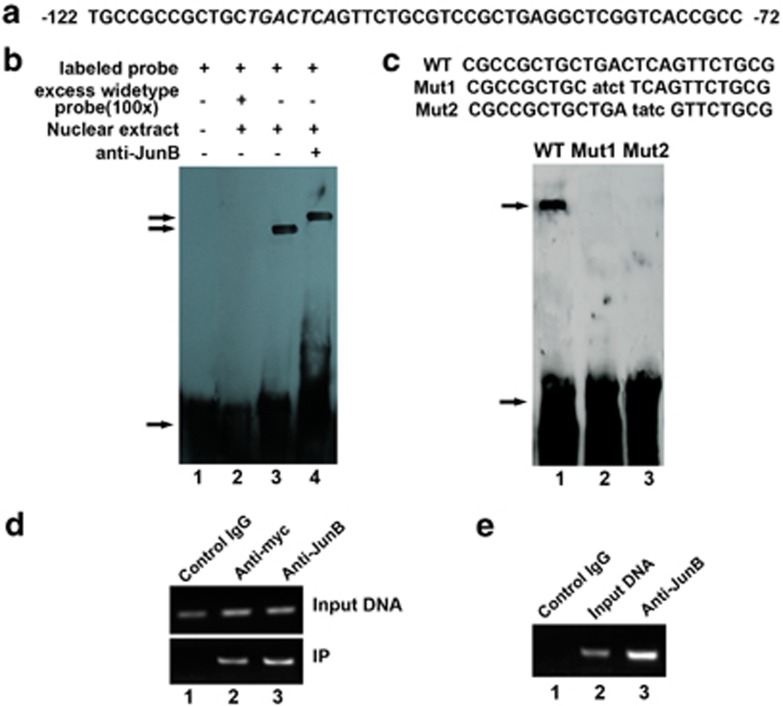
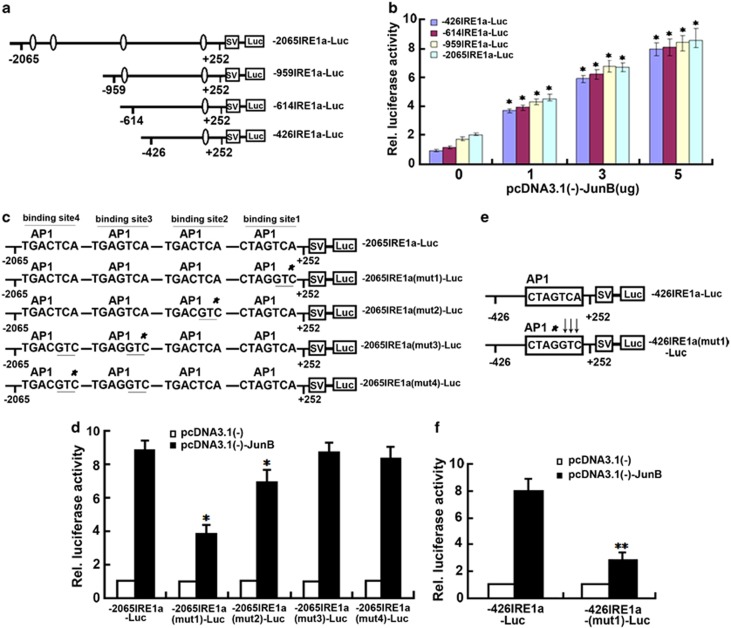
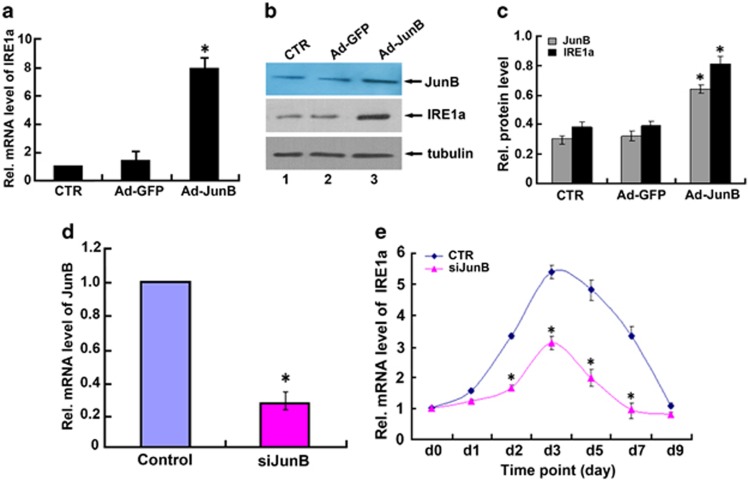
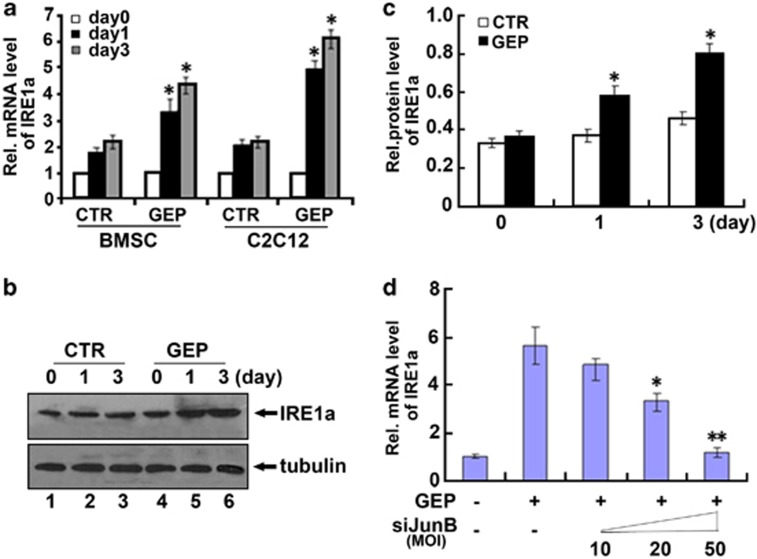
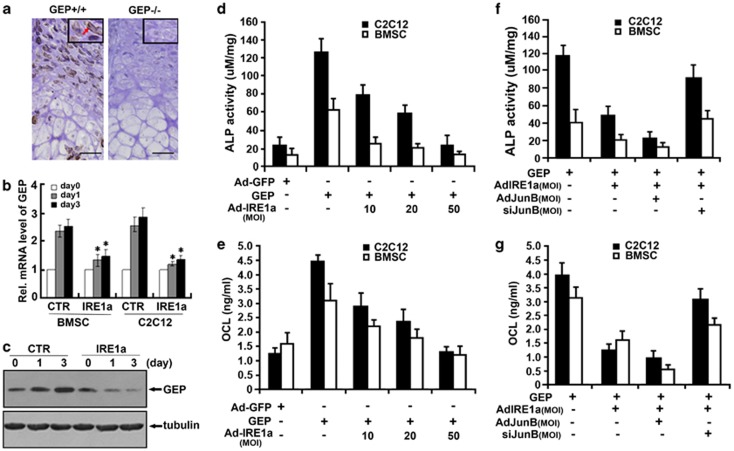
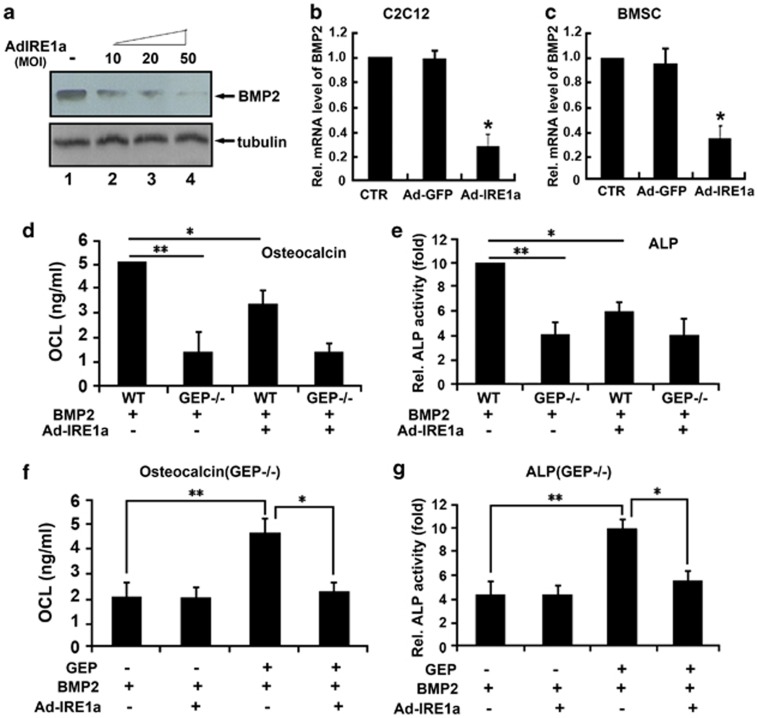
Bone morphogenetic protein 2 (BMP2) is known to activate unfolded protein response (UPR) signaling molecules, such as BiP (IgH chain-binding protein), PERK (PKR-like ER-resistant kinase), and IRE1α. Inositol-requiring enzyme-1a (IRE1a), as one of three unfolded protein sensors in UPR signaling pathways, can be activated during ER stress. Granulin-epithelin precursor (GEP) is an autocrine growth factor that has been implicated in embryonic development, tissue repair, tumorigenesis, and inflammation. However, the influence on IRE1a in BMP2-induced osteoblast differentiation has not yet been elucidated. Herein we demonstrate that overexpression of IRE1a inhibits osteoblast differentiation, as revealed by reduced activity of alkaline phosphatase (ALP) and osteocalcin; however, knockdown of IRE1a via the RNAi approach stimulates osteoblastogenesis. Mechanistic studies revealed that the expression of IRE1a during osteoblast was a consequence of JunB transcription factor binding to several AP1 sequence (TGAG/CTCA) in the 5'-flanking regulatory region of the IRE1a gene, followed by transcription. In addition, GEP induces IRE1a expressions and this induction of IRE1a by GEP depends on JunB. Furthermore, IRE1a inhibition of GEP-induced osteoblastogenesis relies on JunB. Besides, GEP is required for IRE1a inhibition of BMP2-induced bone formation. Collectively, these findings demonstrate that IRE1a negatively regulates BMP2-induced osteoblast differentiation and this IRE1a inhibition effect depends on GEP growth factor. Thus, IRE1a, BMP2, GEP growth factor, and JunB transcription factor form a regulatory loop and act in concert in the course of osteoblastogenesis.


Figures

Figure 1
Figure 1
IRE1a inhibits the BMP2-induced osteogenesis assayed by ALP and OCL. (a) IRE1a inhibits the BMP2-dependent ALP activity in a dose-dependent manner. C2C12 cell lines and BMSCs were infected either Ad-GFP (MOI=50, serves as a control) or BMP2 (300 ng/ml) with or without IRE1a (at different MOI) for 4 days and the cell lysates were used for determining the ALP activity. (b) IRE1a inhibits the BMP2-dependent OCL production in a dose-dependent manner. C2C12 cell lines and BMSCs were infected as described in a and the cell culture media were used for determining the OCL level. (c and e) Expression of IRE1a and BMP2 in C2C12 and BMSCs infected with either Ad-GFP (MOI=50, serves as a control) or BMP2 (300 ng/ml) with or without IRE1a (at different MOI=10, 20, 50) for 4 days. Cell lysates were prepared from C2C12 (c) and BMSCs (e) infected with various adenoviruses, as indicated, and detected by western blotting with anti-IRE1a, anti-BMP2, and anti-tubulin (internal control) antibodies. (d and f) Semi-quantification of protein relative levels of BMP2 and IRE1α in the C2C12 (d) and BMSCs (f) infected with various adenoviruses, as indicated. Levels were normalized against those of tubulin by MJ Opticon Monitor Analysis Software (Bio-Rad); data were expressed as means±S.D. (n=3). Every treatment group compared with control groups, respectively, *P<0.05 or **P<0.01
Figure 2
Figure 2
siIRE1a enhances the BMP2-mediated osteogenesis assayed by ALP and OCL. (a) siRNA against IRE1a mRNA efficiently inhibited expression of endogenous IRE1a in C2C12 cells. C2C12 cells were infected with either siIRE1a adenovirus or control adenovirus (CTR), and total RNA was collected for real-time PCR analysis. Expression of IRE1a was normalized against the GAPDH endogenous control. The normalized values were then calibrated against the control value, here set as 1. *P<0.05. (b and c) Expression of IRE1a and BMP2 in C2C12 and BMSCs infected with indicated adenoviruses. Cell lysates were prepared from C2C12 (b) and BMSCs (c) infected with siIRE1a1, siIRE1a2, and siIRE1a1+siIRE1a2 adenoviruses, as indicated, and detected by western blotting with anti-IRE1a, anti-BMP2, and anti-tubulin (internal control) antibodies. (d) Semi-quantification of protein relative levels of BMP2 and IRE1α in the C2C12 (b) and BMSC(c) infected with various adenoviruses, as indicated in b and c. Levels were normalized against those of tubulin by MJ Opticon Monitor Analysis Software (Bio-Rad); data were expressed as means±S.D. (n=3). Every treatment group compared with control groups, respectively, *P<0.05 or **P<0.01. (e) siIRE1a increases the BMP2-dependent ALP activity. C2C12 cell lines and BMSCs were infected either Ad-GFP (MOI=50, serves as a control) or BMP2 (300 ng/ml) with or without siIRE1a1, siIRE1a2. The cell lysates were used for determining the ALP activity. (f) siIRE1a enhances the BMP2-dependent OCL production. C2C12 cell lines and BMSCs were infected as described in e, and the cell culture media were used for determining the OCL level
Figure 3
Figure 3
JunB binds to the AP1 sequence of the IRE1a promoter in vitro (EMSA) and in vivo (ChIP). (a) DNA sequence of the 50-bp AP1 (−122 to −72 bp) of the IRE1a promoter. Putative JunB-binding elements (AP1) are underlined. (b) JunB binds to the AP1 of the IRE1a promoter in vitro (EMSA). Ten micrograms of nuclear extracts (NE) prepared from C2C12 cells transfected with pcDNA3.1(−)-JunB was incubated with Dig-labeled JunB-binding site (ER stress response element) probe in reaction buffer (20  μl). For competition experiments, a 100-fold excess of WT oligodeoxynucleotide was added. After 15 min of incubation, the Dig-labeled AP1 probe was added, and the reaction mixture was incubated for an additional 15 min and analyzed by gel electrophoresis. Arrows indicate free DNA probe (bottom) and DNA/protein complex (up). (c) Mutations of AP1 sequence abolish the binding of JunB to the IRE1a gene promoter (DNA). EMSA was performed using the same protein fractions as in b. Probes are as indicated above the lanes. The specific protein–DNA band is indicated by an arrow. Mutant nucleotides are lowercase and underlined. The binding intensity of JunB to these probes is indicated as follows:+, binding; −, no binding. (d) Myc-tagged JunB binds to the transfected IRE1a-specific reporter construct −2065IRE1aluc. C2C12 cells transfected with −2065IRE1aluc and the expression plasmid pcDNA3.1(−)-JunB were cross-linked by formaldehyde treatment and lysed. Cell lysates were subjected to immunoprecipitation with control IgG (lane 1) or with anti-myc (lane 2) or anti-JunB (lane 3) antibody. Purified DNA from the cell lysate (Input DNA; upper panel) and DNA recovered from immunoprecipitation (IP; lower panel) were amplified by PCR. (e) Endogenous JunB binds to the AP1 sequence of the IRE1a gene. ChIP assays were performed in C2C12 cells treated with BMP2 for 3 days. C2C12 cells treated with formaldehyde were lysed, and DNA was sheared by sonication. Cell lysates were subjected to immunoprecipitation with either control IgG (IgG; lane 1) or anti-JunB antibodies (lane 3). DNA recovered from the immunoprecipitation was amplified by PCR. Input DNA (lane 2) was used as a positive control
Figure 4
Figure 4
Upregulation of IRE1a-specific reporter constructs and regulation of mutant IRE1a promoter transcriptional activity by JunB. (a) Schematic representation of four IRE1a-specific reporter gene constructs. The indicated segments from the 5′-flanking region of the IRE1a gene were linked to a simian virus 40 5′-flanking region (SV) and a DNA segment encoding luciferase (Luc). AP1 sequences are indicated by ovals. The numbers indicate the distance, in nucleotides, from the first nucleotide of intron 1. (b) JunB can drive the expression of IRE1a-specific reporter gene in C2C12 cells. The indicated reporter constructs were transfected into C2C12 cells together with various amounts of a pcDNA3.1(−)-JunB expression plasmid, as indicated, along with a pSVgal internal control plasmid. Forty eight hours after transfection, the cultures were collected and lysed, and β-galactosidase and luciferase activities were determined. Luciferase activity was normalized to β-galactosidase activity. The relative luciferase activity of the leftmost bar was set to 1. Compared with the cells untransfected with pcDNA3.1(−)-JunB plasmid (0) in each group of indicated reporter constructs. *P<0.05. (c) Schematic of four mutants of −2065IRE1a-luc reporter gene. The AP1 sequence in the −2065IRE1a-luc reporter construct was altered, as indicated. The mutant JunB-binding sites (AP1) are indicated by stars; mutant nucleotides are underlined. (d) Mutations of the JunB-binding sites results in the reduction in JunB-activated reporter gene expression. The indicated reporter construct and the pSVgal internal control plasmid were transfected into C2C12 cells together with 3 mg of pcDNA3.1(−) (control) or the pcDNA3.1(−)-JunB expression plasmid. The cultures were processed and the reporter gene activities analyzed as described in b. Compared with WT reporter construct. *P<0.05. (e) Schematic of mutated JunB-binding site (AP1) in −426IRE1aluc reporter construct. The JunB-binding site (AP1) in −426IRE1a-luc reporter construct was altered, as indicated. The mutant JunB binding site is indicated by a star; mutant nucleotides are indicated by arrows. Compared with WT reporter construct. ** P<0.01. (f) Alteration of the JunB-binding site abolishes JunB-induced reporter gene expression. C2C12 cells were transfected, processed, and the reporter gene activities analyzed as described in b
Figure 5
Figure 5
JunB upregulates endogenous IRE1a gene expression. (a) Real-time PCR assay of IRE1a mRNA level in C2C12 cell lines infected with Ad-JunB expression plasmid or control Ad-GFP. It is found that IRE1a mRNA was upregulated in C2C12 cell lines infected with Ad-JunB (MOI=50) adenovirus when compared with control C2C12 cells. The normalized values were then calibrated against the control value. The units are arbitrary and the left bar indicates a relative level of IRE1a mRNA of 1; *P<0.05. (b) Exogenous expression of JunB increased the IRE1a gene expression in C2C12 cells. Cell lysates from untreated C2C12 cells (CTR) or from C2C12 cells infected with Ad-JunB (MOI=50) or Ad-GFP were subjected to SDS-PAGE and detected by anti-IRE1a antibody, or anti-JunB, or anti-tubulin, respectively. Tubulin is served as an internal control. (c) Semi-quantification of protein relative levels of JunB and IRE1α in the C2C12 infected with various adenoviruses, as indicated in b. Levels were normalized against those of tubulin by MJ Opticon Monitor Analysis Software (Bio-Rad); data were expressed as means±S.D. (n=3). Every treatment group was compared with control groups, respectively, *P<0.05. (d) siRNA against JunB mRNA efficiently inhibited the expression of endogenous JunB in C2C12 cells. Cells were infected with either siJunB or control siRNA (CTR), and total RNA was collected for real-time PCR. Expression of JunB was normalized against the GAPDH endogenous control. The normalized values were then calibrated against the control value, here set as 1. *P<0.05. (e) Repression of JunB largely abolished IRE1a expression in BMP2-induced C2C12 cells. C2C12 cells were treated with BMP2 (300 ng/ml), then infected with either control siRNA (CTR) or JunB siRNA (siJunB) adenovirus. Total RNA was extracted from the cells and the mRNA levels of IRE1a and GAPDH were measured by real-time PCR at various time points. The units are arbitrary and the relative level of IRE1a mRNA on day 0 was set to 1. All experiments were repeated three times. Every siJunB treatment group was compared with control groups, respectively, *P<0.05
Figure 6
Figure 6
IRE1a expression induced by GEP depends on JunB. (a) GEP induces the expression of IRE1a mRNA, assayed by real-time PCR. C2C12 cells and BMSC cells were pretreated with 300 ng/ml of BMP2 for 1 week, then were cultured without (control) or with recombinant 300 ng/ml of GEP for various time periods, as indicated. The normalized values against GAPDH mRNA were calibrated against controls (day 0), given the value of 1. (b) GEP increase the level of IRE1a protein, assayed by western blotting. C2C12 cells were pretreated with 300 ng/ml of BMP2 for 1 week, then treated with or without 300 ng/ml of GEP for various time periods were stained with IRE1a antibody. Tubulin protein served as an internal control. (c) Semi-quantification of protein relative levels of IRE1α in the C2C12 treated with 300 ng/ml of GEP, as indicated in b. Levels were normalized against those of tubulin by MJ Opticon Monitor Analysis Software (Bio-Rad); data were expressed as means±S.D. (n=3). Every GEP treatment group was compared with control groups, respectively, *P<0.05. (d) siJunB abolished GEP-induced IRE1a expression, assayed by real-time PCR. C2C12 cells were pretreated with 300 ng/ml of BMP2 for 1 week, then were cultured without (control) or with recombinant 300 ng/ml of GEP and different dosage siJunB adenovirus (MOI=10, 20, 50). The normalized values against GAPDH mRNA were calibrated against controls, given the value of 1. The values are the mean±S.D. of three independent experiments. Every GEP+siJunB treatment group was compared with GEP treatment group, respectively, *P<0.05; **P<0.01
Figure 7
Figure 7
IRE1a expression depends on GEP signaling and inhibits GEP-mediated osteogenesis assayed by ALP and OCL. (a) IRE1a is markedly reduced in the growth plate chondrocytes of GEP-null embryos, revealed by immunohistochemistry. Sections of long bone from 18.5-day-old GEP-null (GEP−/−) and WT (GEP+/+) mouse embryos were stained with anti-IRE1a antibody (brown, indicated with arrows) and counterstained with Methyl green (green). Bar=100 mm. (b) IRE1a reduces the expression of GEP mRNA in the course of BMP2-stimulated osteogenesis, assayed by real-time PCR. C2C12 cells and BMSC cells were pretreated with 300 ng/ml of BMP2 for 1 week, then were cultured with Ad-GFP control (CTR) or with Ad-IRE1a (MOI=50) infected for various time periods, as indicated. The normalized values against GAPDH mRNA were calibrated against controls (day 0), given the value of 1. Every Ad-IRE1a treatment group was compared with control groups, respectively. *P<0.05. (c) IRE1a inhibits the level of IRE1a protein in the course of BMP2-stimulated osteogenesis, assayed by western blotting. C2C12 cells were pretreated with 300 ng/ml of BMP2 for 1 week, then infected with Ad-GFP control (CTR) or without Ad-IRE1a (MOI=50) for various time periods and were stained with GEP antibody. Tubulin protein served as an internal control. (d) IRE1a inhibits the GEP-induced ALP activity in a dose-dependent manner. C2C12 cell lines and BMSCs were infected either Ad-GFP (MOI=50, serves as a control) or 300 ng/ml GEP protein with or without Ad-IRE1a (at different MOI) for 4 days, and the cell lysates were used for determining the ALP activity. (e) IRE1a inhibits the GEP-induced OCL production in a dose-dependent manner. C2C12 cell lines and BMSCs were infected as described in d, and the cell culture media were used for determining OCL level. (f) The IRE1a inhibition GEP-induced ALP activity is required for JunB. C2C12 cell lines and BMSCs were infected either Ad-GFP (MOI=50, serves as a control) or 300 ng/ml GEP protein with or without Ad-IRE1a, Ad-JunB and siJunB for 4 days, then the cell lysates were used for determining the ALP activity. (g) The IRE1a inhibition of GEP-induced OCL production is required for JunB. C2C12 cell lines and BMSCs were infected as described in f and the cell culture media were used for determining OCL level
Figure 8
Figure 8
GEP was required for BMP2-induced osteoblastogenesis in vitro. (a) IRE1a decreases the level of BMP2 protein, assayed by western blotting. C2C12 cells treated with or without Ad-IRE1a (MOI=10, 20, 50) were stained with IRE1a antibody. Tubulin protein served as an internal control. (b and c) IRE1a reduces the expression of BMP2 mRNA, assayed by real-time PCR. C2C12 (b) and BMSC (c) cells were cultured without (control) or with AdIRE1a, as indicated. The normalized values against GAPDH mRNA were calibrated against controls (day 0), given the value of 1. (d) Deficiency of GEP impaired BMP2-induced OCL activity and IRE1a inhibition effect, detected by OCL activity assay. BMSCs from WT and GEP−/− mice were cultured in the absence or presence of 300 ng/ml BMP2 for 4 days, and OCL activity assay was performed. (e) Deficiency of GEP impaired BMP2-induced ALP activity and IRE1a inhibition effect, detected by ALP activity assay. BMSCs from WT and GEP−/− mice were cultured in the absence or presence of 300 ng/ml BMP2 for 4 days, and ALP activity assay was performed. (f) BMP2-induced OCL activity and IRE1a inhibition were restored when GEP was re-expressed, detected by OCL activity assay. BMSCs from GEP−/− mice were cultured in the absence or presence of 300 ng/ml GEP for 4 days, and OCL activity assay was performed. (g) BMP2-induced ALP activity and IRE1a inhibition were restored when GEP was re-expressed, detected by ALP activity assay. BMSCs from GEP−/− mice were cultured in the absence or presence of 300 ng/ml GEP for 4 days, and ALP activity assay was performed. The values are the mean±S.D. of three independent experiments. *P<0.05, **P<0.01 versus control group
Figure 9
Figure 9
A proposed model for explaining the role and regulation of IRE1a in osteoblast differentiation. GEP induces the expression of IRE1a, whereas IRE1a inhibits BMP2-induced bone formation and GEP-mediated osteoblast differentiation. This inhibition depends on JunB. Thus, IRE1a, BMP2, GEP, and JunB constitute a regulatory feedback loop during bone formation. ‘→' and ‘formula image
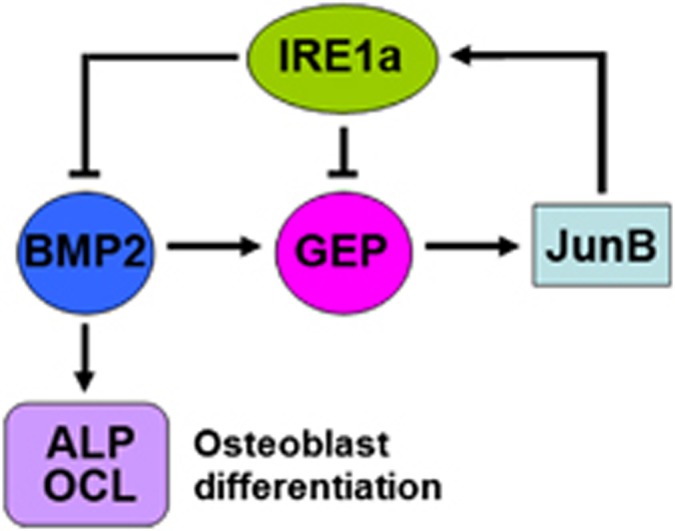
' indicate activation and repression, respectively

Similar articles

Cited by

References

    1. Lai CF, Cheng SL. Signal transductions induced by bone morphogenetic protein-2 and transforming growth factor-β in normal human osteoblastic cells. J Biol Chem. 2002;277:15514–15522. - PubMed
    1. Chen D, Zhao M, Mundy GR. Bone morphogenetic proteins. Growth Factors. 2004;22:233–241. - PubMed
    1. Ogata T, Wozney JM, Benezra R, Noda M. Bone morphogenetic protein 2 transiently enhances expression of a gene, Id (inhibitor of differentiation), encoding a helix-loop-helix molecule in osteoblast-like cells. Proc Natl Acad Sci USA. 1993;90:9219–9222. - PMC - PubMed
    1. Murakami T, Saito A, Hino S, Kondo S, Kanemoto S, Chihara K, et al. Signaling mediated by the endoplasmic reticulum stress transducer OASIS is involved in bone formation. Nat Cell Biol. 2009;11:1205–1211. - PubMed
    1. Jang WG, Kim EJ, Kim DK, Ryoo HM, Lee KB, Kim SH, et al. BMP2 protein regulates osteocalcin expression via Runx2-mediated ATF6 gene transcription. J Biol Chem. 2012;287:905–915. - PMC - PubMed

Publication types

MeSH terms

LinkOut - more resources