. 2014 May 23:5:3956.
doi: 10.1038/ncomms4956.

Mobile elements drive recombination hotspots in the core genome of Staphylococcus aureus

Affiliations
Free PMC article

Mobile elements drive recombination hotspots in the core genome of Staphylococcus aureus

Richard G Everitt et al. Nat Commun. .
Free PMC article

Abstract

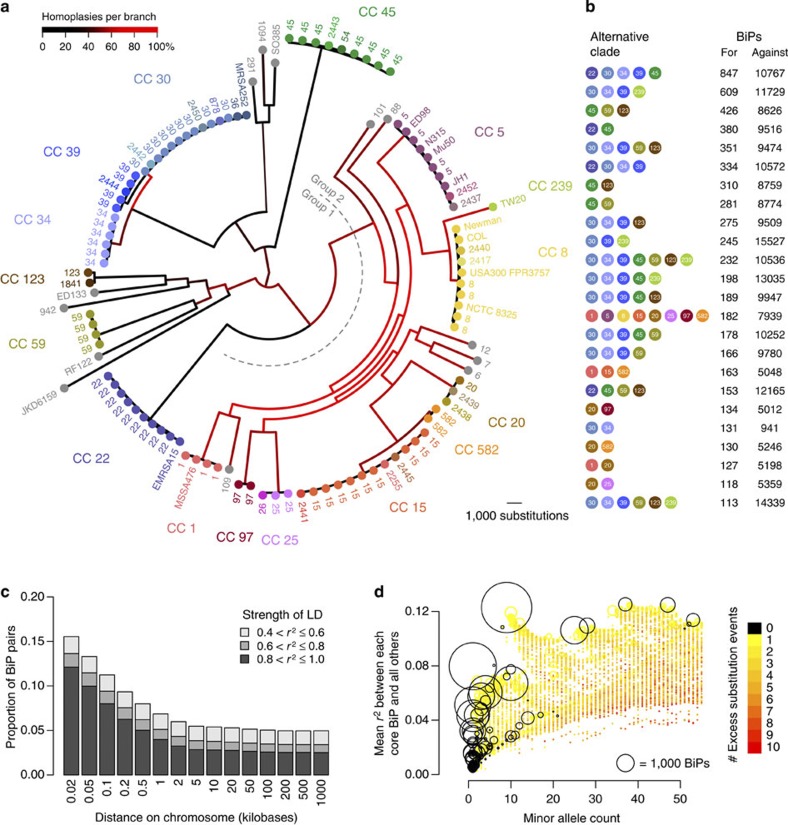
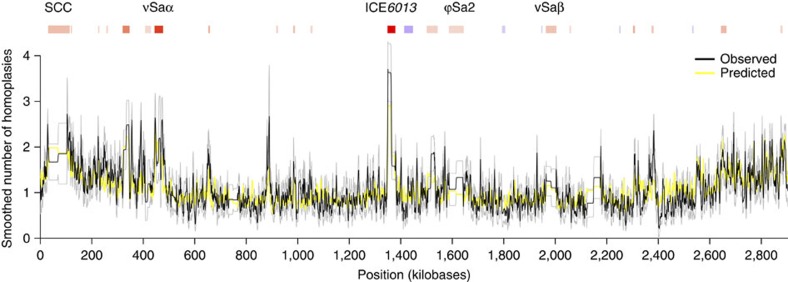
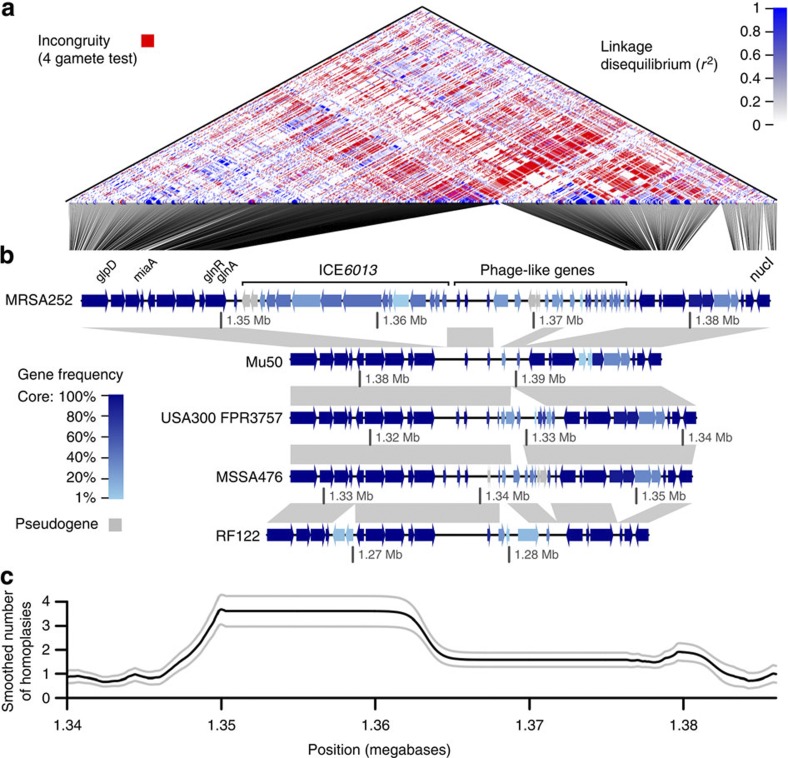
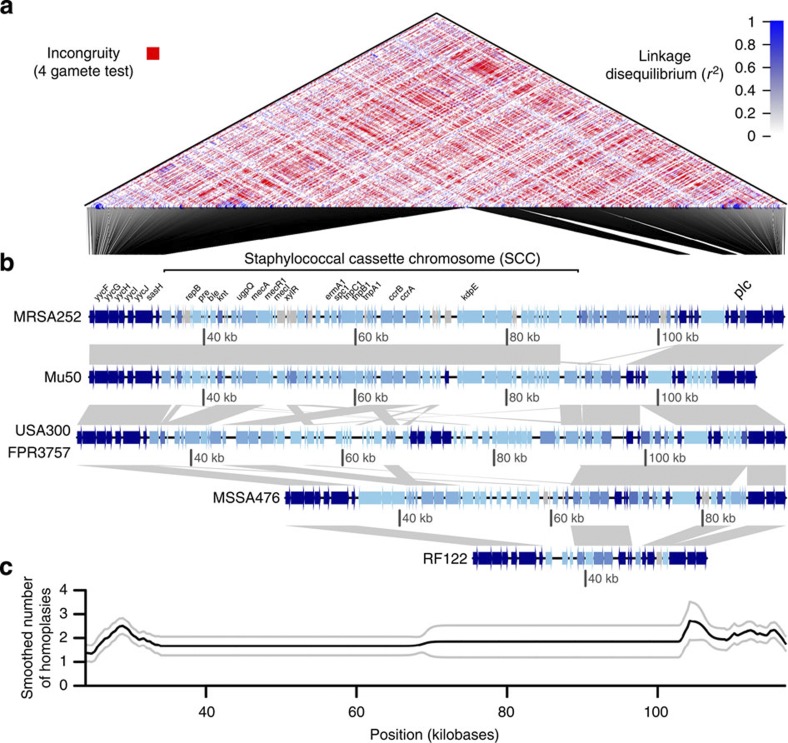
Horizontal gene transfer is an important driver of bacterial evolution, but genetic exchange in the core genome of clonal species, including the major pathogen Staphylococcus aureus, is incompletely understood. Here we reveal widespread homologous recombination in S. aureus at the species level, in contrast to its near-complete absence between closely related strains. We discover a patchwork of hotspots and coldspots at fine scales falling against a backdrop of broad-scale trends in rate variation. Over megabases, homoplasy rates fluctuate 1.9-fold, peaking towards the origin-of-replication. Over kilobases, we find core recombination hotspots of up to 2.5-fold enrichment situated near fault lines in the genome associated with mobile elements. The strongest hotspots include regions flanking conjugative transposon ICE6013, the staphylococcal cassette chromosome (SCC) and genomic island νSaα. Mobile element-driven core genome transfer represents an opportunity for adaptation and challenges our understanding of the recombination landscape in predominantly clonal pathogens, with important implications for genotype-phenotype mapping.


Figures

Figure 1
Figure 1. Signatures of recombination in the S. aureus core genome.
(a) Maximum likelihood phylogeny of 95 isolates from Oxfordshire, England and 15 reference isolates, based on 2,114,882 core invariant and biallelic sites. The reference genomes represent international strains (Australia: JKD6159; Japan: Mu50, N315; UK: EMRSA15, MSSA476, TW20; USA: JH1, USA300), animal-associated strains (bovine: RF122; ovine: ED133; poultry: ED98, swine: SO385), and historic strains (1943: NCTC 8325; 1952: Newman; 1960s: COL). Branches are colour coded by the proportion of homoplasious substitutions. Isolates are labelled by ST or reference genome and colour coded by clonal complex. Group 1 and group 2 S. aureus, as previously defined, are indicated. (b) Alternative, phylogenetically incongruent, relationships among CCs supported by some core biallelic sites but not others. (c) Decay in LD with increasing physical distance between pairs of core biallelic sites. LD is quantified by r2, the squared correlation coefficient. (d) Relationship between allele frequency, LD and number of substitutions at core biallelic sites. Each circle represents all the biallelic sites sharing a particular phylogenetic pattern, with the area proportional to the number of sites with that pattern. Circles are colour coded by the number of substitution events reconstructed along the phylogeny by maximum likelihood at each site with that pattern. Black circles correspond to the sites consistent with a unique mutation on a single branch of the phylogeny, while non-black circles represent homoplasious BiPs.
Figure 2
Figure 2. Recombination rate heterogeneity in the Staphylococcus aureus core genome.
Genome-wide variation in the number of homoplasies per BiP, based on an exponential smoothing kernel with 1 kb bandwidth. The smoothed estimate of the mean number of observed homoplasies (black line) is shown +/− two s.e. (grey lines). Above, mobile elements that are significantly associated (P<0.05) with more (red) or fewer (blue) homoplasies are shown, with deeper shading for greater significance. The yellow line shows the smoothed estimate of the mean number of predicted homoplasies per BiP based on the regression model. The origin-of-replication occurs at position zero (extreme left and right side of the figure because of the circular nature of the chromosome).
Figure 3
Figure 3. Recombination hotspot associated with the ICE6013 conjugative transposon.
(a) Pairwise LD plot. Red colouring indicates evidence for recombination between core BiPs, because they fail the four gamete test. Increasingly blue colouring indicates evidence against recombination, due to increasingly high r2. The positions of core BiPs in MRSA252 are indicated by corresponding black lines. (b) Alignment of five reference genomes in the region, with genes annotated. Dark grey bands between genomes indicate homology. Increasingly dark blue shading of genes indicates a higher frequency across the 110 genomes. Light grey shading indicates a pseudogene. (c) Smoothed number of observed homoplasies (black line), +/− two s.e. (grey lines). Whole-genome alignments were obtained from WebACT and plotted using genoPlotR.
Figure 4
Figure 4. Recombination hotspot associated with the SCC.
(a) Pairwise LD plot. Red colouring indicates evidence for recombination between core BiPs, because they fail the four gamete test. Increasingly blue colouring indicates evidence against recombination, due to increasingly high r2. The positions of core BiPs in MRSA252 are indicated by corresponding black lines. (b) Alignment of five reference genomes in the region, with genes annotated. Dark grey bands between genomes indicate homology. Increasingly dark blue shading of genes indicates a higher frequency across the 110 genomes. Light grey shading indicates a pseudogene. (c) Smoothed number of observed homoplasies (black line), +/− two s.e. (grey lines). Whole-genome alignments were obtained from WebACT and plotted using genoPlotR.

Similar articles

Cited by

References

    1. Ochman H., Lawrence J. G. & Groisman E. A. Lateral gene transfer and the nature of bacterial innovation. Nature 405, 299–304 (2000). - PubMed
    1. Fraser C., Hanage W. P. & Spratt B. G. Recombination and the nature of bacterial speciation. Science 315, 476–480 (2007). - PMC - PubMed
    1. Croll D. & McDonald B. A. The accessory genome as a cradle for adaptive evolution in pathogens. PLoS Pathog. 8, e1002608 (2012). - PMC - PubMed
    1. Wright G. D. The antibiotic resistome: the nexus of chemical and genetic diversity. Nat. Rev. Microbiol. 5, 175–186 (2007). - PubMed
    1. MacLean R. C., Hall A. R., Perron G. G. & Buckling A. The population genetics of antibiotic resistance: integrating molecular mechanisms and treatment contexts. Nat. Rev. Genet. 11, 405–414 (2010). - PubMed

Publication types

MeSH terms

Substances

LinkOut - more resources