. 2014 May 20;106(10):2096-104.
doi: 10.1016/j.bpj.2014.03.044.

Independent synchronized control and visualization of interactions between living cells and organisms

Affiliations

Independent synchronized control and visualization of interactions between living cells and organisms

Vincent Rouger et al. Biophys J. .

Abstract

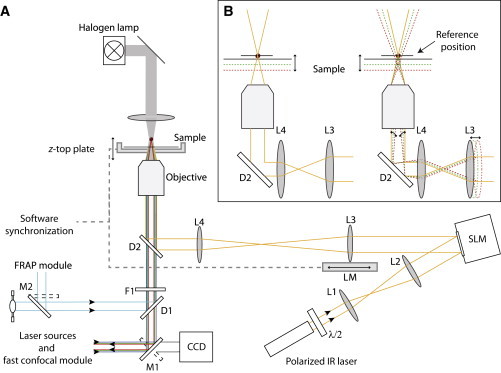
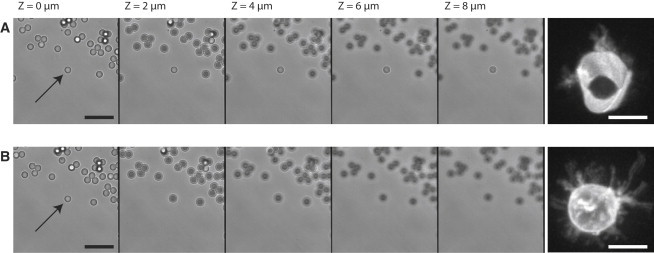
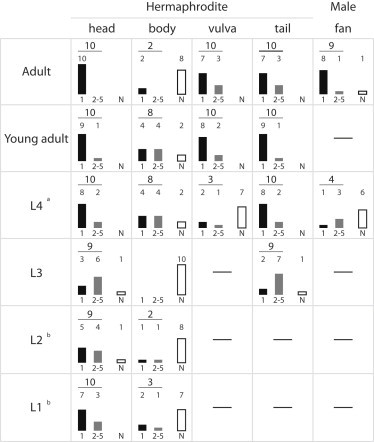
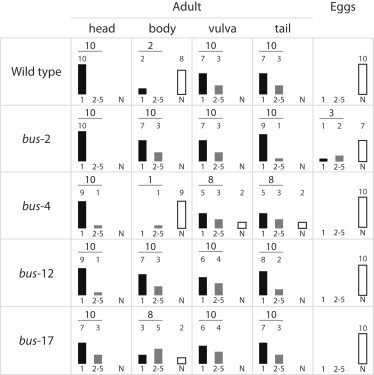
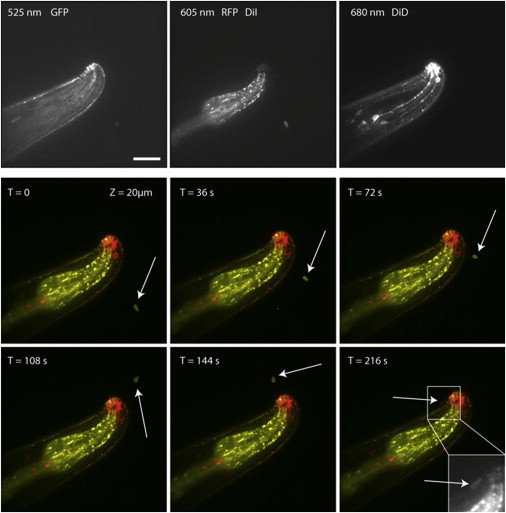
To investigate the early stages of cell-cell interactions occurring between living biological samples, imaging methods with appropriate spatiotemporal resolution are required. Among the techniques currently available, those based on optical trapping are promising. Methods to image trapped objects, however, in general suffer from a lack of three-dimensional resolution, due to technical constraints. Here, we have developed an original setup comprising two independent modules: holographic optical tweezers, which offer a versatile and precise way to move multiple objects simultaneously but independently, and a confocal microscope that provides fast three-dimensional image acquisition. The optical decoupling of these two modules through the same objective gives users the possibility to easily investigate very early steps in biological interactions. We illustrate the potential of this setup with an analysis of infection by the fungus Drechmeria coniospora of different developmental stages of Caenorhabditis elegans. This has allowed us to identify specific areas on the nematode's surface where fungal spores adhere preferentially. We also quantified this adhesion process for different mutant nematode strains, and thereby derive insights into the host factors that mediate fungal spore adhesion.


Figures

Figure 1
Figure 1
Overview and schematic of the experimental setup. (A) Instrument layout showing the illumination path for brightfield (gray), fluorescence excitation and emission (dark blue, green, and red) and FRAP and arc lamp (cyan) and the trapping IR beam (orange). Mirrors (M1 and M2), dichroic mirrors (D1 and D2), λ/2 wave plate (λ/2), lenses (L1–L4), spatial light modulator (SLM), linear motor (LM), IR filter (F1), and CCD camera (CCD). The gray dotted line represents the software synchronization between the trapping and imaging modules. Two EM-CDD cameras record filtered fluorescence signals coming from the spinning disk confocal module. (B) Representation of L3 motion effect on the trap focalization during 3D sample imaging. On the left side, the focal plane of the trapped object is not dissociated from the one of 3D imaging. On the right side, the displacement of L3 by LM is synchronized compensating the z-displacement of the imaging module and keeping the trap at its reference position. At other positions than the initial one, the IR laser becomes decollimated, this modifies the trapping force (Fig. S5).
Figure 2
Figure 2
Effect of uncoupling trap from imaging on the 3D image reconstruction of a trapped object. In (A) and (B), on the left panels, a single latex bead (arrow) from the ones settled down on the cover glass is trapped, moved by the z-top plate and imaged in brightfield (scale bar, 10 μm); on the right panels, a CD45 membrane-stained T cell hybridoma (CD4 3A9 T cell) was trapped and observed by confocal imaging (stack of 20 images at 1 μm intervals). Scale bar, 15 μm. (A) The sample was moved by the z-top plate without synchronization (Fig. 1B, left panel). The trapped bead stays in the focal plane, whereas beads on the cover glass are defocused. As a consequence, a trapped object is constantly viewed through the identical focal plane all along the stack as illustrated on the right panel with a 3D-image of a cell. (B) Same experiments but with the trapped object maintained in its reference position by synchronization (Fig. 1B, right panel). The trapped bead appears defocused as the ones on the cover glass. On the right, 3D image reconstruction of a trapped cell becomes possible from the stack of images recorded at different altitudes. See also Movie S1 and Movie S2, on beads and cells, respectively.
Figure 3
Figure 3
Calibration of the lens displacement compensating the z-top plate motion. (A) Brightfield images of a latex bead (3 μm in diameter) at different altitudes. Out of focus position changes the image of the bead with a white or black centroid above and below the reference plane, respectively. These well-defined changes in the bead shape are used to control L3 position thanks to additional beads settled on the cover glass. 40 × objective and scale bar, 5 μm. (B) Calibration data reported for different combinations of objectives (40 × or 100 × objective) and L3 lenses (100 or 125 mm focal length): 40 ×/100 mm (solid circle), 40 ×/125 mm (solid square), 100 ×/100 mm (open circle) and 100 ×/125 mm (open square). All of the experimental data were fitted with Eq. 1 except the 100 ×/100 mm data fitted with Eq. 2. Fitting parameters are configured in the synchronization module of the Visiview software (Fig. S4).
Figure 4
Figure 4
Multiple spatiotemporal trajectories to analyze spore-worm interactions. (A) Sedated worms can be moved by the xyz stage of the microscope to contact a stationary trapped spore(s). In the case of multiple traps, the spores were moved together with identical displacement. (B) Alternatively, trapped spore(s) can be moved in all directions by HOT. Moreover, each trap is independent both in space and time. Directional movements are indicated by red lines in the xy plane and by a circle in the z axis; the direction by an arrow; multiple arrows represent different arrival times. Movies S3–S5 illustrates the different modes of analysis of D. coniospora spore adhesion on C. elegans.
Figure 5
Figure 5
D. coniospora adhesion on C. elegans at different stages of development. The adhesion tests were performed on different areas of hermaphrodites or males at different stages of development as delineated in Fig. S6. A test is positive 1), if adhesion occurred during the course of HOT contacts between spore and worm and 2), if the association was stable enough not to be dissociated by HOT. In each case, the black column represent the number of spores that stuck to the worm following a single contact, the gray column is the cumulative number of adhered spores following between two and five trials; the white column represents the number of unsuccessful adhesion tests (i.e., following five trials). In most cases, a failure to adhere upon first contact as the result of an unsuitable orientation of the spore. aOnly a precursor of the vulva at this stage. bUncontrolled motion of the worm tail prevent the experiment.
Figure 6
Figure 6
D. coniospora adhesion on adults or eggs of different mutants of C. elegans. Results are expressed as in Fig. 5.
Figure 7
Figure 7
Early adhesion of a single spore on C. elegans by 3D multicolor confocal imaging. An adult nematode carrying GFP and RFP markers in the apical epidermis and pharynx, respectively, is visualized after staining its cuticle and neurons with DiD. A fungal spore stained with DiI (arrow) is trapped to contact the head area of the worm by HOT. The system allows the sample visualization in 3D before and during the adhesion process. Inset at T = 216 s: magnified DiI/mRFP fluorescence image of the contacted area showing the spore along the worm. See Movie S6. Scale bar, 20 μm.

References

    1. Yamada S., Nelson W.J. Synapses: sites of cell recognition, adhesion, and functional specification. Annu. Rev. Biochem. 2007;76:267–294. - PMC - PubMed
    1. Grakoui A., Bromley S.K., Dustin M.L. The immunological synapse: a molecular machine controlling T cell activation. Science. 1999;285:221–227. - PubMed
    1. Monks C.R., Freiberg B.A., Kupfer A. Three-dimensional segregation of supramolecular activation clusters in T cells. Nature. 1998;395:82–86. - PubMed
    1. Stuart L.M., Ezekowitz R.A. Phagocytosis and comparative innate immunity: learning on the fly. Nat. Rev. Immunol. 2008;8:131–141. - PubMed
    1. Wang Y., Botvinick E.L., Chien S. Visualizing the mechanical activation of Src. Nature. 2005;434:1040–1045. - PubMed

Publication types

LinkOut - more resources