. 2014 May 20;106(10):2222-32.
doi: 10.1016/j.bpj.2014.03.048.

Voltage and calcium dynamics both underlie cellular alternans in cardiac myocytes

Affiliations

Voltage and calcium dynamics both underlie cellular alternans in cardiac myocytes

Willemijn Groenendaal et al. Biophys J. .

Abstract

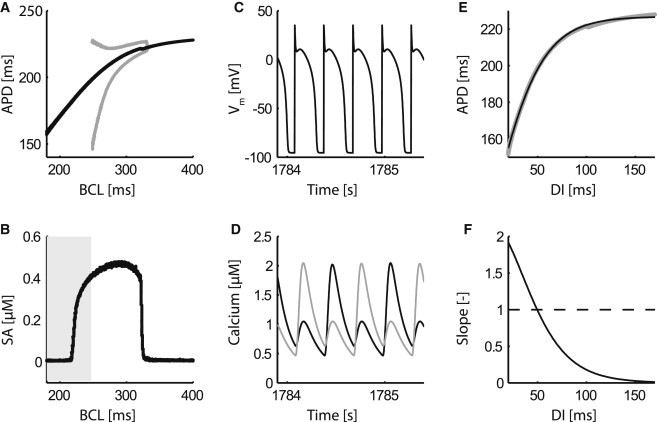
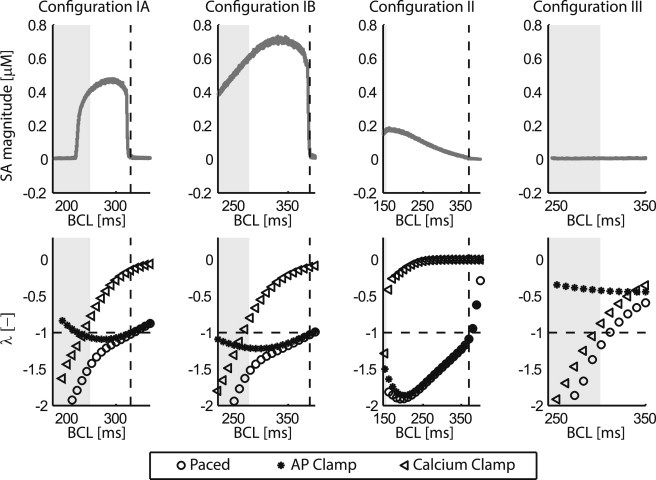
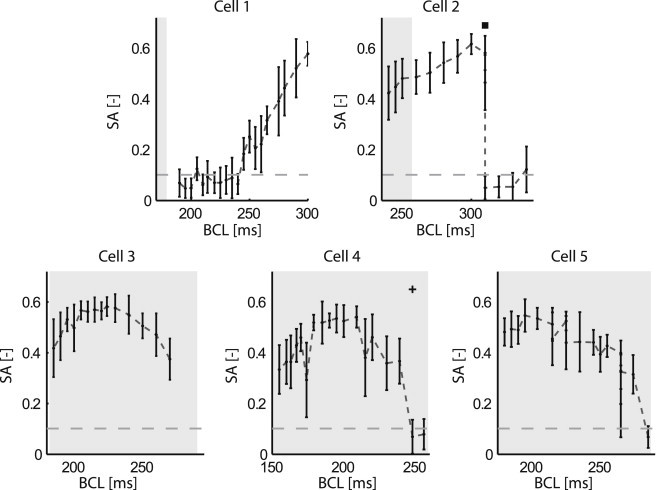
Cardiac alternans, a putative trigger event for cardiac reentry, is a beat-to-beat alternation in membrane potential and calcium transient. Alternans was originally attributed to instabilities in transmembrane ion channel dynamics (i.e., the voltage mechanism). As of this writing, the predominant view is that instabilities in subcellular calcium handling are the main underlying mechanism. That being said, because the voltage and calcium systems are bidirectionally coupled, theoretical studies have suggested that both mechanisms can contribute. To date, to our knowledge, no experimental evidence of such a dual role within the same cell has been reported. Here, a combined electrophysiological and calcium imaging approach was developed and used to illuminate the contributions of voltage and calcium dynamics to alternans. An experimentally feasible protocol, quantification of subcellular calcium alternans and restitution slope during cycle-length ramping alternans control, was designed and validated. This approach allows simultaneous illumination of the contributions of voltage and calcium-driven instability to total cellular instability as a function of cycle-length. Application of this protocol in in vitro guinea-pig left-ventricular myocytes demonstrated that both voltage- and calcium-driven instabilities underlie alternans, and that the relative contributions of the two systems change as a function of pacing rate.


Figures

Figure 1
Figure 1
Voltage and subcellular calcium dynamics during static pacing and alternans control. At static pacing (BCL 300 ms), cellular alternans appear in APD and calcium transient for all model configurations (top two rows). During alternans control stimulation (BCL 300 ms), SA appear for model configurations IA, IB, and II, but a spatially concordant period-1 rhythm in the calcium dynamics appeared for configuration III (middle rows, right column). During alternans control stimulation at BCL 250 ms (configurations IB and III) or 200 ms (configurations IA and II), SA appeared only for configurations IB and II (bottom rows, middle columns). The SA patterns present in these simulations are visualized (insets in calcium transient panels) with the colors of the regions corresponding to the colors of the calcium transients. When either cellular alternans or a spatially concordant period-1 rhythm is present, the simulated cell is divided in two halves (dashed gray line overlaps with the solid black line).
Figure 2
Figure 2
Voltage and subcellular calcium dynamics during the ramp protocol for mixed instability model configuration IA. The cycle-length ramp during alternans control allows sampling of BCL and APD over a large range without the presence of alternans (panel A, black line). Panel B shows SA during the alternans control trial (i.e., same trial as black line in panel A), showing that the onset of SA (∼330 ms) is at approximately the same BCL as the alternans onset bifurcation in the uncontrolled trial of panel A (gray line). SA disappears at a BCL of ∼217 ms. (Shaded area) Cycle lengths at which the slope of the fit of the restitution curve is >1. The successfully controlled period-1 action potentials (C) coincided with SA (D), which is illustrated by the intracellular calcium dynamics of two individual sarcomeres in the model (sarcomere 10 and 60). Plots of the restitution curve (gray line) with sigmoid fit (black line) (E) and its slope (F) during alternans control show that the slope of the restitution curve becomes larger than 1 at a DI that corresponds to a BCL of 247 ms.
Figure 3
Figure 3
Comparison of the alternans-control ramp protocol with eigenvalue analysis identifies two experimentally feasible measures. SA and restitution during the ramp protocol (top) were compared with the eigenvalue analysis (bottom) for four model configurations. (Shaded area) Cycle-length values at which the slope of the restitution curve is >1. (Vertical dashed line) Eigenvalue-calculated onset of calcium instability. Eigenvalue analysis was performed for a model that is sequentially paced, action-potential clamped, and calcium-transient clamped, which gives measures for whole-cell, calcium-, and voltage-driven instability, respectively. Note that λ-values <−2 are not visualized for clarity reasons only. Lambda values <−1 indicate instability. The stability analysis from BCL 200–370 ms for model configuration IA was also shown by Gaeta et al. (22). The comparison shows that the presence of SA is correlated with calcium-driven instability (vertical dashed line) and the slope of the restitution curve >1 (shaded area) is related to voltage-driven instability.
Figure 4
Figure 4
Voltage and calcium dynamics during the alternans-control ramp protocol in an in vitro ventricular myocyte. Experimental results are shown for cell 3. SA was present during alternans control stimulation over a range of cycle lengths (185–280 ms) (A). The error bars in panel A represent the standard deviation in SA magnitude over the 5-s imaging time period. (Gray dashed line) Average SA magnitude (average for cells 2–5) at static pacing at cycle lengths 950–1000 ms, where no SA was present in the recordings. This value quantifies the effect of noise in the calculation of the SA magnitude and, thus, represents a threshold value for the presence of SA. (Shaded area in panel A) Cycle lengths for which voltage instability is predicted using the slope of the sigmoid fit of the restitution curve. During alternans-control stimulation at a BCL of 220 ms, the voltage dynamics showed a period-1 rhythm (B), whereas the calcium dynamics showed SA (C). The slope (E) of the sigmoid fit (black line in D) of the constant-memory restitution curve (gray dots in panel D represent all beats) shows that the voltage system became unstable at a DI corresponding to a cycle length of 290 ms.
Figure 5
Figure 5
Overview of the application of the alternans-control ramp protocol to five ventricular myocytes. Individual panels show SA progression in each cell as a function of cycle length. (dashed line) Average SA magnitude (average for cells 2–5) at static pacing at cycle lengths 950–1000 ms (Note that these dynamics were not recorded for cell 1, but the metric is still shown as a guide), where no SA was present in the recordings. This value quantifies the effect of noise in the calculation of the SA magnitude and, thus, represents a threshold value for the presence of SA. The plus sign (+) indicates the presence of alternans in the calcium dynamics at a BCL of 248 ms for cell 4, whereas the square (▪) indicates three fluorescence recordings for cell 2 at BCL 310 ms, of which the first recording showed cellular calcium alternans (below SA threshold), which transformed to SA during recordings 2 and 3 (above SA threshold). Fluorescence recordings for cell 2 with a BCL > 310 ms showed no calcium alternans and no SA. (Shaded areas) Cycle length at which voltage is predicted to be unstable by using the slope of the monoexponential fit of the constant memory restitution curve for cells 1, 2, 4, and 5 and the slope of the sigmoid fit for cell 3. The presence of SA and the slope of the constant memory restitution curve > 1 indicate a role for both voltage- and calcium-driven instability.

References

    1. Pastore J.M., Girouard S.D., Rosenbaum D.S. Mechanism linking T-wave alternans to the genesis of cardiac fibrillation. Circulation. 1999;99:1385–1394. - PubMed
    1. Narayan S.M. T-wave alternans and the susceptibility to ventricular arrhythmias. J. Am. Coll. Cardiol. 2006;47:269–281. - PubMed
    1. Rosenbaum D.S., Jackson L.E., Cohen R.J. Electrical alternans and vulnerability to ventricular arrhythmias. N. Engl. J. Med. 1994;330:235–241. - PubMed
    1. Fox J.J., McHarg J.L., Gilmour R.F., Jr. Ionic mechanism of electrical alternans. Am. J. Physiol. Heart Circ. Physiol. 2002;282:H516–H530. - PubMed
    1. Koller M.L., Riccio M.L., Gilmour R.F., Jr. Dynamic restitution of action potential duration during electrical alternans and ventricular fibrillation. Am. J. Physiol. 1998;275:H1635–H1642. - PubMed

Publication types

LinkOut - more resources