Comment
. 2014 May 21;82(4):725-7.
doi: 10.1016/j.neuron.2014.05.008.

Channeling the Central Dogma

Affiliations
Comment

Channeling the Central Dogma

Ronald L Calabrese. Neuron. .

Abstract

How do neurons and networks achieve their characteristic electrical activity, regulate this activity homeostatically, and yet show population variability in expression? In this issue of Neuron, O'Leary et al. (2014) address some of these thorny questions in this theoretical analysis that starts with the Central Dogma.


Figures

Figure 1
Figure 1
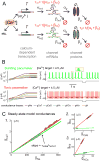
Channeling the Central Dogma. A. A simple biochemical scheme for activity-dependent ion channel expression. Channel mRNAs are synthesized at a channel-specific rate,αmi, that depends on a Ca2+-activated universal transcription factor, T, and are degraded at rate,βmi. Functional channel proteins are produced at a uniform rate,αg,from mRNAs and degraded at a uniform rate,βg. B. Examples of two cell types produced from the same set of seven voltage-dependent channel types (indicated below as gi's: gNa, fast sodium; gCaS, slow Ca; gCaT, transient Ca; gKA, A-type/transient potassium; gKCa, Ca-dependent potassium; gKdr, delayed-rectifier potassium; gH, hyperpolarization-activated mixed-cation). Left-hand plots: log-log plots of maximal conductance () evolution over time. Each example has a different set of regulation time-constants (τmi's) for the conductances. Total duration for all simulations is 10 * τg. Right-hand plots: membrane potential traces with current injection traces (-500 pA) shown below. C. Scatter plots of steady-state maximal conductances in each cell type shown in B after 20 independent runs. Straight lines are calculated from the ratio of regulation time-constants for each pair of conductances in each cell type. Adapted from O'Leary et al. (2014).

Comment on

References

    1. Amendola J, Woodhouse A, Martin-Eauclaire MF, Goaillard JM. Ca2+/cAMPsensitivecovariation of I(A) and I(H) voltage dependences tunes rebound firing in dopaminergic neurons. J Neurosci. 2012;32:2166–2181. - PMC - PubMed
    1. Davis GW. Homeostatic control of neural activity: from phenomenology to molecular design. Annu Rev Neurosci. 2006;29:307–323. - PubMed
    1. Hudson AE, Prinz AA. Conductance Ratios and Cellular Identity. Plos Computational Biology. 2010;6 - PMC - PubMed
    1. Krenz WD, Hooper RM, Parker AR, Prinz AA, Baro DJ. Activation of high and low affinity dopamine receptors generates a closed loop that maintains a conductance ratio and its activity correlate. Front Neural Circuits. 2013;7:169. - PMC - PubMed
    1. LeMasson G, Marder E, Abbott LF. Activity-dependent regulation of conductances in model neurons. Science. 1993;259:1915–1917. - PubMed

LinkOut - more resources