. 2014 May 21;82(4):809-21.
doi: 10.1016/j.neuron.2014.04.002.

Cell types, network homeostasis, and pathological compensation from a biologically plausible ion channel expression model

Affiliations

Cell types, network homeostasis, and pathological compensation from a biologically plausible ion channel expression model

Timothy O'Leary et al. Neuron. .

Erratum in

Abstract

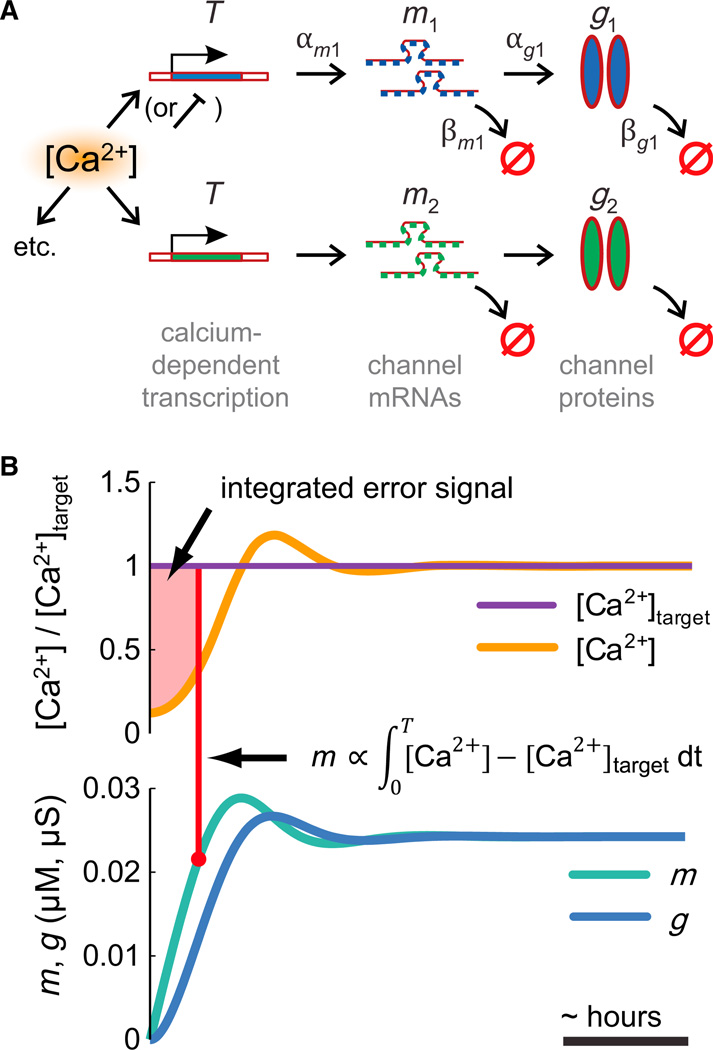
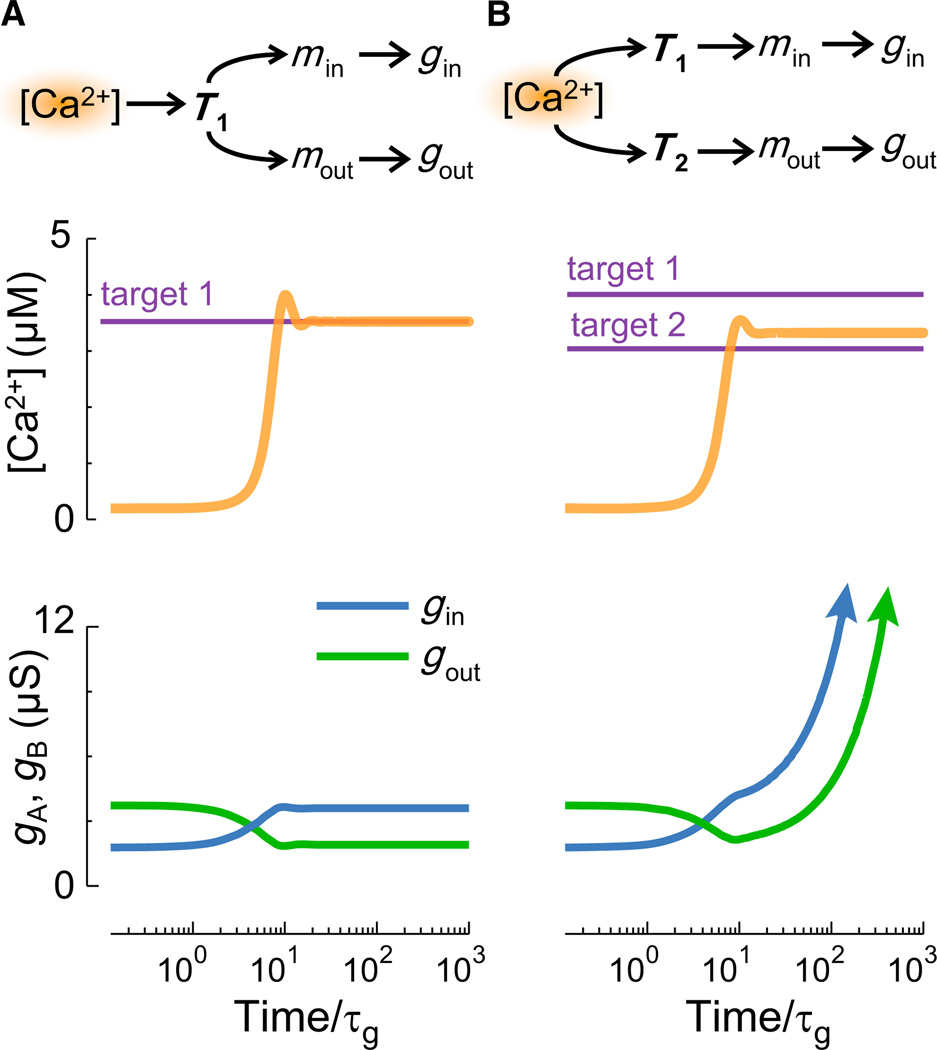
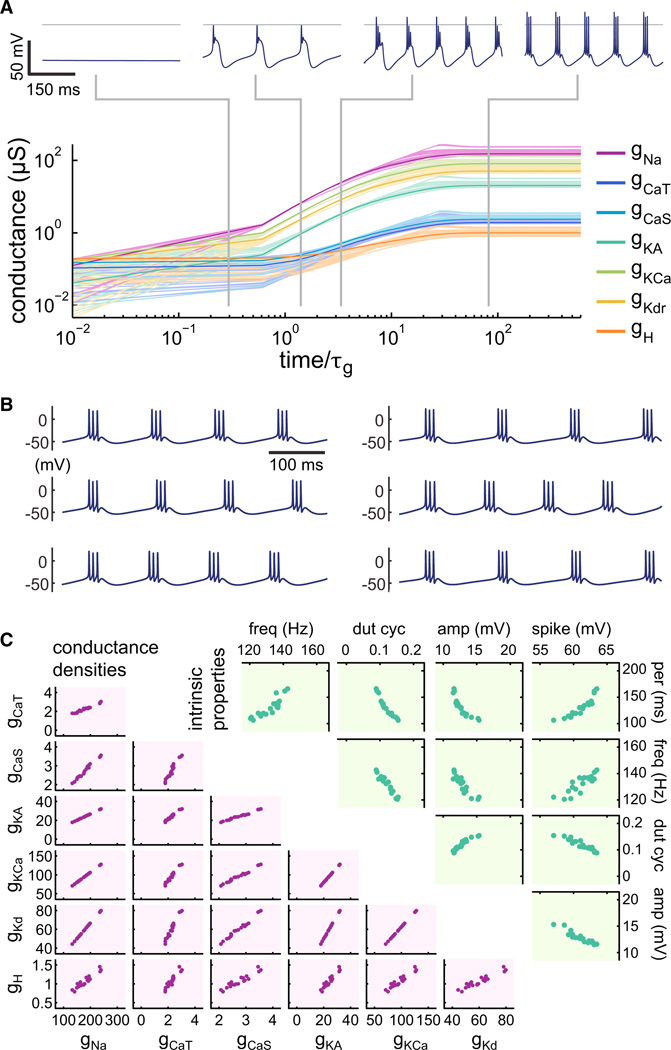
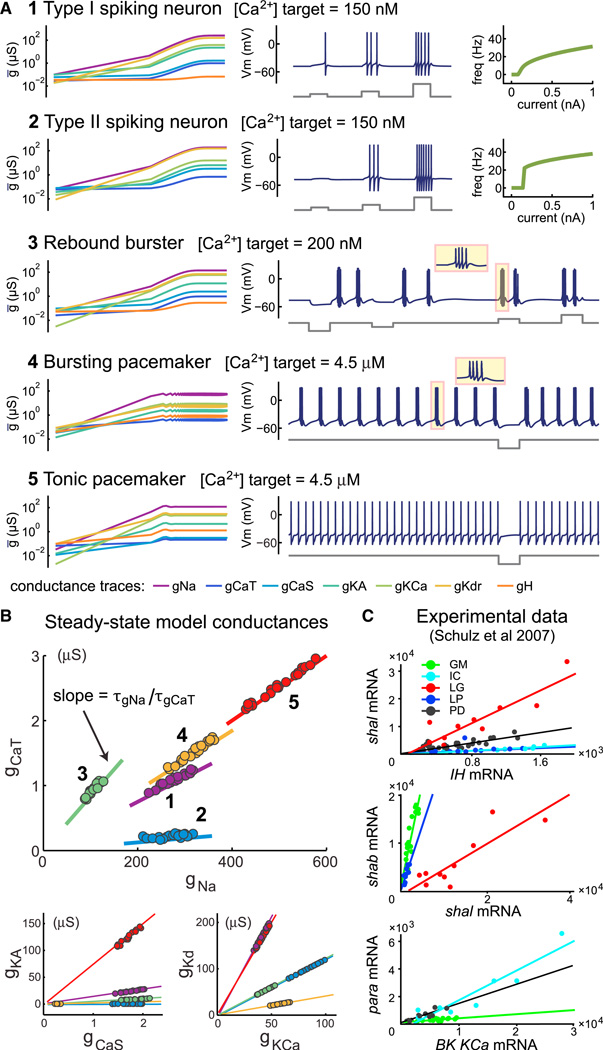
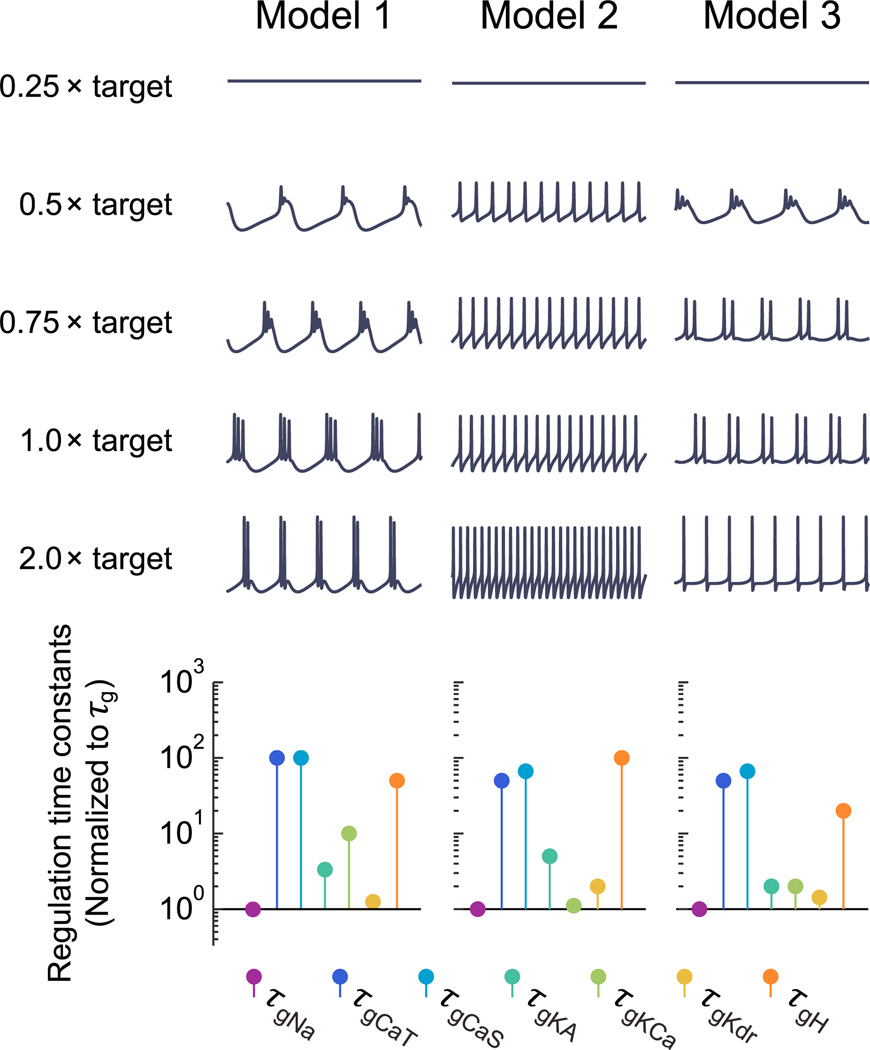
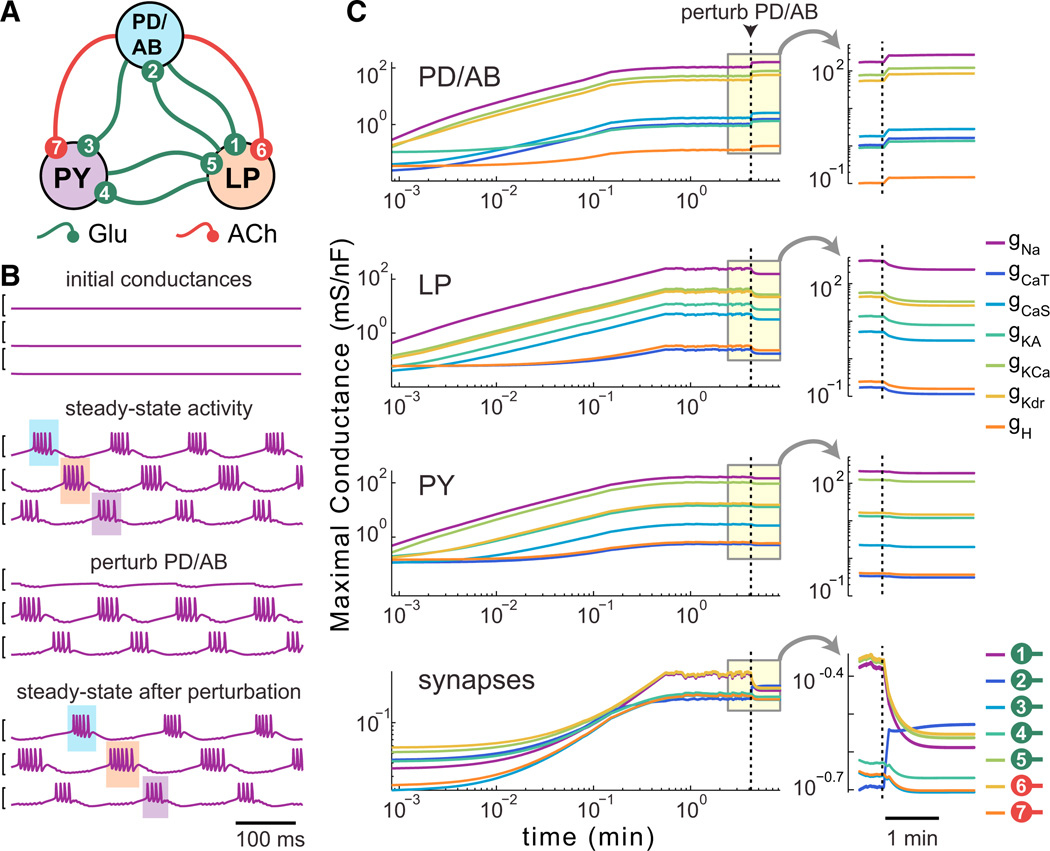
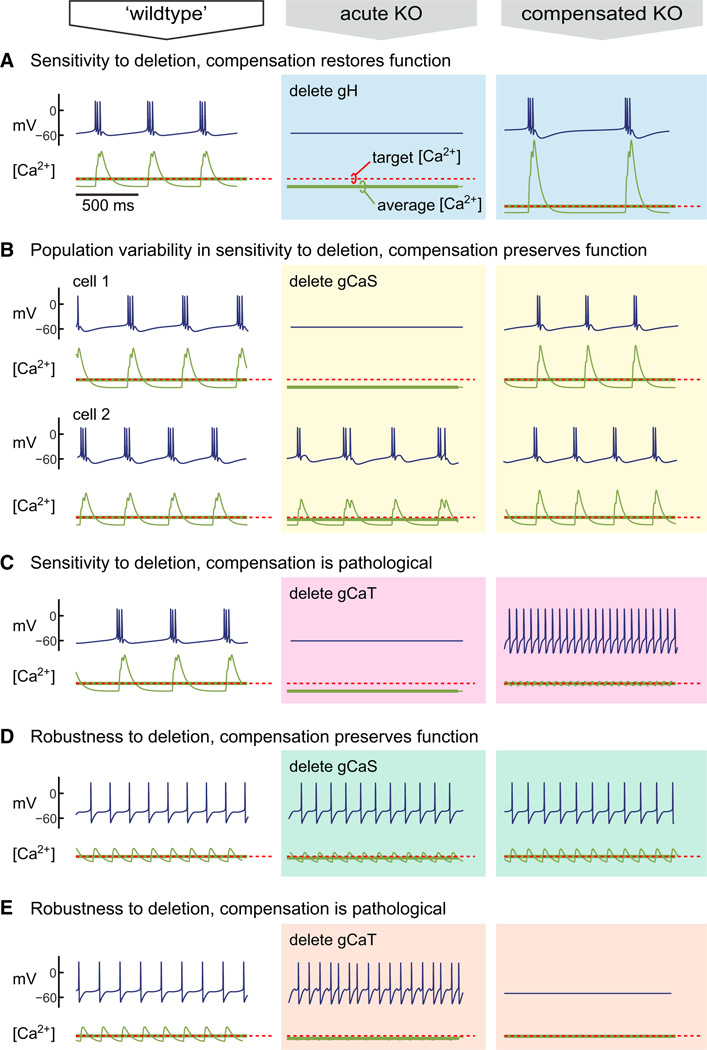
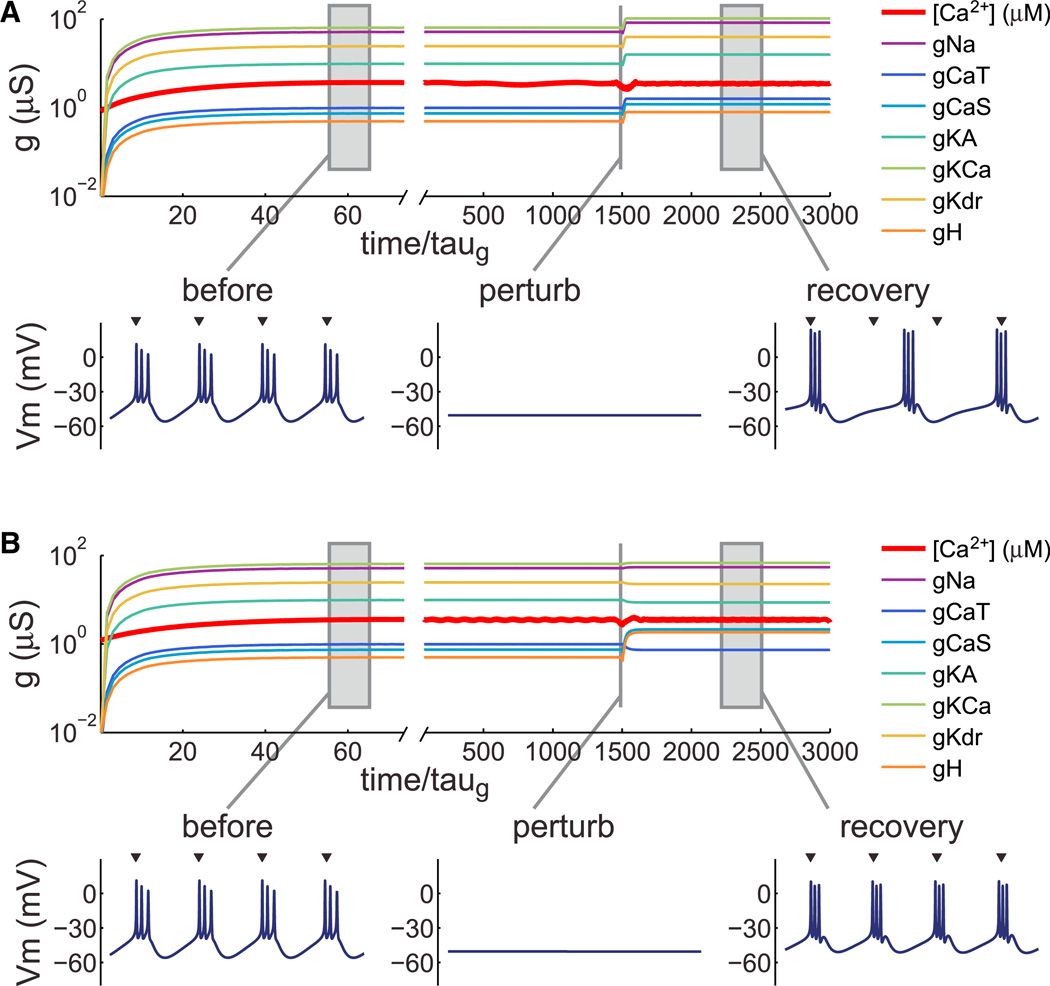
How do neurons develop, control, and maintain their electrical signaling properties in spite of ongoing protein turnover and perturbations to activity? From generic assumptions about the molecular biology underlying channel expression, we derive a simple model and show how it encodes an "activity set point" in single neurons. The model generates diverse self-regulating cell types and relates correlations in conductance expression observed in vivo to underlying channel expression rates. Synaptic as well as intrinsic conductances can be regulated to make a self-assembling central pattern generator network; thus, network-level homeostasis can emerge from cell-autonomous regulation rules. Finally, we demonstrate that the outcome of homeostatic regulation depends on the complement of ion channels expressed in cells: in some cases, loss of specific ion channels can be compensated; in others, the homeostatic mechanism itself causes pathological loss of function.


Figures

Figure 1
Figure 1. Integral Control from the Canonical Model of Gene Expression
(A) A simple biochemical scheme for activity-dependent ion channel expression. Channel mRNAs are produced at a rate αm that depends on a Ca2+-activated factor, T, and degraded at rate βm Functional channel proteins are produced at a rate αg from mRNAs and degraded at a rate βg. (B) The scheme in (A) is equivalent to an integral controller. Error (deviation from [Ca2+] target, [Ca2+]tgt) is accumulated in the mRNA (m) concentration (shaded region), which causes a change in ion channel expression (g).
Figure 2
Figure 2. A Potential Problem with Multiple Regulators
A model cell with one inward and one outward leak conductance implements integral control to maintain a target [Ca2+] (Supplemental Experimental Procedures). Time is normalized to conductance expression rate, τg. (A) A single master regulator, T1, produces a stable model. (B) Two separate regulators T1 and T2 with nonequal targets lead to an unbounded (arrows) increases in conductance.
Figure 3
Figure 3. Regulation in a Complex Biophysical Cell Model
(A) Time evolution of a self-regulating neuron implementing integral control for its seven voltage-dependent conductances (fast sodium, gNa; slow Ca2+gCaS; transient Ca2+gCaT; A-type/transient potassium, gKA; Ca2+-dependent potassium, gKCa; delayed-rectifier potassium, gKd; hyperpolarization-activated mixed-cation, gH). A total of 20 independent runs are shown with mean in bold; axes are log-log; timeis normalized to τg. (Top) Voltage traces for an example neuron at the stages indicated. (B) Examples of steady-state behavior of the bursting pacemaker from six independent runs. (C) Scatter plots of conductance distributions (bottom left) and intrinsic properties (top right) at steady state of the 20 neurons from the independent runs in (A). Intrinsic properties are as follows: intraburst spike frequency (freq), burst duty cycle (dut cyc), slow-wave amplitude (amp), spike height (spike), and burst period (per).
Figure 4
Figure 4. Specifying Different Cell Types with the Same Model
(A) Example cell types produced from the same set of seven voltage-dependent conductances. (Left-hand plots) Log-log plots of conductance evolution over time. Each example has a different set of regulation time constants for the conductances (Experimental Procedures). Total duration for all simulations is 10×τg. (Right-hand plots) Membrane potential traces with current injection traces shown below. FI (frequency versus current amplitude) plots are shown for the type I/II neurons (1 and 2). Current injection amplitudes for each example are as follows: 100, 200, and 500 pA for 1 and 2; −200, −100, 100, and 200 pA for 3; −500 pA for 4 and 5. Time base for all membrane potential traces (from duration of current pulse): 500 ms. (B) Scatter plots of steady-state conductances in each cell type (1–5) shown in (A) after 20 independent runs. Straight lines are calculated from the ratio of regulation time constants for each pair of conductances in each cell type; see Equation 4. (C) Experimental data reproduced from Schulz et al. (2007) showing cell-type-specific correlations in ion channel gene expression. Quantitative PCR was performed on ion channel mRNAs obtained from single identified cells in the crab STG (cell types shown are GM, IC, LG, LP, and PD).
Figure 5
Figure 5. Changing Targets within Cell Types
Each column shows 500 ms segments of steady-state membrane potential activity in a different self-regulating model at steady state with the [Ca2+] target (= 4 µM) scaled. The regulation time constants for each conductance are shown below, normalized to τg.
Figure 6
Figure 6. A Self-Assembling, Self-Regulating Central Pattern Generating Network
(A) Connectivity diagram of the model CPG, based on the synaptic connectivity of the pyloric network in the crustacean STG (PD/AB, pyloric dilator/ anterior burster; LP, lateral pyloric cell; PY, pyloric cell). The PD/AB pacemaker kernel is modeled as a single cell. All synapses are inhibitory and graded; glutamate (Glu) synapses are instantaneous, acetylcholine (ACh) synapses are slow (activation time constant = 50 ms). (B) (Top) Example membrane potential traces for random initial conductances. (Second from top) Example steady-state behavior of the model. The triphasic order (PD, LP, PY) is highlighted with shaded boxes. (Third from top) Perturbation of network activity by addition of hyperpolarizing (reversal potential = −80 mV) conductance to PD. (Bottom) steady-state recovery of the network with hyperpolarizing conductance still present. All traces = 1 s. (C) Example time evolution of intrinsic and synaptic conductances in a self-regulating pyloric network model for a single run. Onset of the PD/AB perturbation is indicated by the vertical line. Insets show detail of the conductance dynamics on a linear timescale.
Figure 7
Figure 7. Outcome of Homeostatic Compensation after Channel Deletion Depends on Cell and Channel Type
Membrane potential activity for a self-regulating bursting ([A]–[C]) and tonic ([D] and [E]) pacemaker models in which specific conductances are deleted. The first column (“wild-type”) shows model behavior at steady state with all conductances present. Acute deletion of the indicated conductance produces the behavior shown in the middle column (“acute KO”). Following conductance deletion, each model is allowed to reach steady state (third column, “compensated KO”).
Figure 8
Figure 8. Switching Regulation Rates in the Same Cell Can Preserve Specific Properties
(A) Conductance regulation in a bursting pacemaker neuron. Membrane potential traces (500 ms duration) are shown at steady state, at the onset of a perturbation (hyperpolarizing leak), and at steady state following perturbation. Arrowheads above the rightmost trace indicate burst onset times of the unperturbed neuron, aligned to the first burst. (B) Evolution of the same model as (A), but with regulation rule switched prior to the onset of the perturbation. Regulation time constants following the switch were chosen to preserve burst duration (see Experimental Procedures). Arrowheads as in (A). Membrane potential trace durations: 500 ms.

Comment in

  • Channeling the Central Dogma.
    Calabrese RL. Calabrese RL. Neuron. 2014 May 21;82(4):725-7. doi: 10.1016/j.neuron.2014.05.008. Neuron. 2014. PMID: 24853932 Free PMC article.

References

    1. Abbott L, LeMasson G. Analysis of neuron models with dynamically regulated conductances. Neural. Comput. 1993;5:823–842.
    1. Alon U. An Introduction to Systems Biology: Design Principles of Biological Circuits. Boca Raton: Chapman & Hall/CRC; 2007.
    1. Alon U, Surette MG, Barkai N, Leibler S. Robustness in bacterial chemotaxis. Nature. 1999;397:168–171. - PubMed
    1. Amendola J, Woodhouse A, Martin-Eauclaire MF, Goaillard JM. Ca2+/cAMP-sensitive covariation of I(A) and I(H) voltage dependences tunes rebound firing in dopaminergic neurons. J. Neurosci. 2012;32:2166–2181. - PMC - PubMed
    1. Baccaglini PI, Spitzer NC. Developmental changes in the inward current of the action potential of Rohon-Beard neurones. J. Physiol. 1977;271:93–117. - PMC - PubMed

Publication types