. 2014 Aug;35(25):6667-76.
doi: 10.1016/j.biomaterials.2014.04.080. Epub 2014 May 20.

The potential of label-free nonlinear optical molecular microscopy to non-invasively characterize the viability of engineered human tissue constructs

Affiliations

The potential of label-free nonlinear optical molecular microscopy to non-invasively characterize the viability of engineered human tissue constructs

Leng-Chun Chen et al. Biomaterials. 2014 Aug.

Abstract

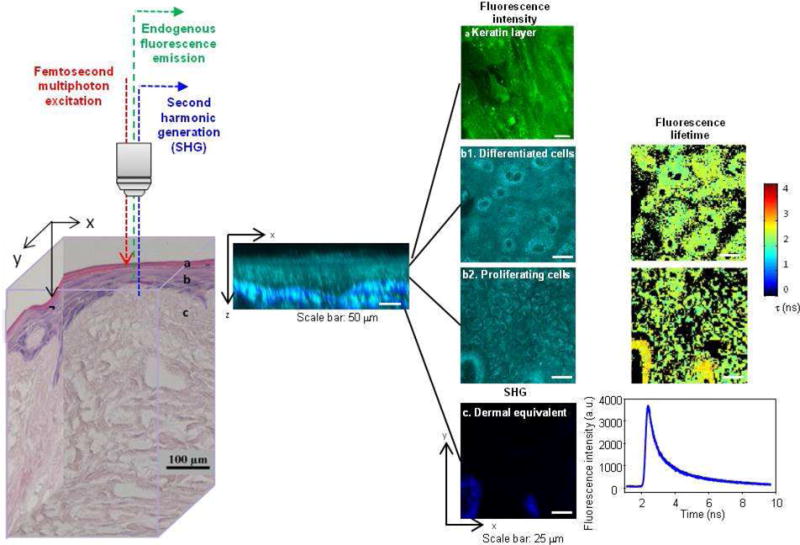
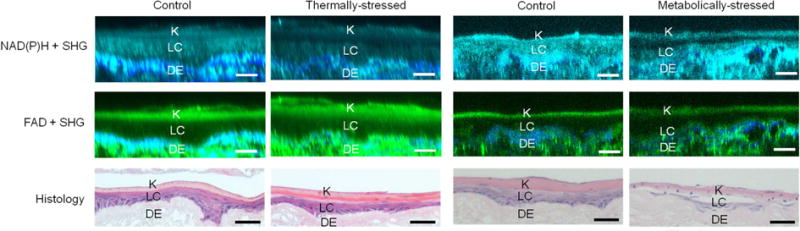
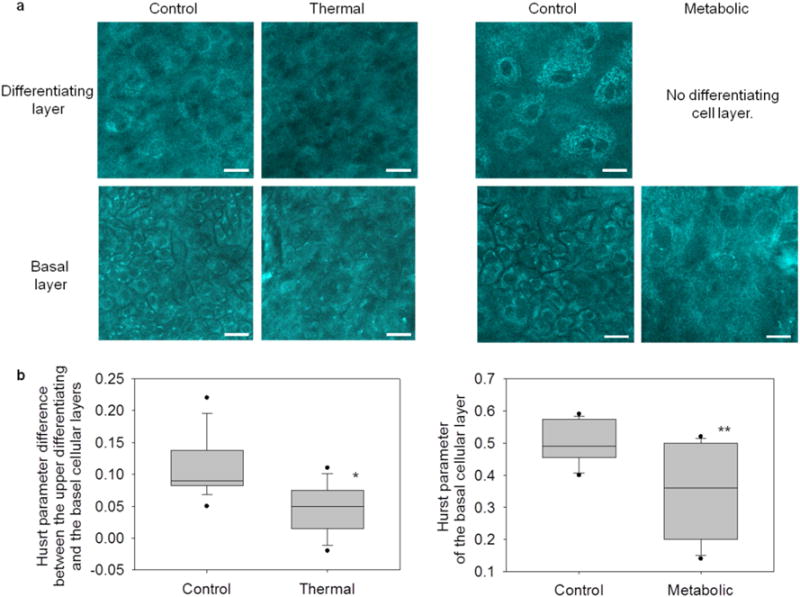
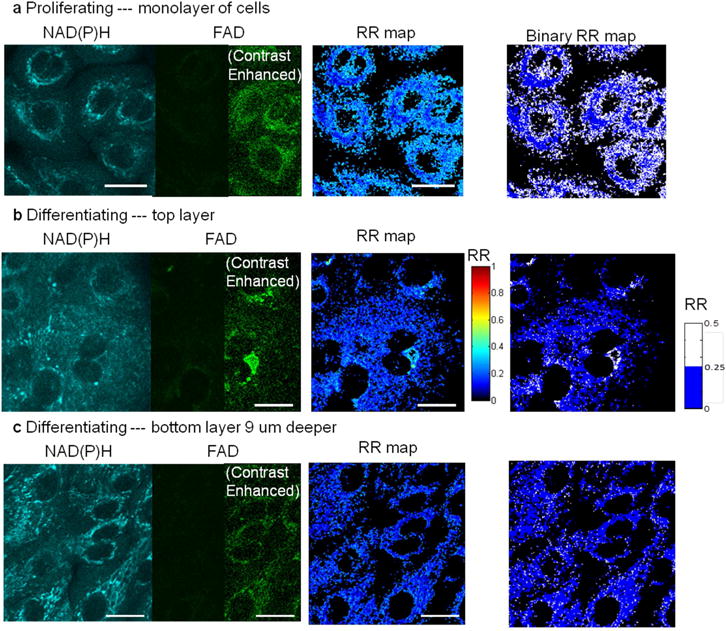
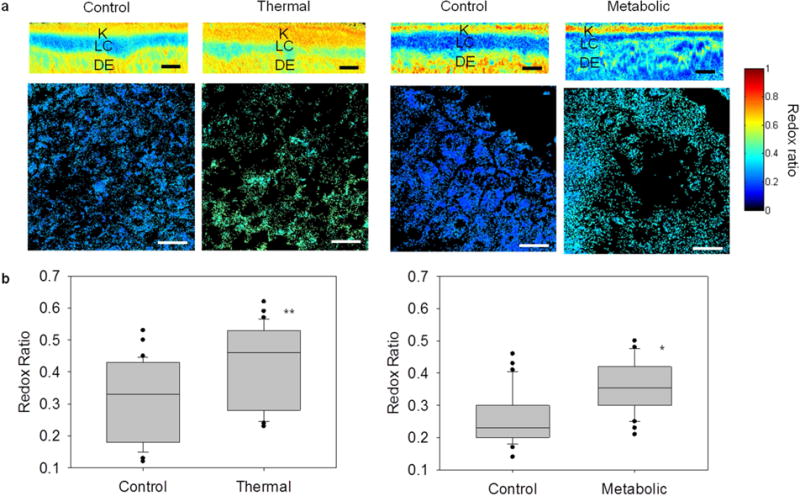
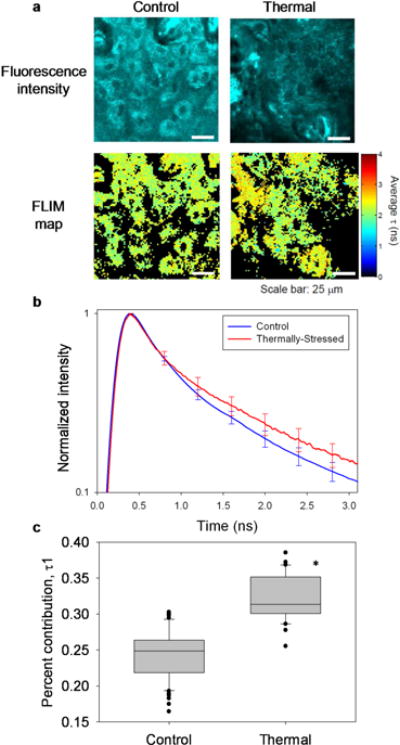
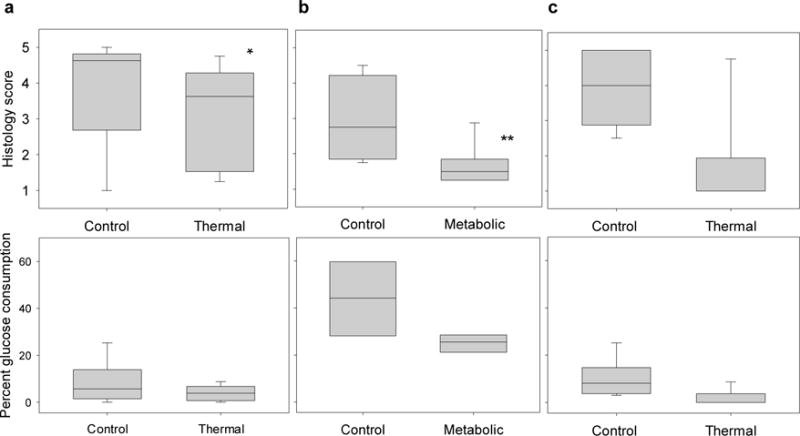
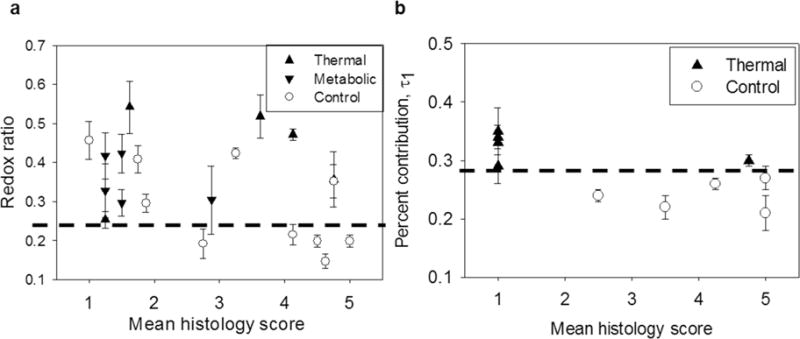
Nonlinear optical molecular imaging and quantitative analytic methods were developed to non-invasively assess the viability of tissue-engineered constructs manufactured from primary human cells. Label-free optical measures of local tissue structure and biochemistry characterized morphologic and functional differences between controls and stressed constructs. Rigorous statistical analysis accounted for variability between human patients. Fluorescence intensity-based spatial assessment and metabolic sensing differentiated controls from thermally-stressed and from metabolically-stressed constructs. Fluorescence lifetime-based sensing differentiated controls from thermally-stressed constructs. Unlike traditional histological (found to be generally reliable, but destructive) and biochemical (non-invasive, but found to be unreliable) tissue analyses, label-free optical assessments had the advantages of being both non-invasive and reliable. Thus, such optical measures could serve as reliable manufacturing release criteria for cell-based tissue-engineered constructs prior to human implantation, thereby addressing a critical regulatory need in regenerative medicine.

Keywords: Fluorescence lifetime imaging microscopy (FLIM); Label-free optical molecular imaging; Multiphoton excitation microscopy; Second-harmonic generation (SHG) imaging; Tissue engineering; Tissue viability.


Conflict of interest statement

Competing financial interests

The authors declare competing financial interests: details are available in the online version of the paper.

Figures

Figure 1
Figure 1
Label-free nonlinear optical molecular imaging non-invasively interrogated a living EVPOME construct in three dimensions, measuring cross-sectional (middle) and en-face (right) images. EVPOME’s layered structure is evident in the histology (left) and in the cross-sectional image (middle) of cellular autofluorescence (NAD(P)H, cyan) with overlaid scaffold SHG (collagen, blue). EVPOMEs were composed of (1) a stratified cellular layer with > 3 cellular layers, including proliferative basal cells and differentiating cells, (2) attachment of basal cells to the dermal equivalent, and (3) a well-defined keratin layer. These three criteria were employed later for histological evaluation of construct viability. Fluorescence intensity, fluorescence lifetime, and SHG microscopic images were acquired to quantitatively assess EVPOME viability (right). Three-dimensional spatially-localized optical measurements interrogated cellular metabolic function and spatial organization (steady-state imaging) as well as cellular microenvironment (FLIM).
Figure 2
Figure 2
Non-invasive optical characterization of tissue structure. Cross-sectional fluorescence images of EVPOME constructs from NAD(P)H (cyan) and FAD (green) channels with overlaid corresponding SHG images (blue) were compared to sample histology. Control and thermally-stressed (left columns) and metabolically-stressed (right columns)) EVPOMEs exhibit the layered tissue structure, consisting of a top keratin layer (K) ~10–20 μm thick, a middle living cellular layer (LC) ~20–30 μm thick, and a bottom dermal equivalent layer (DE) ~400 μm thick (a portion is shown). While fluorescence images quantitatively and non-invasively characterized EVPOME’s layered structure, histology destroyed the EVPOME constructs. Scale bar: 50 μm.
Figure 3
Figure 3
Label-free optical spatial analysis characterized cellular organization in EVPOME constructs and reliably distinguished control from stressed constructs. (a) En-face, optically sectioned NAD(P)H images revealed cellular organization of the EVPOME constructs. In control constructs, differentiating cells (top) were characterized by large, loosely packed cells. Alternatively, basal layer cells (bottom) were characterized by small, closely packed cells. In thermally-stressed constructs, cell morphologies appeared disorganized in both layers. In metabolically-stressed constructs, EVPOMEs grew thin cellular layers (no distinct differentiating and basal layers). Therefore, only the basal layer image was acquired, which appeared disorganized. Scale bar: 20 μm. (b) Cellular organization was quantified by spatial analysis of optical images to extract a Hurst parameter (H). For both stressing experiments, the Hurst parameter significantly distinguished between stressed and control EVPOMEs (*n = 4 batches with 11 H value differences extracted from control and n = 3 batches with 8 from thermally-stressed, P-value = 0.004; ** n = 4 batches with 12 H values extracted from control and n = 3 batches with 10 from metabolically-stressed, P-value <0.001).
Figure 4
Figure 4
Label-free optical microscopy imaged (section thickness < 1 μm) a single layer of primary human oral keratinocytes in culture. In low-calcium (0.06 mM) medium, keratinocytes proliferated, forming a cellular monolayer. (b) In high-calcium medium (1.2 mM), keratinocytes differentiated into a layered structure, which was sectioned by nonlinear optical microscopy. Proliferating cells were spatially separated as compared to differentiating cells, which tended to crowd together. Shown in (b) and (c) are images of two layers at the same site, and the bottom layer is 9 μm deeper than the top. Both proliferating and differentiating keratinocytes exhibit high NAD(P)H fluorescence but low FAD fluorescence, resulting in a low RR (noted as blue pixels in the RR maps). In particular, proliferating keratinocytes in (a) have low perinuclear RR because highly metabolic mitochondria gathered around the nuclei, shown as the dark blue rings in the binary RR map. Differentiating keratinocytes in (c), on the other hand, homogeneously exhibit dark blue pixels over the binary RR map. In addition, as keratinocytes differentiated upwards, some cells had slightly higher average RR seen as the appearance of light blue pixels in the differentiating layer RR map, indicating their decreasing metabolic activity. Scale bar: 20 μm. Note: For display, contrast enhancement on half of the dim panels was performed by setting image minimum at 10 and maximum at 100 in a scale of 0–255.
Figure 5
Figure 5
Label-free optical redox ratio mapping characterized cellular metabolism in EVPOME constructs and reliably distinguished control from stressed constructs. (a) The top row shows cross-sectional EVPOME redox ratio maps; the bottom row shows en-face EVPOME redox ratio maps. Control constructs had a lower RR (deeper blue) than stressed constructs, indicative of viable and actively metabolizing cells. (K: keratin; LC: living cellular; DE: dermal equivalent) Scale bar: 25 um. (b) An average RR for each image was extracted to quantify cellular viability of thermally-stressed (left) and metabolically-stressed (right) EVPOMEs. Control EVPOMEs had significantly lower RR than stressed EVPOMEs in both experiments. (n = 5 batches with 30 control and 30 thermally-stressed images analyzed, *P-value = 0.004; ** P-value <0.001).
Figure 6
Figure 6
Label-free fluorescence lifetime analysis successfully distinguished control from thermally-stressed EVPOMEs. (a) Representative en-face, optically sectioned NAD(P)H fluorescence intensity images and corresponding FLIM maps for an analyzed region-of-interest in control (left) and thermally-stressed (right) EVPOMEs. Larger mean fluorescence lifetime t was observed in FLIM maps of thermally-stressed constructs relative to controls. (b) Mean of normalized fluorescence decays from regions-of-interest support the observation from FLIM maps that thermally-stressed constructs exhibited greater mean NAD(P)H fluorescence lifetimes than controls. Error bars represent s.e.m. (c) NAD(P)H fluorescence decays measured from constructs were best fit to a two-exponential decay model. Model fits revealed that the percent contribution of τ1 (attributed to bound NAD(P)H) to the measured fluorescence decay was significantly higher in thermally-stressed EVPOMEs than in controls (n = 5 batches with 58 control and 33 thermally-stressed regions analyzed, P-value < 0.001).
Figure 7
Figure 7
Histology scores assigned by a panel of blinded expert readers and percent glucose consumption measures did not reliably distinguish control and compromised EVPOMEs. Histology scores (with higher scores indicating greater perceived viability; 5 being the most viable) and glucose readings (percent error = 15%) compare control constructs to (a) thermally-stressed and (b) metabolically-stressed EVPOMEs prepared for the fluorescence intensity experiment, and (c) thermally-stressed EVPOMEs prepared for the fluorescence lifetime experiment Histology scores distinguished stressed from control EVPOMEs in some experiments (n = 5 batches, *(a) P-value = 0.002; **(b) P-value < 0.001; (c) P-value = 0.03), but histology is a destructive method for tissue assessment. Percent glucose consumption measures did not distinguish stressed from control constructs in any experiment ((a) n = 5 batches, P-value = 0.1; (b) n = 4 batches, P-value = 0.03; (c) n = 5 batches, P-value = 0.04). Note: The percent glucose consumption measures from the metabolic-stress experiment were larger than those from the thermal-stress experiment because the metabolic-stress culture dishes were smaller, as detailed in Methods.
Figure 8
Figure 8
Non-invasive optical metrics obtained from label-free (a) RR and (b) fluorescence lifetime (FLIM) images reliably identified all experimentally stressed tissue constructs, whereas histology scores assigned by a panel of blinded expert readers could not. (a) Mean redox ratio was compared to mean panel histology score for control (n = 10 batches), thermally-stressed (n = 5 batches), and metabolically-stressed (n = 5 batches) EVPOME constructs. An RR threshold (dashed black line) distinguished all 10 experimentally stressed constructs from 5 of the most viable (highest histology score) control constructs. A comparable histology score threshold capable of distinguishing stressed from control constructs was impossible to define. We note that 3 control constructs with poor mean histology score (< 2) were also identified by the optical RR threshold. Therefore, excluding these 3 poorly growing EVPOMEs, the non-invasive optical RR metric successfully identified 5 out of 7 remaining control from all 10 stressed constructs. (b) FLIM analysis was compared to mean panel histology score for control (n = 5 batches) and thermally-stressed (n = 5 batches) EVPOME constructs. A FLIM threshold (dashed black line) distinguished all 5 stressed constructs from the 5 controls. Error bars represent standard deviation of all measurements from one EVPOME. The histology score > 3 in pre-implant assessment of constructs reliably predicted in vivo graft success after 1 week, shown in concurrent studies.

Similar articles

Cited by

References

    1. Izumi K, Song J, Feinberg SE. Development of a tissue-engineered human oral mucosa: from the bench to the bed side. Cells Tissues Organs. 2004;176:134–152. - PubMed
    1. Hellman KB. Tissue engineering: translating science to product. Ashammakhi N, Reis R, Chiellini F, editors. Topics in Tissue Engineering. E-book. 2008:1–28. Available from URL: http://www.oulu.fi/spareparts/ebook_topics_in_t_e_vol4/
    1. Haycock JW. 3D cell culture: a review of current approaches and techniques. Methods Mol Biol. 2011;695:1–15. - PubMed
    1. Vander Heiden MG, Cantley LC, Thompson CB. Understanding the Warburg effect: the metabolic requirements of cell proliferation. Science. 2009;324:1029–33. - PMC - PubMed
    1. Pitts J, Sloboda R, Dragnev K, Dmitrovsky E, Mycek M-A. Autofluorescence characteristics of immortalized and carcinogen-transformed human bronchial epithelial cells. J Biomed Opt. 2001;6:31–40. - PubMed

Publication types

LinkOut - more resources