

Comparison of the Hypoxia PET Tracer (18)F-EF5 to Immunohistochemical Marker EF5 in 3 Different Human Tumor Xenograft Models
- PMID: 24854792
- PMCID: PMC4241176
- DOI: 10.2967/jnumed.114.137448
Comparison of the Hypoxia PET Tracer (18)F-EF5 to Immunohistochemical Marker EF5 in 3 Different Human Tumor Xenograft Models
Abstract
The availability of (18)F-labeled and unlabeled 2-(2-nitro-1H-imidazol-1-yl)-N-(2,2,3,3,3-pentafluoropropyl)-acetamide (EF5) allows for a comparative assessment of tumor hypoxia by PET and immunohistochemistry; however, the combined use of these 2 approaches has not been fully assessed in vivo. The aim of this study was to evaluate (18)F-EF5 tumor uptake versus EF5 binding and hypoxia as determined from immunohistochemistry at both macroscopic and microregional levels.
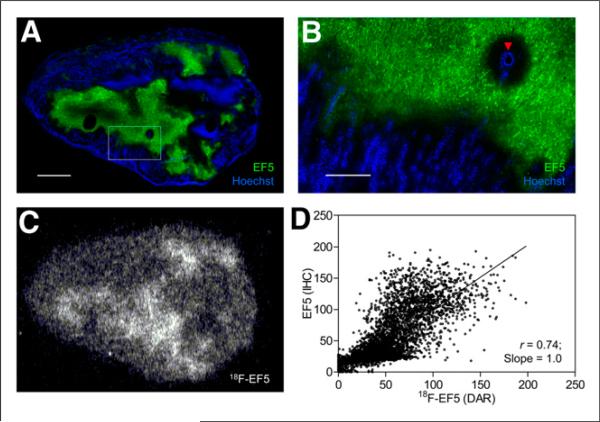
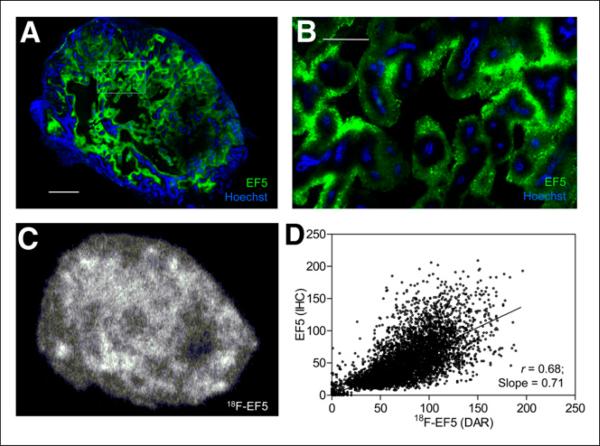
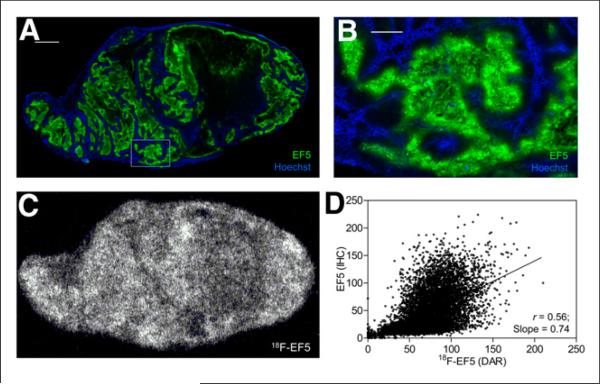
Methods: Three tumor models-PC3, HCT116, and H460-were evaluated. Tumor-bearing animals were coinjected with (18)F-EF5 and EF5 (30 mg/kg), and PET imaging was performed at 2.5 h after injection. After PET imaging and 2 min after Hoechst 33342 injection, the tumors were excised and evaluated for (18)F-EF5 distribution by autoradiography and EF5 binding by immunohistochemistry. Additionally, the effects of nonradioactive EF5 (30 mg/kg) on the hypoxia-imaging characteristics of (18)F-EF5 were evaluated by comparing the PET data for H460 tumors with those from animals injected with (18)F-EF5 alone.
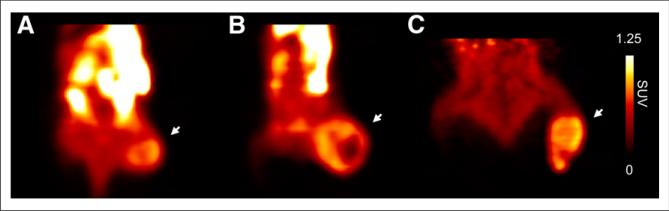
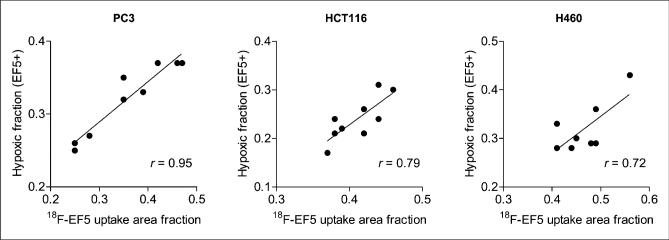
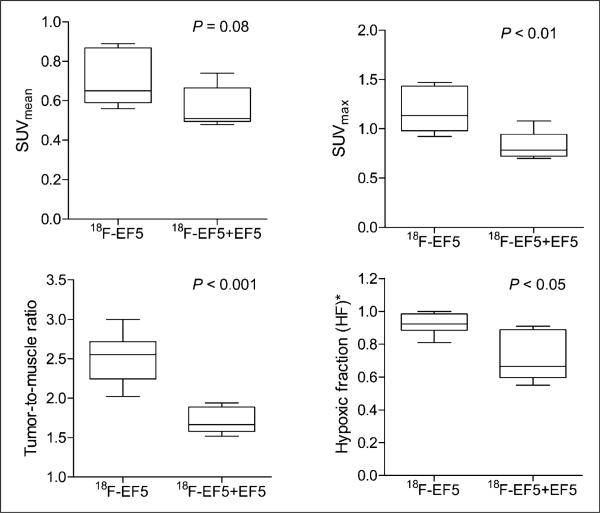
Results: The uptake of (18)F-EF5 in hypoxic tumor regions and the spatial relationship between (18)F-EF5 uptake and EF5 binding varied among tumors. H460 tumors showed higher tumor-to-muscle contrast in PET imaging; however, the distribution and uptake of the tracer was less specific for hypoxia in H460 than in HCT116 and PC3 tumors. Correlation analyses revealed that the highest spatial correlation between (18)F-EF5 uptake and EF5 binding was in PC3 tumors (r = 0.73 ± 0.02) followed by HCT116 (r = 0.60 ± 0.06) and H460 (r = 0.53 ± 0.10). Uptake and binding of (18)F-EF5 and EF5 correlated negatively with Hoechst 33342 perfusion marker distribution in the 3 tumor models. Image contrast and heterogeneous uptake of (18)F-EF5 in H460 tumors was significantly higher when the radiotracer was used alone versus in combination with unlabeled EF5 (tumor-to-muscle ratio of 2.51 ± 0.33 vs. 1.71 ± 0.17, P < 0.001).
Conclusion: The uptake and hypoxia selectivity of (18)F-EF5 varied among tumor models when animals also received nonradioactive EF5. Combined use of radioactive and nonradioactive EF5 for independent assessment of tumor hypoxia by PET and immunohistochemistry methods is promising; however, the EF5 drug concentrations that are required for immunohistochemistry assays may affect the uptake of (18)F-EF5 in hypoxic cells in certain tumor types as observed in H460 in this study.
Keywords: 18F-EF5; EF5; PET; hypoxia; tumor.
© 2014 by the Society of Nuclear Medicine and Molecular Imaging, Inc.
Figures
Comment in
-
Reply: Pharmacokinetic and Pharmacodynamic Modifiers of EF5 Uptake and Binding.J Nucl Med. 2015 Apr;56(4):653-4. doi: 10.2967/jnumed.115.154054. Epub 2015 Mar 5. J Nucl Med. 2015. PMID: 25745087 No abstract available.
-
Pharmacokinetic and pharmacodynamic modifiers of EF5 uptake and binding.J Nucl Med. 2015 Apr;56(4):653. doi: 10.2967/jnumed.114.151662. Epub 2015 Mar 5. J Nucl Med. 2015. PMID: 25745093 No abstract available.
References
-
- Vaupel P, Schlenger K, Knoop C, Hockel M. Oxygenation of human tumors: evaluation of tissue oxygen distribution in breast cancers by computerized O2 tension measurements. Cancer Res. 1991;51:3316–3322. - PubMed
-
- Brizel DM, Sibley GS, Prosnitz LR, Scher RL, Dewhirst MW. Tumor hypoxia adversely affects the prognosis of carcinoma of the head and neck. Int J Radiat Oncol Biol Phys. 1997;38:285–289. - PubMed
-
- Milosevic M, Warde P, Menard C, et al. Tumor hypoxia predicts biochemical failure following radiotherapy for clinically localized prostate cancer. Clin Cancer Res. 2012;18:2108–2114. - PubMed
-
- Trédan O, Galmarini CM, Patel K, Tannock IF. Drug resistance and the solid tumor microenvironment. J Natl Cancer Inst. 2007;99:1441–1454. - PubMed
Publication types
MeSH terms
Substances
Grants and funding
LinkOut - more resources
Full Text Sources
Other Literature Sources