. 2015 Sep;25(9):2951-9.
doi: 10.1093/cercor/bhu091. Epub 2014 May 22.

Stimulus Dependence of Gamma Oscillations in Human Visual Cortex

Affiliations

Stimulus Dependence of Gamma Oscillations in Human Visual Cortex

D Hermes et al. Cereb Cortex. 2015 Sep.

Abstract

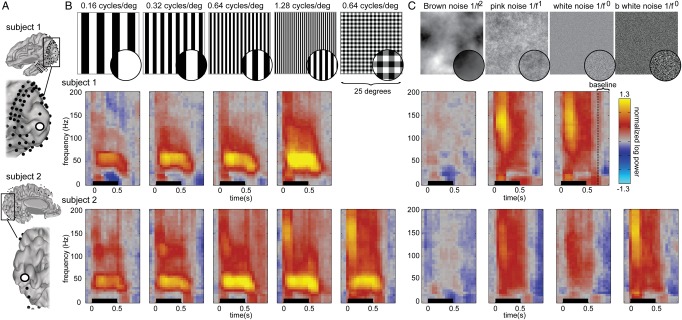
A striking feature of some field potential recordings in visual cortex is a rhythmic oscillation within the gamma band (30-80 Hz). These oscillations have been proposed to underlie computations in perception, attention, and information transmission. Recent studies of cortical field potentials, including human electrocorticography (ECoG), have emphasized another signal within the gamma band, a nonoscillatory, broadband signal, spanning 80-200 Hz. It remains unclear under what conditions gamma oscillations are elicited in visual cortex, whether they are necessary and ubiquitous in visual encoding, and what relationship they have to nonoscillatory, broadband field potentials. We demonstrate that ECoG responses in human visual cortex (V1/V2/V3) can include robust narrowband gamma oscillations, and that these oscillations are reliably elicited by some spatial contrast patterns (luminance gratings) but not by others (noise patterns and many natural images). The gamma oscillations can be conspicuous and robust, but because they are absent for many stimuli, which observers can see and recognize, the oscillations are not necessary for seeing. In contrast, all visual stimuli induced broadband spectral changes in ECoG responses. Asynchronous neural signals in visual cortex, reflected in the broadband ECoG response, can support transmission of information for perception and recognition in the absence of pronounced gamma oscillations.

Keywords: broadband spectral change; electrocorticography; gamma oscillations; human electrophysiology; visual cortex.


Figures

Figure 1.
Figure 1.
Time–frequency power estimates in V1/V2 for gratings and noise stimuli. (A) ECoG electrode locations in Subjects 1 and 2. (B) Grating stimuli were presented for 500 ms, insets in circles show a magnified portion of the stimuli for visibility. Time–frequency power estimates (“spectrograms”) from an electrode in V1/V2 from Subject 1 (top row) and Subject 2 (bottom row). (C) Noise patterns were presented for 500 ms. Spectrograms from the same early visual electrode in Subject 1 (top row) and Subject 2 (bottom row). All spectrograms are normalized with respect to the same baseline: the inter-stimulus interval between all trials (from 750–1000 ms after stimulus onset). Spectrograms are cut off at a maximum of ±1.3 log10 units. The multitaper approach results in a temporal smoothing of 200 ms and a frequency smoothing of ±15 Hz. Spectrograms represent averages across all trials of a given type.
Figure 2.
Figure 2.
Power spectra in V1/V2 for gratings and noise stimuli. Power spectra to the grating stimuli for the same electrodes shown in Figure 1 on a log–log plot (top, Subject 1; bottom, Subject 2). The black line shows the power spectrum from the grating stimuli (A) and noise stimuli (B). The dashed line shows the power spectrum from the baseline periods. A line plus Gaussian (model) was fitted to the average power spectra of each condition (data) in log–log space, resulting in one weight for broadband and one weight for narrowband increases relative to baseline. The fit from this model is plotted in gray.
Figure 3.
Figure 3.
Spatial distribution of narrowband (gamma) and broadband weights. (A) Spectral power changes during visual stimulation compared with baseline were separated in increases in narrowband gamma rhythms and broadband increases by fitting a power law shape with a Gaussian. (B) Spatial distribution of narrowband gamma (top) and broadband weights (bottom) in Subject 1 during grating stimuli. (C) Spatial distribution of narrowband gamma (top) and broadband weights (bottom) in Subject 1 during noise stimuli. Electrodes that showed a significant increase compared with baseline are plotted in color on the rendered brain surface (P < 0.05 uncorrected). (D) ECoG electrodes labeled by visual field mapping experiment (Winawer et al. 2013). CalS = calcarine sulcus, PHG = parahippocampal gyrus, CoS = collateral sulcus, FG = fusiform gyrus, and OTS = occipital-temporal sulcus.
Figure 4.
Figure 4.
Spectral power changes during face and house viewing. (A) Examples of face and house stimuli presented during experiment 2. (B) Spectrograms from an early visual electrode in Subject 1 (Fig. 1A) while seeing faces (left) and houses (right). (C) Spatial distribution of significant increases in narrowband and broadband weights (P < 0.05 uncorrected). Early visual areas show little or no narrowband gamma increases while viewing faces (top left) and houses (top right), but large increases in broadband power (bottom). The fusiform gyrus and parahippocampal gyrus show significant broadband increases, but no gamma increases, while viewing faces and houses, respectively.
Figure 5.
Figure 5.
Narrowband (gamma) and broadband power in individual trials. (A) Increases in narrowband gamma (top row) and broadband (bottom row) in a V1/V2 electrode in Subject 1 during all individual trials of Experiment 1. Horizontal bars indicate the median (solid) and quartiles (dotted) for each condition. (B) The same for Experiment 2. This electrode shows increased gamma oscillations for only some face and house stimuli, it shows a broadband increase for almost all stimuli.
Figure 6.
Figure 6.
Two example stimuli that induced different levels of narrowband gamma power in V1. (A) Power spectra from a foveal V1 electrode for 2 example stimuli (from a set of 72 stimuli, see Supplementary Fig. S3) that were shown to a separate subject in a prior study (Parvizi et al. 2012). Each stimulus was shown 6 times in random order. The 95% confidence intervals are shown in black and the baseline periods are shown in light gray. The baseline is identical for all images. The model fits (power law plus Gaussian) are plotted as a dark gray line. (B) The 2 images with the population receptive field (pRF) from the measured electrode indicated by a white circle (2 SD of the pRF Gaussian). The pRF models were obtained from a prior study (Winawer et al. 2013). The car image on the left elicited only a broadband response but no clear gamma oscillation. The car image on the right elicited both a broadband response and a large gamma oscillation.

Comment in

  • Gamma Oscillations in a Bind?
    Mazaheri A, Van Diepen R. Mazaheri A, et al. Cereb Cortex. 2015 Dec;25(12):4651-2. doi: 10.1093/cercor/bhu136. Epub 2014 Jul 1. Cereb Cortex. 2015. PMID: 25405937 No abstract available.

Similar articles

Cited by

References

    1. Aguirre GK, Zarahn E, D'Esposito M. 1998. An area within human ventral cortex sensitive to "building" stimuli: evidence and implications. Neuron. 21:373–383. - PubMed
    1. Allison T, Ginter H, McCarthy G, Nobre AC, Puce A, Luby M, Spencer DD. 1994. Face recognition in human extrastriate cortex. J Neurophysiol. 71:821–825. - PubMed
    1. Bartolo MJ, Gieselmann MA, Vuksanovic V, Hunter D, Sun L, Chen X, Delicato LS, Thiele A. 2011. Stimulus-induced dissociation of neuronal firing rates and local field potential gamma power and its relationship to the resonance blood oxygen level-dependent signal in macaque primary visual cortex. Eur J Neurosci. 34:1857–1870. - PMC - PubMed
    1. Bauer R, Brosch M, Eckhorn R. 1995. Different rules of spatial summation from beyond the receptive field for spike rates and oscillation amplitudes in cat visual cortex. Brain Res. 669:291–297. - PubMed
    1. Bosman CA, Schoffelen JM, Brunet N, Oostenveld R, Bastos AM, Womelsdorf T, Rubehn B, Stieglitz T, De Weerd P, Fries P. 2012. Attentional stimulus selection through selective synchronization between monkey visual areas. Neuron. 75:875–888. - PMC - PubMed

Publication types