. 2014 May 22;4(7):1307-18.
doi: 10.1534/g3.114.011551.

A roadmap for functional structural variants in the soybean genome

Affiliations

A roadmap for functional structural variants in the soybean genome

Justin E Anderson et al. G3 (Bethesda). .

Abstract

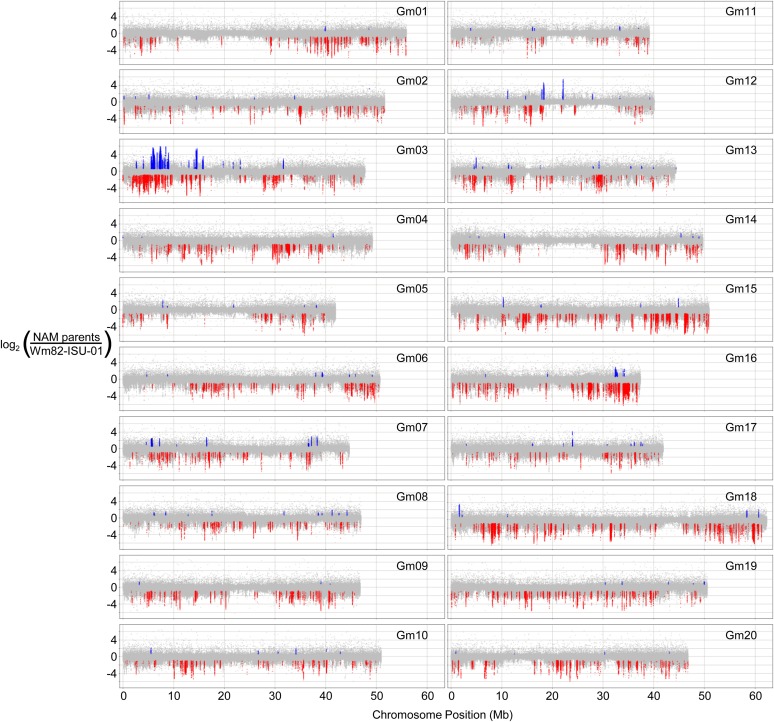
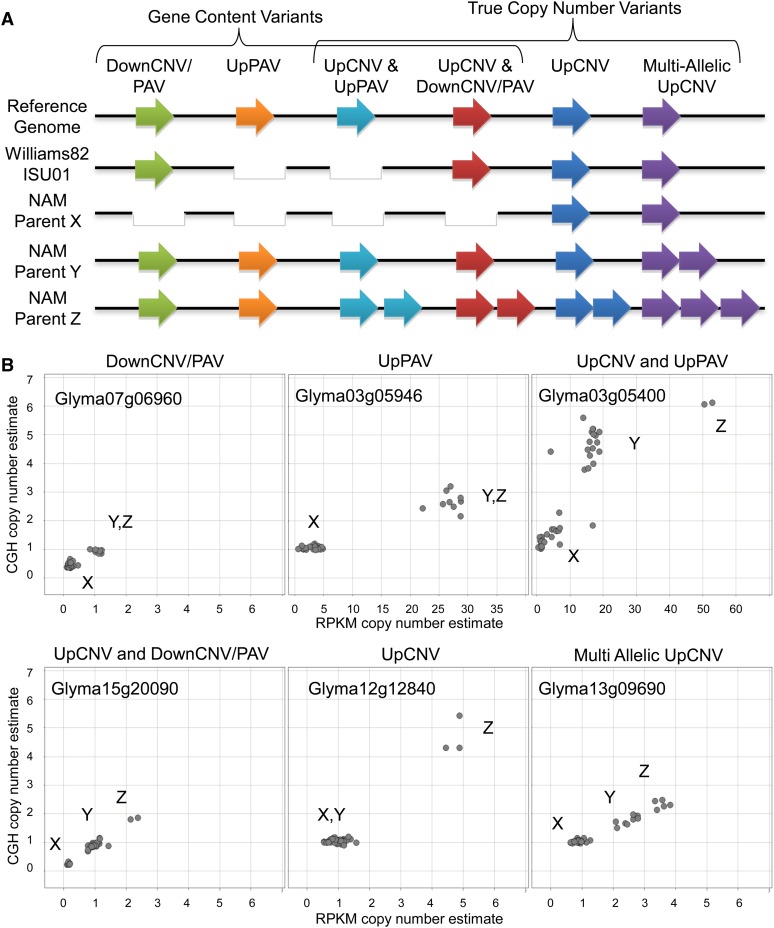
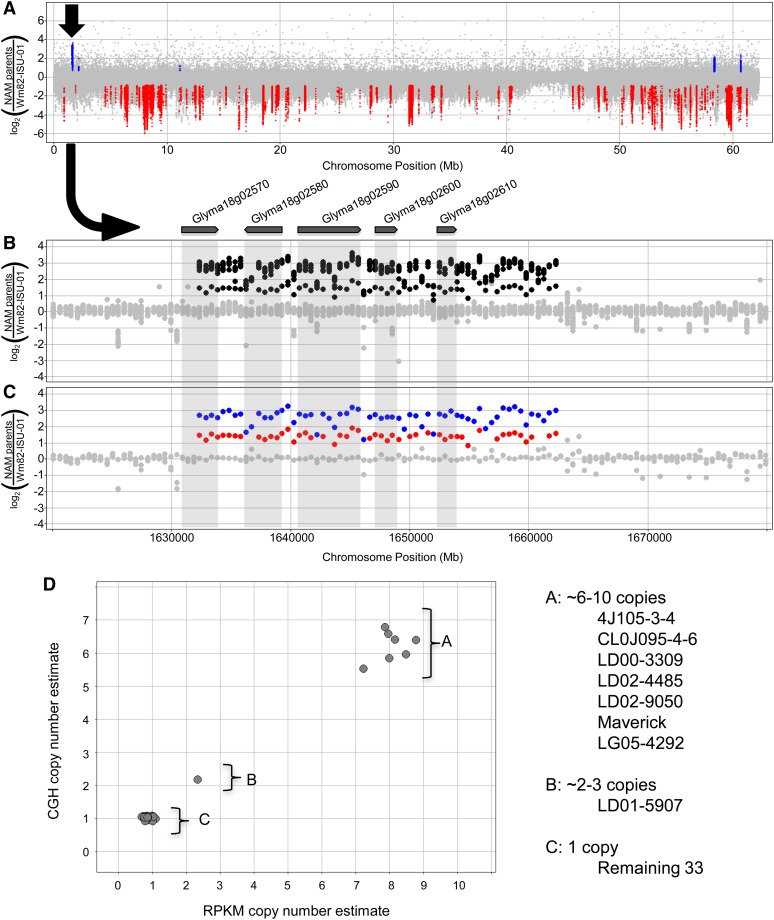
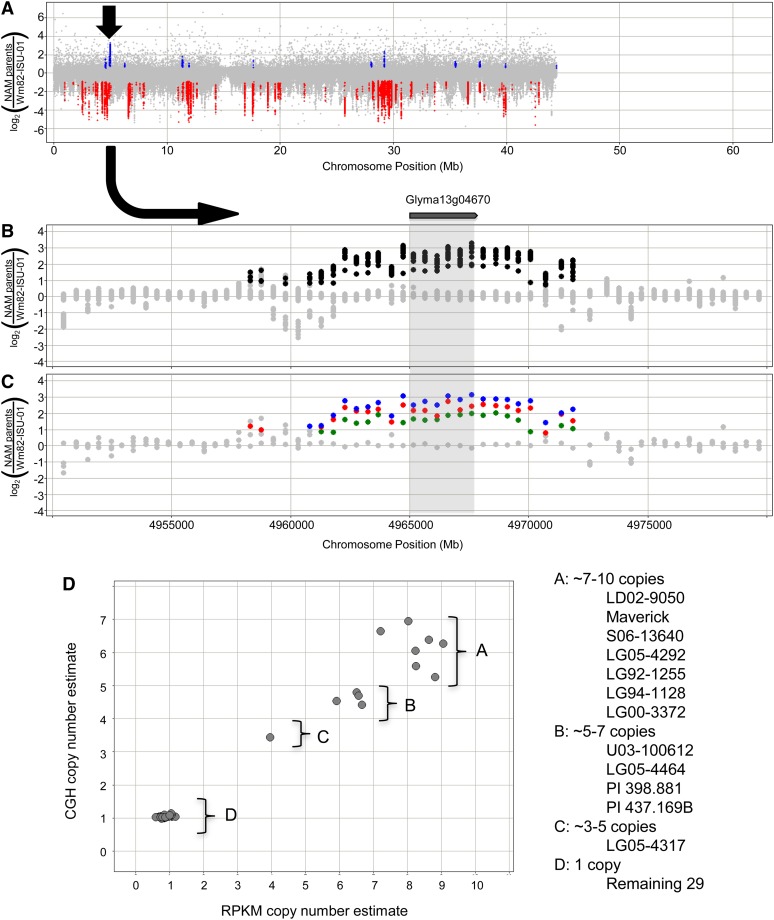
Gene structural variation (SV) has recently emerged as a key genetic mechanism underlying several important phenotypic traits in crop species. We screened a panel of 41 soybean (Glycine max) accessions serving as parents in a soybean nested association mapping population for deletions and duplications in more than 53,000 gene models. Array hybridization and whole genome resequencing methods were used as complementary technologies to identify SV in 1528 genes, or approximately 2.8%, of the soybean gene models. Although SV occurs throughout the genome, SV enrichment was noted in families of biotic defense response genes. Among accessions, SV was nearly eightfold less frequent for gene models that have retained paralogs since the last whole genome duplication event, compared with genes that have not retained paralogs. Increases in gene copy number, similar to that described at the Rhg1 resistance locus, account for approximately one-fourth of the genic SV events. This assessment of soybean SV occurrence presents a target list of genes potentially responsible for rapidly evolving and/or adaptive traits.

Keywords: CNV; Glycine max; nested association mapping; soybean; structural variation.


Figures

Figure 1
Figure 1
Genome-wide view of copy number variation found in the soybean NAM parents. Data points are the log2 ratio of each genotype vs. the Williams82-ISU-01 reference for each probe. Colored spots denote probes within segments that exceed threshold: blue for UpCNV and red for DownCNV.
Figure 2
Figure 2
Classification system for CNVs that were associated with gene models. (A) Presence–absence and copy number status for a hypothetical gene in each of the six classes. Genes are found in one of three states: single copy, absent (white gap), or multiple copies (two or more arrows). (B) Gene representatives for each of the six classes showing allelic clusters. Each gene shows one data point for each of the 41 genotypes. The estimated copy number from sequence depth and CGH are shown on the X and Y axes, respectively.
Figure 3
Figure 3
Copy number variation at the soybean cyst nematode locus Rhg1. (A) The copy number variant (arrow) is clearly visible from a full view of the chromosome 18 CGH results, overlaying data from all 41 genotypes. (B) The view from (A) is zoomed-in on the 31-kb UpCNV segment that overlaps five gene models (Cook et al. 2012). (C) Viewing only one genotype from each allele class confirms a clear separation between three different copy number states. (D) Cross-validation of the CNV for Glyma18g02590 using both CGH (y-axis) and sequence depth (x-axis) analyses.
Figure 4
Figure 4
Copy number variation at Glyma13g04670. (A) The copy number variant (arrow) is visible from a full view of the chromosome 13 CGH results, overlaying data from all 41 genotypes. (B) The view from (A) is zoomed in on the approximately 10-kb UpCNV segment that overlaps with Glyma13g04670, revealing multiple CNV classes. (C) Viewing one genotype from each predicted class confirms distinct copy number states. (D) Cross-validation of the CNV for Glyma13g04670 using both CGH (y-axis) and sequence depth (x-axis) analyses, revealing at least four copy number classes.

References

    1. Bernard R., Cremeens C., 1988. Registration of ‘Williams 82’soybean. Crop Sci. 28: 1027–1028.
    1. Berriz G. F., Beaver J. E., Cenik C., Tasan M., Roth F. P., 2009. Next generation software for functional trend analysis. Bioinformatics 25: 3043–3044. - PMC - PubMed
    1. Birchler J. A., Veitia R. A., 2012. Gene balance hypothesis: Connecting issues of dosage sensitivity across biological disciplines. Proc. Natl. Acad. Sci. USA 109: 14746–14753. - PMC - PubMed
    1. Cao J., Schneeberger K., Ossowski S., Günther T., Bender S., et al. , 2011. Whole-genome sequencing of multiple Arabidopsis thaliana populations. Nat. Genet. 43: 956–963. - PubMed
    1. Chambers A. H., Pillet J., Plotto A., Bai J., Whitaker V. M., et al. , 2014. Identification of a strawberry flavor gene candidate using an integrated genetic-genomic-analytical chemistry approach. BMC Genomics 15: 217. - PMC - PubMed

Publication types