. 2014 Jul 18;289(29):19894-906.
doi: 10.1074/jbc.M114.570739. Epub 2014 May 22.

Novel isoforms of heat shock transcription factor 1, HSF1γα and HSF1γβ, regulate chaperone protein gene transcription

Affiliations

Novel isoforms of heat shock transcription factor 1, HSF1γα and HSF1γβ, regulate chaperone protein gene transcription

Andreas Neueder et al. J Biol Chem. .

Abstract

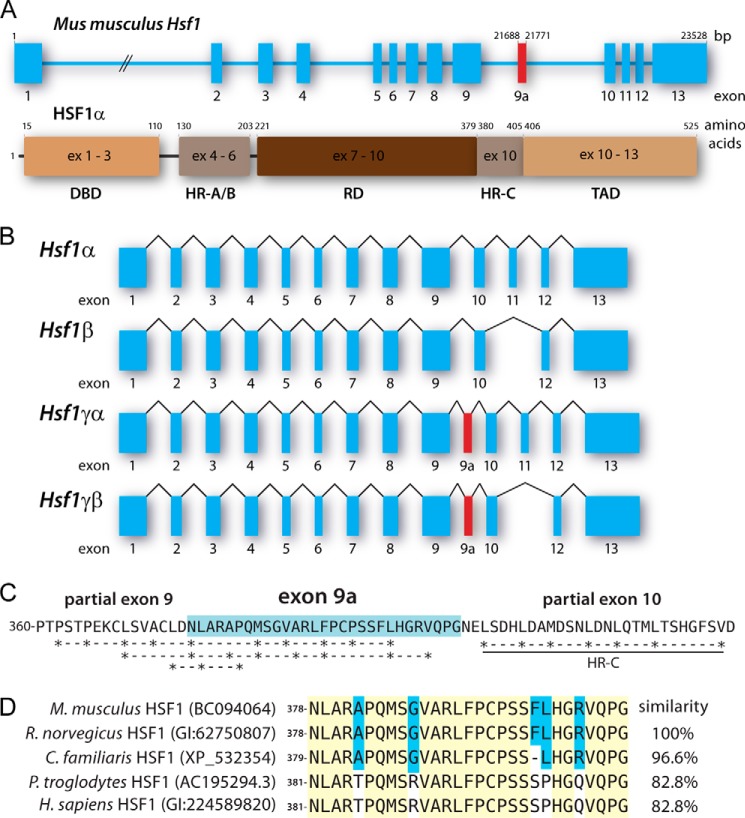
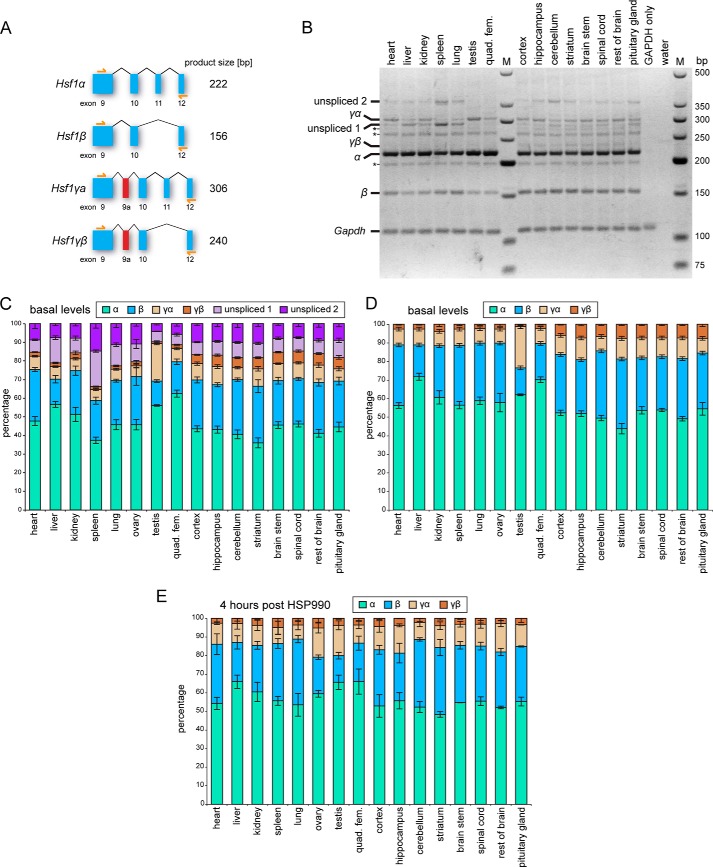
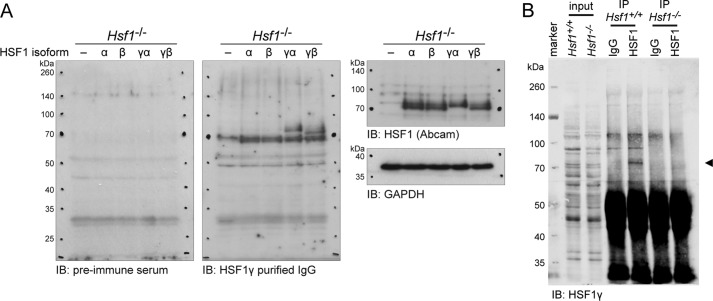
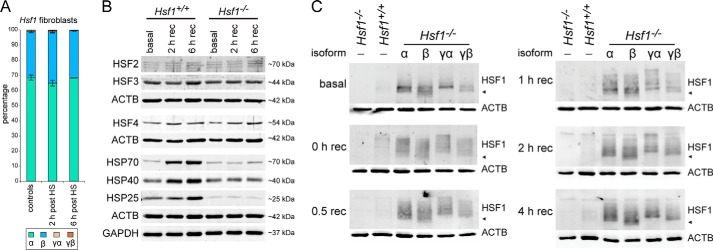
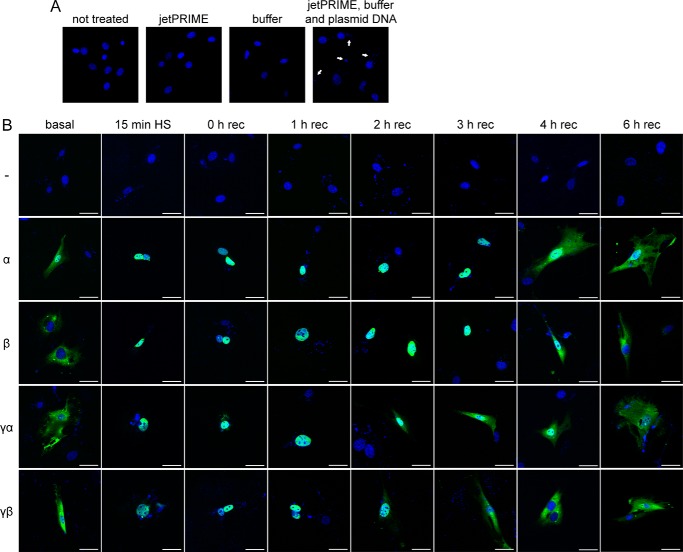
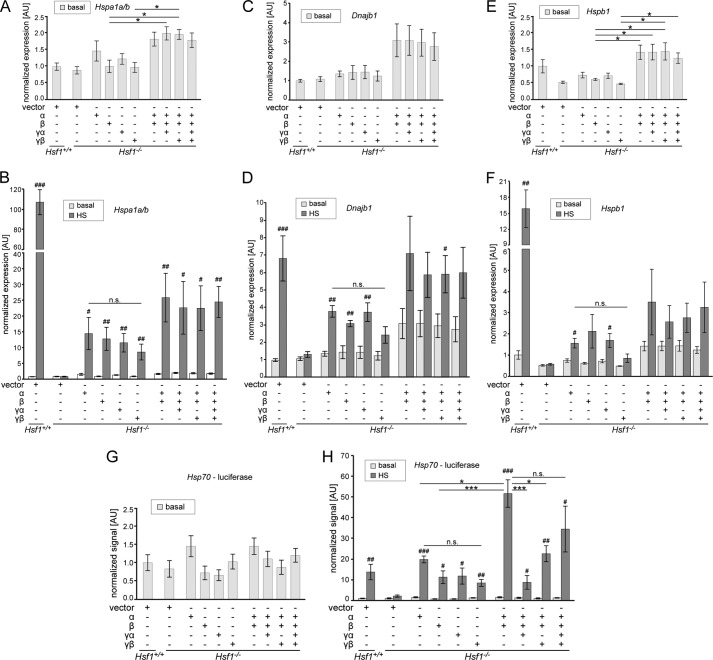
The heat shock response, resulting in the production of heat shock proteins or molecular chaperones, is triggered by elevated temperature and a variety of other stressors. Its master regulator is heat shock transcription factor 1 (HSF1). Heat shock factors generally exist in multiple isoforms. The two known isoforms of HSF1 differ in the inclusion (HSF1α) or exclusion (HSF1β) of exon 11. Although there are some data concerning the differential expression patterns and transcriptional activities of HSF2 isoforms during development, little is known about the distinct properties of the HSF1 isoforms. Here we present evidence for two novel HSF1 isoforms termed HSF1γα and HSF1γβ, and we show that the HSF1 isoform ratio differentially regulates heat shock protein gene transcription. Hsf1γ isoforms are expressed in various mouse tissues and are translated into protein. Furthermore, after heat shock, HSF1γ isoforms are exported from the nucleus more rapidly or degraded more quickly than HSF1α or HSF1β. We also show that each individual HSF1 isoform is sufficient to induce the heat shock response and that expression of combinations of HSF1 isoforms, in particular HSF1α and HSF1β, results in a synergistic enhancement of the transcriptional response. In addition, HSF1γ isoforms potentially suppress the synergistic effect of HSF1α and HSF1β co-expression. Collectively, our observations suggest that the expression of HSF1 isoforms in a specific ratio provides an additional layer in the regulation of heat shock protein gene transcription.

Keywords: Alternative Splicing; HSF1; Heat Shock Protein (HSP); Heat Shock Response; Heat shock Transcription Factor; Molecular Chaperone; Stress Response; Transcription Regulation.


Figures

FIGURE 1.
FIGURE 1.
A, schematic of murine Hsf1 gene and HSF1α protein structure (NCBI accession 15499). Exon (ex) 9a, highlighted in red, encodes the Hsf1 γ (HSF1γ) isoforms and is a 84-bp exon. The DNA binding domain (DBD) is encoded by exons 1–3, heptad repeats A and B (HR-A/B) are encoded by exons 4–6, the regulatory domain (RD) is encoded by exons 7–9 and the first two amino acids of exon 10, the heptad repeat C (HR-C) is encoded by exon 10, and the transcription activation domain (TAD) is encoded by the last seven amino acids of exons 10 and exons 11–13. B, the mRNA structures of all four possible Hsf1 isoforms. Exons are shown as boxes, and introns are shown as lines. Exon 11 defines the α and β isoforms, and exon 9a defines the γ isoforms. C, possible hydrophobic heptad repeats encoded by exon 9 and 9a. The additional amino acid sequence of the γ isoforms is highlighted in blue. D, the exon 9a encoded amino acid sequence is conserved in higher eukaryotes. The NCBI protein accession number is given in brackets after the species name. Amino acids highlighted in yellow are fully conserved; blue background depicts partial conservation. Murine exon 9a was used as reference, and the similarity of the other sequences was calculated accordingly. Genus abbreviations: M. musculus, Mus musculus; R. norvegicus, Rattus norvegicus; C. familiaris, Canis lupus familiaris; P. troglodytes, Pan troglodytes; H. sapiens, Homo sapiens.
FIGURE 2.
FIGURE 2.
Hsf1 isoform ratios in mouse tissue. A, schematic of the RT-PCR assay to quantify Hsf1 isoform ratio. Primers (yellow arrows) bind in exons 9 and 12 and give distinct product lengths for each isoform. B, representative image of an RT-PCR assay showing Hsf1 isoform ratios in different mouse tissues. Tissues were taken from 8-week-old (CBA × C57BL/6) F1 wild type mice. All visible bands are specific for Hsf1 sequences and were confirmed by sequencing. Asterisks mark Hsf1 isoforms that contain some retained introns, but because they show very similar levels in all tissues, were not quantified. Unspliced 1 (Hsf1α with retained intron 11, 292 bp) and unspliced 2 (Hsf1α with retained introns 10 and 11, 369 bp) represent the major immature isoforms and are quantified in C, together with Hsf1α (α), Hsf1β (β), Hsf1γα (γα), and Hsf1γβ (γβ). GAPDH was used as loading control. Marker (M) is low molecular weight marker (New England Biolabs) quad. fem. = quadriceps femoris. C, quantification of Hsf1 isoform ratios in different mouse tissues. The intensity of the GAPDH band was used to average the band intensities from different mice. The sum of the normalized band intensities of all Hsf1 isoforms for each tissue was set to 100%. The data shown are the mean intensity (n = 6; n = 3 for ovary and testis) ± S.E. D, same as in C, but the unspliced isoforms were not considered and the sum of the band intensities for the four main isoforms was set to 100%. E, same as in D, but mice were treated with 12 mg/kg HSP990 4 h before tissues were taken. Data are mean (n = 2) ± S.E.
FIGURE 3.
FIGURE 3.
The Hsf1γ isoforms are translated into protein in vivo. A, verification of the anti-HSF1γ antibody raised against the exon 9a peptide. An Hsf1 knock-out cell line (Hsf1−/−) was transfected with either vector (−) or the four HSF1 isoforms (α, β, γα, γβ). Proteins were extracted and separated by SDS-PAGE. The membrane was first incubated with HSF1γ preimmune serum. After image acquisition, the membrane was stripped and incubated with anti-HSF1γ purified IgG. Thirdly, the blot was stripped again, cut, and incubated with anti-HSF1 (Abcam), or GAPDH, respectively. IB = immunoblot detection antibody. B, IP of HSF1 from mouse testes. Testes from wild type (Hsf1+/+) and knock-out (Hsf1−/−) mice were homogenized, and HSF1 was immunoprecipitated as described under “Experimental Procedures.” Following Western blotting, the membrane was cut at about 60 kDa, but each part was incubated with identical conditions and reassembled for image acquisition. HSF1γ isoforms were detected with anti-HSF1γ purified IgG (◀) in the IP from wild type, but not from knock-out mice.
FIGURE 4.
FIGURE 4.
HSF1 isoforms are post-translationally modified. A, Hsf1 isoform ratio in wild type primary fibroblast cell lines. The experiment was performed as described in the legend for Fig. 2. Data are mean (n = 4) ± S.E. HS = heat shock. B, characterization of the established primary cell lines. Wild type (Hsf1+/+) and knock-out (Hsf1−/−) fibroblast lines were analyzed for protein expression levels of HSF2, HSF3, HSF4, HSP70 (Hspa1a/b), HSP40 (Dnajb1), and HSP25 (Hspb1). GAPDH and β-actin (ACTB) were used as loading controls. rec = recovery. C, time course of HSF1 isoform activation. Wild type and knock-out fibroblast lines were transfected with vector (−) and the knock-out line in addition to the four HSF1 isoforms (α, β, γα, γβ). Cells were kept at 37 °C (basal) or heat-shocked and recovered for the indicated time period (0–4 h rec) at 37 °C before Western blot analysis. HSF1 isoforms were detected with anti-HSF1 (Abcam). β-Actin (ACTB) was used as a loading control. ◀ indicates ∼70 kDa.
FIGURE 5.
FIGURE 5.
HSF1 isoforms show different nuclear export or degradation kinetics after heat shock. A, DAPI stain (blue) of Hsf1 knock-out cells with different transfection conditions. Cells were completely untreated (not treated panel), transfected with only the jetPRIME reagent (jetPRIME panel) or only with the buffer (buffer panel), or transfected with both together with plasmid DNA (jetPRIME, buffer and plasmid DNA panel). The white arrows indicate the appearance of DAPI-positive small puncta when DNA is transfected. B, immunofluorescence of HSF1 isoforms after heat shock (HS). Cells were either kept at 37 °C (basal panel) or heat-shocked for 45 min at 42 °C and recovered for the indicated time period (0–6 h rec) at 37 °C. The second column shows cells that were only heat-shocked for 15 min (15 min HS panel) at 42 °C and immediately fixed. Images are shown as merged color with DAPI in blue and anti-FLAG (FLAG-tagged HSF1 isoforms) in green. White bars correspond to 50 μm. rec = recovery.
FIGURE 6.
FIGURE 6.
The transcriptional activities of HSF1 isoforms. A–F, quantitative PCR analysis of HSP transcript levels in wild type (Hsf1+/+) and Hsf1 knock-out (Hsf1−/−) fibroblast lines. Cell lines were transfected with plasmids as indicated below the graphs. Quantitative PCR signals for Hspa1a/b (A and B), Dnajb1 (C and D), and Hspb1 (E and F) were normalized to the geometric mean of GAPDH and β-actin. Graphs show either the HSP transcript levels of cells that were kept constantly at 37 °C (basal) (A, C, and E) or the basal conditions as before together with the transcript levels 2 h after heat shock (HS) (45 min of heat shock, 2 h of recovery at 37 °C) (B, D, and F). The mean expression values are shown normalized to wild type levels (set to 1). Data are mean (n > 4) ± S.E. Statistics for basal versus heat shock conditions: #, p < 0.05, ##, p < 0.01, ###, p < 0.001. Statistics for comparison of isoforms for each condition: *, p < 0.05. AU = arbitrary units. G–H, Hsp70 promoter firefly luciferase assay. Cell lines were transfected with plasmids as indicated below the graphs. In addition, thymidine kinase promoter-driven Renilla luciferase was added in all conditions to normalize the obtained Hsp70 promoter firefly luciferase signals. Graphs show either the signals for cells that were kept constantly at 37 °C (G, basal) or the basal conditions as before together with the transcript levels 2 h after heat shock (45 min of heat shock, 2 h of recovery at 37 °C) (H). The mean signal values are shown normalized to the wild type signal (set to 1). Data are mean (n > 3) ± S.E. Statistics for basal versus heat shock conditions: #, p < 0.05, ##, p < 0.01, ###, p < 0.001. Statistics for comparison of isoforms for each condition: *, p < 0.05, ***, p < 0.001. n.s. = not significant.

References

    1. Fujimoto M., Nakai A. (2010) The heat shock factor family and adaptation to proteotoxic stress. FEBS J. 277, 4112–4125 - PubMed
    1. Westerheide S. D., Raynes R., Powell C., Xue B., Uversky V. N. (2012) HSF transcription factor family, heat shock response, and protein intrinsic disorder. Curr. Protein Pept. Sci. 13, 86–103 - PubMed
    1. Sarge K. D., Zimarino V., Holm K., Wu C., Morimoto R. I. (1991) Cloning and characterization of two mouse heat shock factors with distinct inducible and constitutive DNA-binding ability. Genes Dev. 5, 1902–1911 - PubMed
    1. Sistonen L., Sarge K. D., Phillips B., Abravaya K., Morimoto R. I. (1992) Activation of heat shock factor 2 during hemin-induced differentiation of human erythroleukemia cells. Mol. Cell. Biol. 12, 4104–4111 - PMC - PubMed
    1. Alastalo T. P., Hellesuo M., Sandqvist A., Hietakangas V., Kallio M., Sistonen L. (2003) Formation of nuclear stress granules involves HSF2 and coincides with the nucleolar localization of Hsp70. J. Cell Sci. 116, 3557–3570 - PubMed

Publication types

MeSH terms