. 2014 May 22;157(5):1146-59.
doi: 10.1016/j.cell.2014.03.045.

Mechanical feedback through E-cadherin promotes direction sensing during collective cell migration

Affiliations

Mechanical feedback through E-cadherin promotes direction sensing during collective cell migration

Danfeng Cai et al. Cell. .

Abstract

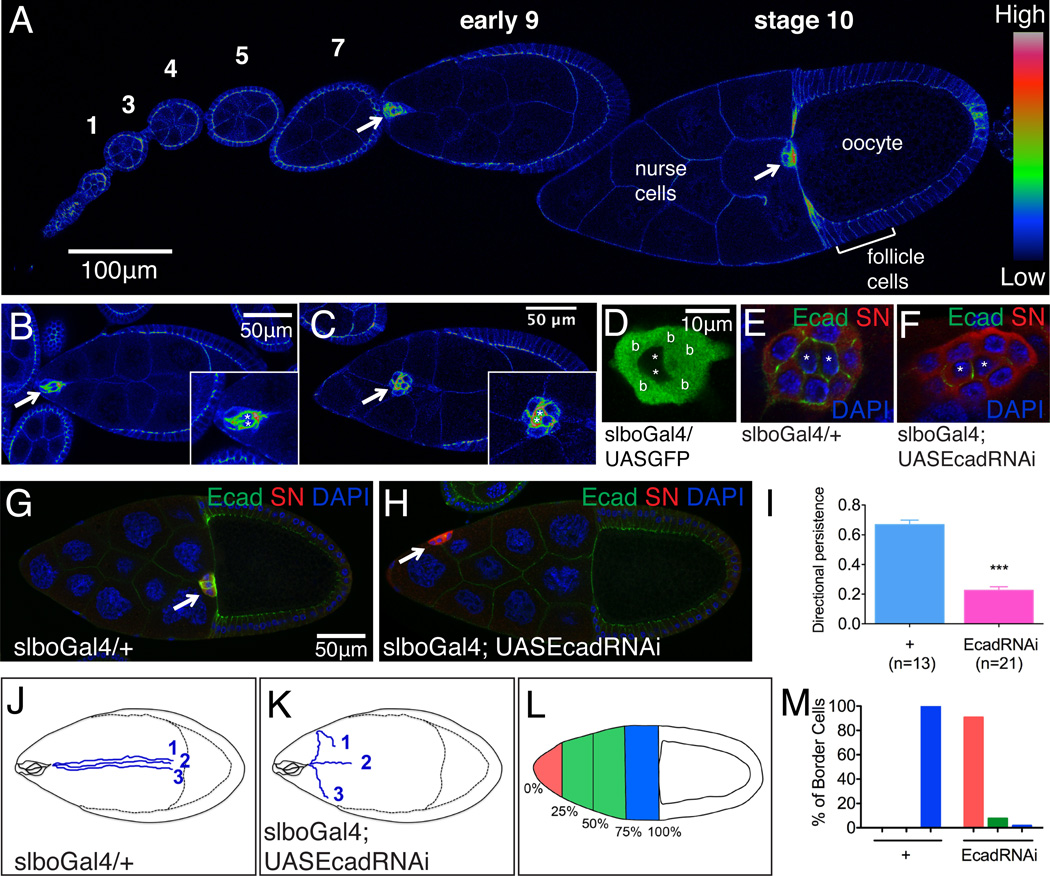
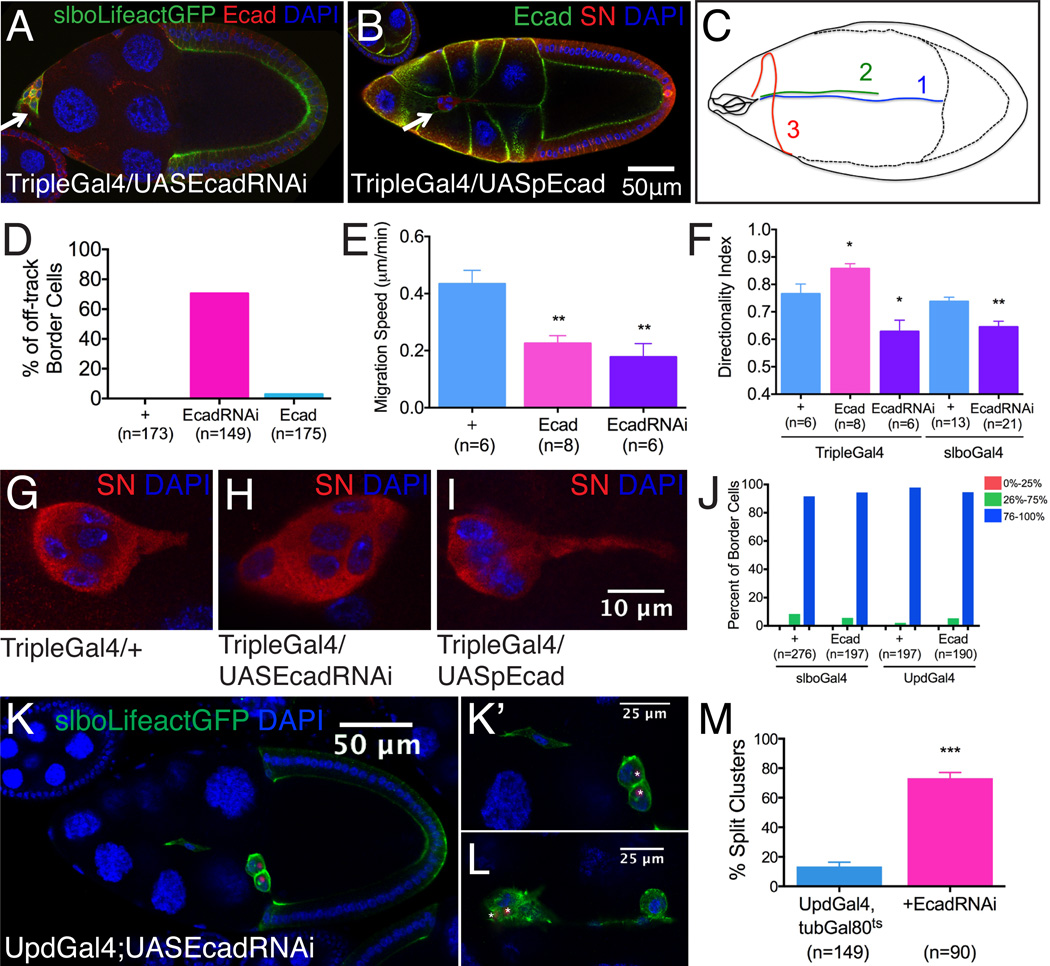
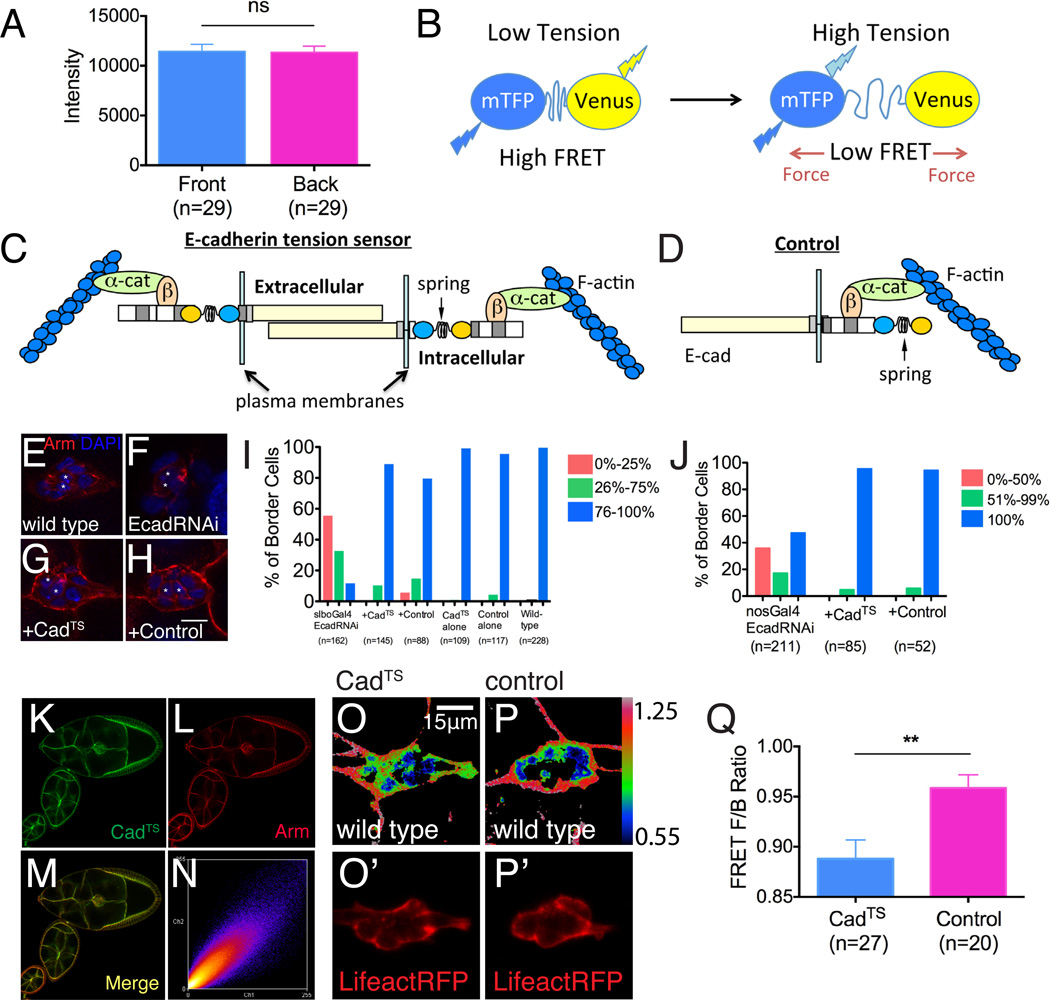
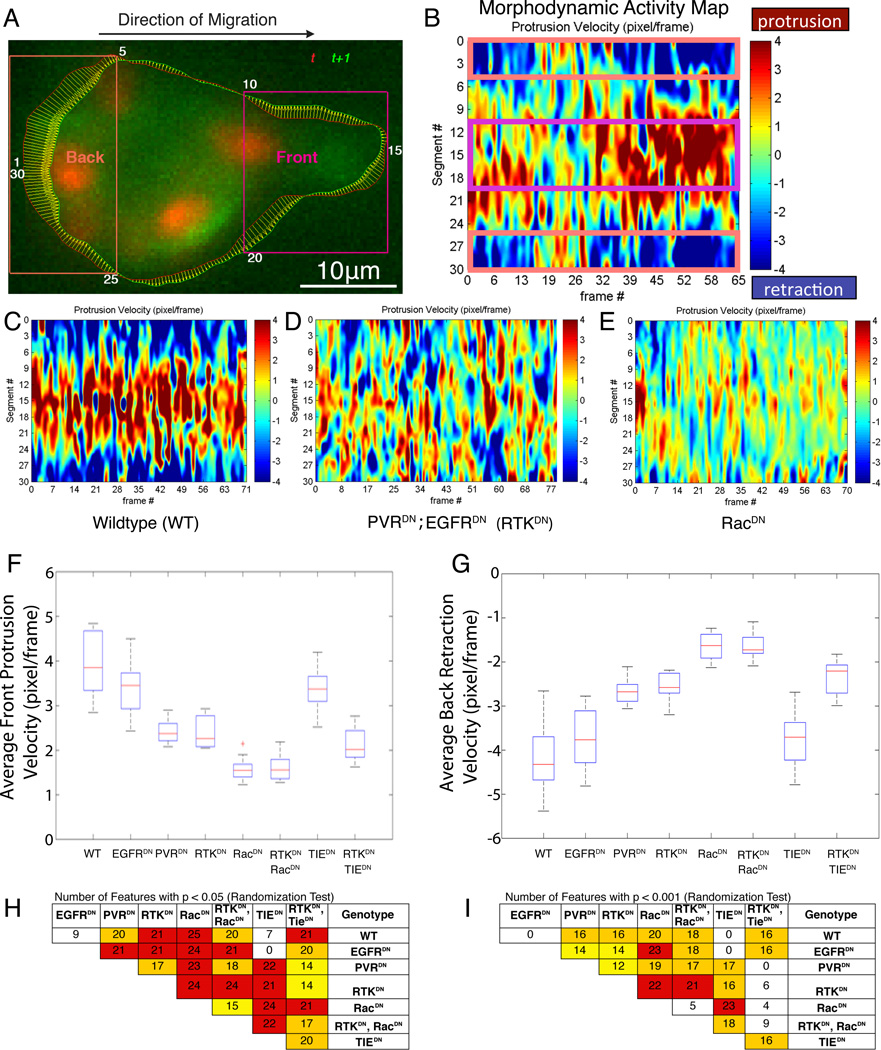
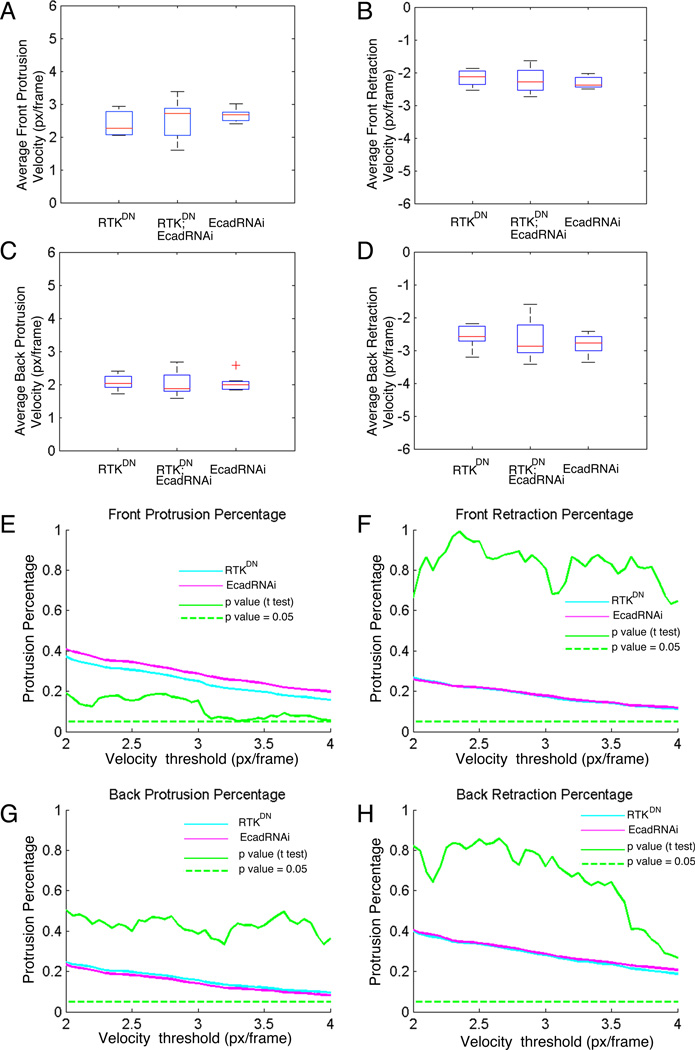
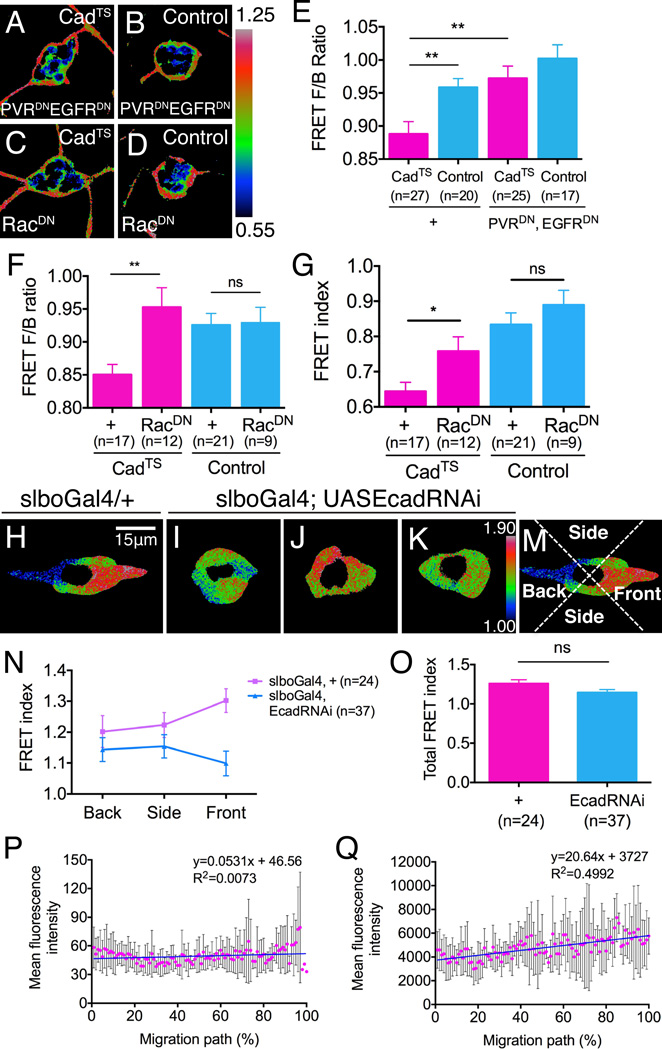
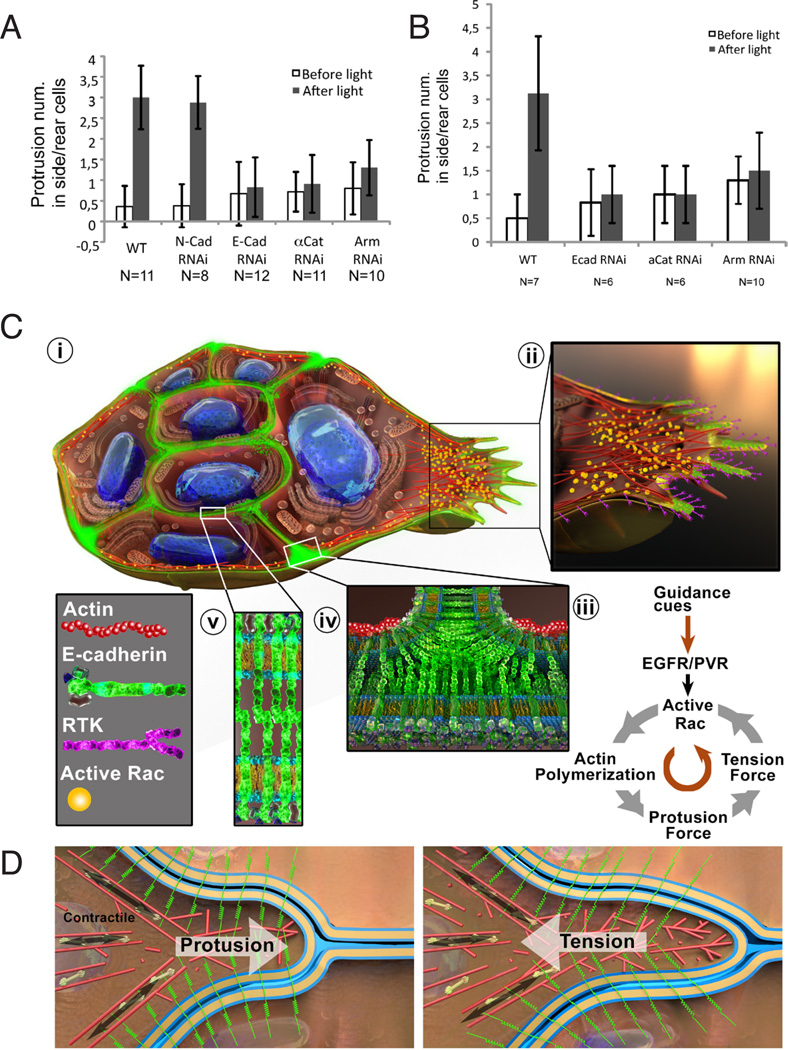
E-cadherin is a major homophilic cell-cell adhesion molecule that inhibits motility of individual cells on matrix. However, its contribution to migration of cells through cell-rich tissues is less clear. We developed an in vivo sensor of mechanical tension across E-cadherin molecules, which we combined with cell-type-specific RNAi, photoactivatable Rac, and morphodynamic profiling, to interrogate how E-cadherin contributes to collective migration of cells between other cells. Using the Drosophila ovary as a model, we found that adhesion between border cells and their substrate, the nurse cells, functions in a positive feedback loop with Rac and actin assembly to stabilize forward-directed protrusion and directionally persistent movement. Adhesion between individual border cells communicates direction from the lead cell to the followers. Adhesion between motile cells and polar cells holds the cluster together and polarizes each individual cell. Thus, E-cadherin is an integral component of the guidance mechanisms that orchestrate collective chemotaxis in vivo.


Figures

Figure 1
Figure 1. E-cadherin expression and k.d. phenotypes in border cells
(A-C) E-cadherin antibody staining. (A) One ovariole with stages 1-10 of egg chamber development. Early (B) and mid (C) stage 9 egg chambers. Images are pseudo-colored (using Rainbow RGB in Image J) to emphasize spatial differences in E-cadherin concentration. Arrows indicate border cell clusters. Insets show magnified views. Asterisks mark polar cells. (D-F) Specific inhibition of E-cadherin in outer, migratory cells. (D) slboGal4-driven expression of GFP in outer migratory cells, not polar cells (*). (E) Normal expression of E-cadherin (Ecad, green) in border cells and polar cells. (F) Inhibition of Ecad expression by slboGal4 driven RNAi in outer border cells, not polar cells (*). In E and F, nuclei are labeled with DAPI (blue) and cytoplasm with Singed (SN) antibody (red). (G) WT stage 10 egg chamber showing normal migration of border cells (arrow) to the oocyte. (H) Abnormal position of border cells (arrow) following inhibition of Ecad expression by slboGal4 driven RNAi. (I) Directional persistence values calculated from movies. Genotypes are slboGal4; UAS-dsRed, UASmCD8 GFP with or without UAS EcadRNAi. ***p<0.001. Data are presented as mean ± SEM. (J-K) Diagrams showing three representative traces of migration paths from movies of WT (J) and Ecad RNAi border cell clusters (K). (L-M) Histogram showing the spatial distribution of border cells in stage 10 egg chambers from slboGal4 females with or without UASEcadRNAi.
Figure 2
Figure 2. Effects of germline and polar cell E-cadherin RNAi or over-expression on border cell migration
(A-B) Distribution of E-cadherin in stage 10 egg chambers following nurse cell-specific Ecad RNAi (A) or overexpression (B). Border cell cluster positions are marked by arrows. (C) Diagram showing representative migration paths of 1.WT; 2.TripleGal4, UASpEcad; 3.TripleGal4, EcadRNAi border cells. (D-F) Quantification of migration phenotypes. *p<0.05; **p<0.005. Data are presented as mean ± SEM. (G-I) Magnified views of border cell clusters of the indicated genotypes showing the effects of inhibition (H) or over-expression (I) of E-cadherin in the germline on border cell protrusion. (J) Quantification of border cell migration at stage 10 with or without full length E-cadherin overexpression in border cells using slboGal4 or polar cells using UpdGal4. (K-M) Stage 10 egg chambers expressing EcadRNAi in polar cells (K) and higher magnification view (K’). (L) A second example. Border cell clusters are marked by slboLifeactGFP. Polar cells express nuclear dsRed. (M) Quantification of split clusters in UpdGal4, tubGal80ts with or without UASEcadRNAi. ***p<0.001. Data are presented as mean ± SEM.
Figure 3
Figure 3. An in vivo E-cadherin tension sensor
(A) Quantification of E-cadherin immunofluorescence intensity at the front and back of migrating border cell clusters. Data are presented as mean ± SEM. (B) Schematic drawing of the tension-sensing (TS) module. Teal fluorescent protein (mTFP) is separated from Venus, a yellow fluorescent protein, by a nano-spring protein domain from spider silk. In the relaxed state, the two fluorophores are close enough to allow FRET. The spider silk domain stretches in response to pico Newton forces, reducing FRET (Grashoff et al., 2010 see text and Experimental Procedures for details). (C) Schematic of the E-cadherin tension sensor (CadTS), and (D) a corresponding control construct, which should not be tension-sensitive. (E-H) Rescue of Armadillo expression (Arm, which is Drosophila β-catenin) in border cells after EcadRNAi (F) by CadTS (G) and control (H). Polar cells are marked by asterisks. Scale bar shows 10 μm. (I-J) Histograms showing CadTS and control rescuing border cell migration after border cells-specific (I) and nurse cell-specific (J) EcadRNAi. (K-N) Colocalization of CadTS with Arm. (O-P’) FRET images of border cell CadTS (O) and control (P) pseudo-colored in Rainbow RGB. The outlines of border cells are shown by Lifeact-RFP which is co-expressed in the same experiment (O’, P’). (Q) Histogram showing the front to back FRET ratios for CadTS (blue) and control (pink). Data are presented as mean ± SEM. **p<0.005. See also Supplemental Figure S2.
Figure 4
Figure 4. Morphodynamic profiling of border cell migration
(A) Border cell cluster labeled with nuclear dsRed and mCD8GFP. Overlaid are the cluster outlines at t (red) and t+1 (green), and local displacement vectors mapping corresponding outline points between the time points. Local displacement vectors were binned and averaged in 30 boundary segments of equal length (enumerated clockwise). Purple boxes highlight the cluster front and back as defined by the boundary segment (front, segments 10-20; back segments 25-30 and 1-5) Scalebar: 10μm. (B) Segmental average velocities were mapped time point by time point into the columns of a matrix referred to as morphodynamic activity map and color coded for visualization (red colors, protrusion; blue colors, retraction). (C-E) Representative morphodynamic activity maps for a WT cluster (C), and for clusters expressing dominant negative constructs of EGFR and PVR guidance receptors (collectively referred to as RTKDN) (D), and of their downstream effector Rac1 (RacDN) (E). (F, G) Comparison of genotypes related to chemotactic guidance signaling in terms of the average velocity of protruding segments at the front and retracting segments at the back. Box plots (boxes indicate 25%, 50%, and 75% quantiles; whiskers indicate 95% range) show the distributions of the per-cluster averages. Each condition has been measured in at least 8 repeats (see Supplemental Table S2 for documentation of data sets). (H, I) Profiles consisting of 26 features (see Supplemental Table S3) were extracted from morphodynamic activity maps. Tables show for pairwise comparison how many features differed between indicated genotypes using randomization tests of individual features. Tests were run at p-value thresholds p<0.05 (H) and p<0.001 (I). White, < 10 features differ; yellow, 10 – 15 features differ; orange, 16 – 20; red, >20 features differ. See also Supplemental Figure S3.
Figure 5
Figure 5. Border cell clusters deficient in expression of E-cadherin exhibit morphodynamic shifts identical to border cell clusters expressing dominant negative guidance receptors
(A-D) Comparison of average velocity of protruding and retracting segments at the cluster front and cluster back between border cell clusters expressing RTKDN alone, or in combination with E-cadherin knock-down, and border cell clusters with E-cadherin knock-down only. (E-H) Comparison of fractions of protruding and retracting sectors at cluster front and back between border cell clusters expressing RTKDN and E-cadherin knock-down. Fractional features depend on the selection of a threshold separating quiescent from protruding/retracting segments. The similarity between the features for the two genotypes is robust across the entire range of velocity thresholds. P-values of randomization test indicated in green, on the same axis as the fractions. See also Supplemental Figure S4.
Figure 6
Figure 6. Spatial distributions and interplay of guidance signals
(A-G) Effects of guidance receptor signaling on the distribution of tension on E-cadherin. (A-D) FRET images of (A) CadTS and (B) the tension insensitive control in border cell clusters expressing PVRDN and EGFRDN to inhibit guidance receptor signaling, or expressing RacDN (C, D). Lower FRET corresponds to higher tension. (E, F) Front to back (F/B) FRET ratios for clusters expressing CadTS (pink) or the control sensor (blue). **p<0.005. Data are presented as mean ± SEM. (G) FRET indices of CadTS and the control sensor at the fronts of clusters expressing RacDN compared to WT (+). *p<0.05. Data are presented as mean ± SEM. (H-K) Distribution of Rac activity in (H) a WT cluster and (I-K) three examples of clusters expressing EcadRNAi specifically in outer migratory border cells. Rac FRET images are pseudo-colored using Rainbow RGB. (M) To quantify the spatial distributions, FRET images were divided into quadrants (front, sides, back) and the mean FRET value of each quadrant determined. (N) Graph of the mean Rac FRET values for the front, sides and back of the indicated numbers of border cell clusters. Data are presented as mean ± SEM. (O) Histogram of total FRET indices in slboGal4 egg chambers with (blue) and without (pink) EcadRNAi. Data are presented as mean ± SEM. (P, Q) Distributions of PVF1 and E-cadherin along the border cell migration path. (P) Anti-PVF1 staining intensity and (Q) Anti-E-cadherin staining intensity along the border cell migration paths measured in stage 9 egg chambers. 0% indicates the anterior end of the egg chamber. 100% indicates the nurse cell/oocyte border. Data are presented as mean ± SD. Linear regression was performed and line fitted to the graph.
Figure 7
Figure 7. Adherens junction components are required for communication between border cells
(A) Quantification of side and rear protrusions before and after photo-inactivation of Rac in the leading cell. In WT clusters and those expressing a control RNAi against N-cadherin (N-Cad) inhibition of Rac in the lead cell, using a photo-inhibitavable form of Rac, induces ectopic protrusions in other cells (Wang et al., 2010). Inhibiting expression of E-cadherin (E-cad), alpha-catenin (αCat) or Armadillo (Arm) eliminates cell-cell communication and thus ectopic protrusions. Data are presented as mean ± SD. (B) Photo-inhibition of Rac in flip-out clone before and after adherens junction component knock-down in the same clone. See also Supplemental Figure S5. (C) Illustration of the multiple roles of E-cadherin in a border cell cluster migrating from left to right. i. Cutaway overview showing a central pair of polar cells surrounded by multiple migratory cells. The leading cell is on the right. ii. Enlargement of the leading edge. iii. Depiction of the feedback loop between the RTKs, E-cadherin and Rac. iv. Enlargement of a border cell-border cell junction where the high concentration of E-cadherin and coupling to F-actin cables mediate communication of direction from the lead cell to the followers. v. Enlargement of a border cell-polar cell junction where stable adhesion holds the cluster together and creates a “back” for each cell. (D) Illustration of the protrusive and contractile forces (i) that together generate tension (ii) on E-cadherin at the protruding leading edge. Actin filaments are shown in red. E-cadherin is green. Border cell and nurse cell plasma membranes are in gold.

References

    1. Arboleda-Estudillo Y, Krieg M, Stuhmer J, Licata NA, Muller DJ, Heisenberg CP. Movement directionality in collective migration of germ layer progenitors. Curr Biol. 2010;20:161–169. - PubMed
    1. Birukova AA, Tian Y, Dubrovskyi O, Zebda N, Sarich N, Tian X, Wang Y, Birukov KG. VE-cadherin trans-interactions modulate Rac activation and enhancement of lung endothelial barrier by iloprost. Journal of cellular physiology. 2012;227:3405–3416. - PMC - PubMed
    1. Borghi N, Sorokina M, Shcherbakova OG, Weis WI, Pruitt BL, Nelson WJ, Dunn AR. E-cadherin is under constitutive actomyosin-generated tension that is increased at cell-cell contacts upon externally applied stretch (vol 109, 12568, 2012) P Natl Acad Sci USA. 2012;109:19034–19034. - PMC - PubMed
    1. Carmona-Fontaine C, Matthews HK, Kuriyama S, Moreno M, Dunn GA, Parsons M, Stern CD, Mayor R. Contact inhibition of locomotion in vivo controls neural crest directional migration. Nature. 2008;456:957–961. - PMC - PubMed
    1. Charest PG, Firtel RA. Feedback signaling controls leading-edge formation during chemotaxis. Curr Opin Genet Dev. 2006;16:339–347. - PubMed

Publication types

Associated data