. 2014 Jul 1;86(13):6563-71.
doi: 10.1021/ac5010794. Epub 2014 Jun 10.

Phenotypic mapping of metabolic profiles using self-organizing maps of high-dimensional mass spectrometry data

Affiliations

Phenotypic mapping of metabolic profiles using self-organizing maps of high-dimensional mass spectrometry data

Cody R Goodwin et al. Anal Chem. .

Abstract

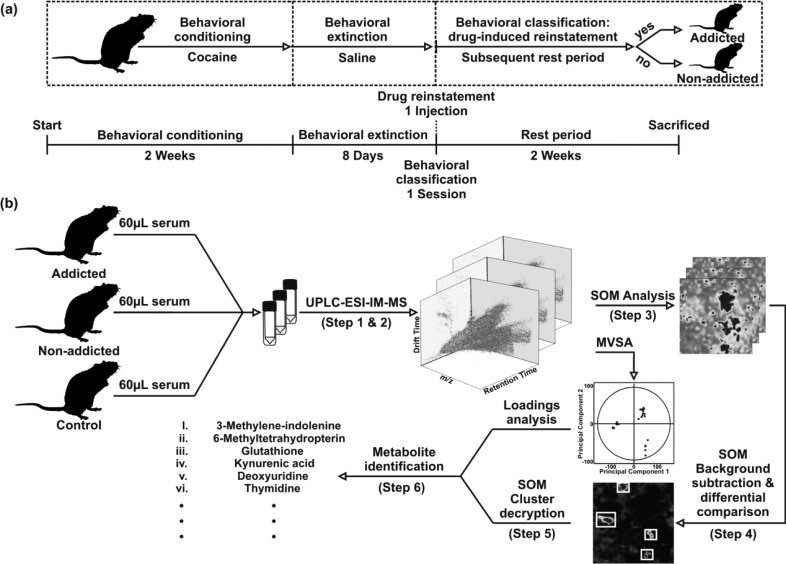
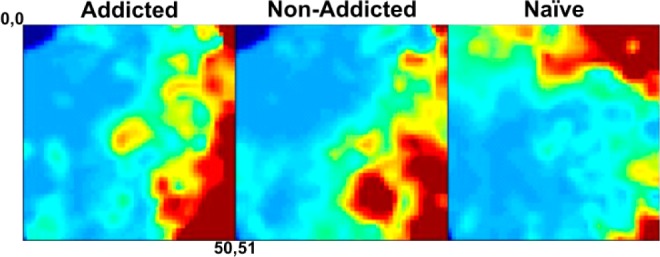
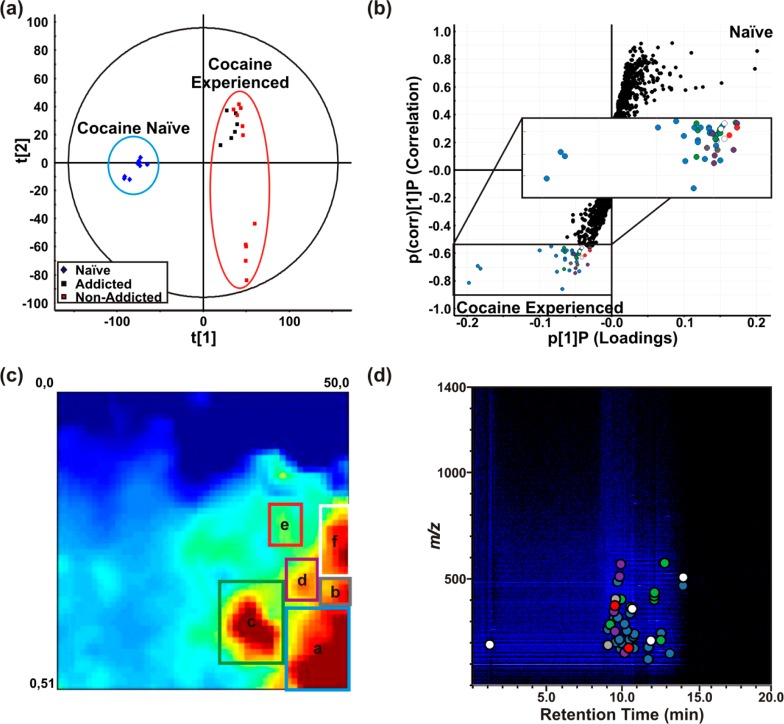
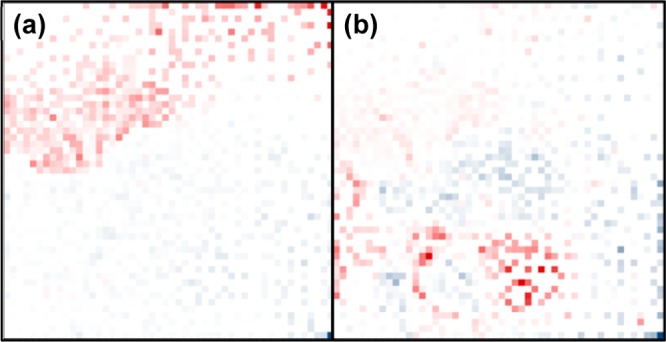
A metabolic system is composed of inherently interconnected metabolic precursors, intermediates, and products. The analysis of untargeted metabolomics data has conventionally been performed through the use of comparative statistics or multivariate statistical analysis-based approaches; however, each falls short in representing the related nature of metabolic perturbations. Herein, we describe a complementary method for the analysis of large metabolite inventories using a data-driven approach based upon a self-organizing map algorithm. This workflow allows for the unsupervised clustering, and subsequent prioritization of, correlated features through Gestalt comparisons of metabolic heat maps. We describe this methodology in detail, including a comparison to conventional metabolomics approaches, and demonstrate the application of this method to the analysis of the metabolic repercussions of prolonged cocaine exposure in rat sera profiles.


Figures

Figure 1
Figure 1
Self-administration experimental design and data acquisition, processing, and interpretation workflow. (a) The experimental design for self-administration is shown. All rats are first subjected to a behavioral conditioning phase, during which they are trained to self-administer cocaine through operant conditioning. An extinction phase follows, with the intent of extinguishing cocaine-seeking behavior. Subsequently a reinstatement injection is given, and the drug-seeking behavior of the rat then classifies the level of addiction. Time scales are shown below. (b) The complete analytical process for data acquisition, processing, and interrogation is shown. Each step is described in detail in the text.
Figure 2
Figure 2
Representative MEDI heat maps indicating relative analyte intensity. For each of the two behavioral groups of cocaine use (addicted and nonaddicted) and cocaine-naïve rat sera metabolomes, corresponding average MEDI heat maps are presented. The static metabolite phenotypes displayed through self-organizing maps indicate gross differences between each group. (Maps represent averages of technical triplicates for three naïve biological samples, four nonaddicted biological samples, and two addicted biological samples, respectively.)
Figure 3
Figure 3
Rat sera metabolome depictions for cocaine-experienced versus naïve classes. (a) Principal component analysis (PCA) of cocaine-experienced (block markers) rat sera metabolomes plotted with cocaine-naïve (diamond markers). Behavioral subclasses are indicated by color. (b) S-plot comparing cocaine-experienced (−1) to cocaine-naïve (+1) metabolomes. (Marker color corresponds to the boxes in panel c (inset shows a magnified subimage).) (c) Differential MEDI heat map of average cocaine-experienced metabolic profiles with average cocaine-naïve profiles subtracted. Boxed-in regions are then delineated in panel (d), which is an annotated representative UPLC-MS heat map marking feature location on the cocaine-experienced UPLC-MS plot. The colored dots correspond to the different feature islands in panel c [Box dimensions: a (39,38:50,51); b (46,33:50,37); c (28,34:38,46); d (39,28:45,36); e (36,20:42,27); f (46,20:50,32)]. (Analysis contains technical triplicates for three naïve biological samples, two addicted biological samples, and four nonaddicted biological samples.)
Figure 4
Figure 4
Loadings contribution of nodes to PCA. The contributions of each node to (a) the first principal component and (b) the second principal component are indicated by color intensity. Red indicates a negative contribution and blue indicates a positive contribution.
Figure 5
Figure 5
Histogram depicting the intensity integrated over six of the enclosed regions of MEDI heat map in Figure 3b. Rats with a history of cocaine exposure (white) had mean intensities significantly higher than cocaine-naïve rats (blue) in all regions tested (p < 0.05). In addition, the mean intensity of region “f” was significantly higher in cocaine-addicted rats (black) than nonaddicted (red) (p < 0.01).

References

    1. Patti G. J.; Yanes O.; Siuzdak G. Nat. Rev. Mol. Cell Biol. 2012, 13, 263–269. - PMC - PubMed
    1. Kohonen T.; Oja E.; Simula O.; Visa A.; Kangas J. Proc. IEEE 1996, 84, 1358–1384.
    1. Skific N.; Francis J. A.; Cassano J. J. J. Climate 2009, 22, 4135–4153.
    1. Kohonen T.; Niklasson L.; Bodén M.; Ziemke T. In Proceedings of ICANN98, The 8th International Conference on Artificial Neural Networks; Springer, 1998; Vol. 1, pp 65–74.
    1. Correia Baptista Soares de Mello J. C.; Goncalves Gomes E.; Angulo Meza L.; Biondi Neto L.; Gomes Pinto de Abreu U.; de Carvalho T. B.; de Zen S. In Applications of Self-Organizing Maps, 1st Edition; Johnsson M., Ed.; InTech Publishers: Midlothian, TX, 2012; Chapter 4, pp 67–88.

Publication types