. 2014 Jun 9;29(5):591-606.
doi: 10.1016/j.devcel.2014.04.010. Epub 2014 May 22.

VARP is recruited on to endosomes by direct interaction with retromer, where together they function in export to the cell surface

Affiliations

VARP is recruited on to endosomes by direct interaction with retromer, where together they function in export to the cell surface

Geoffrey G Hesketh et al. Dev Cell. .

Abstract

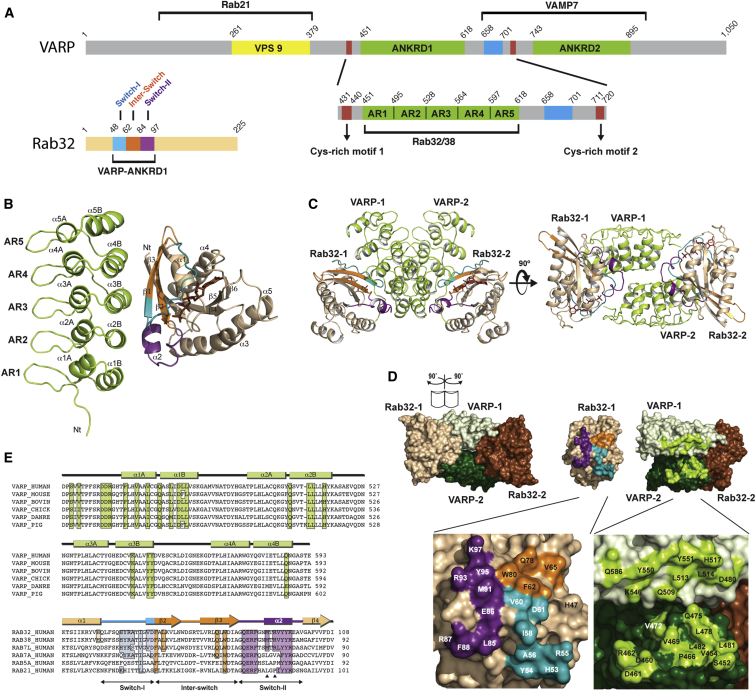
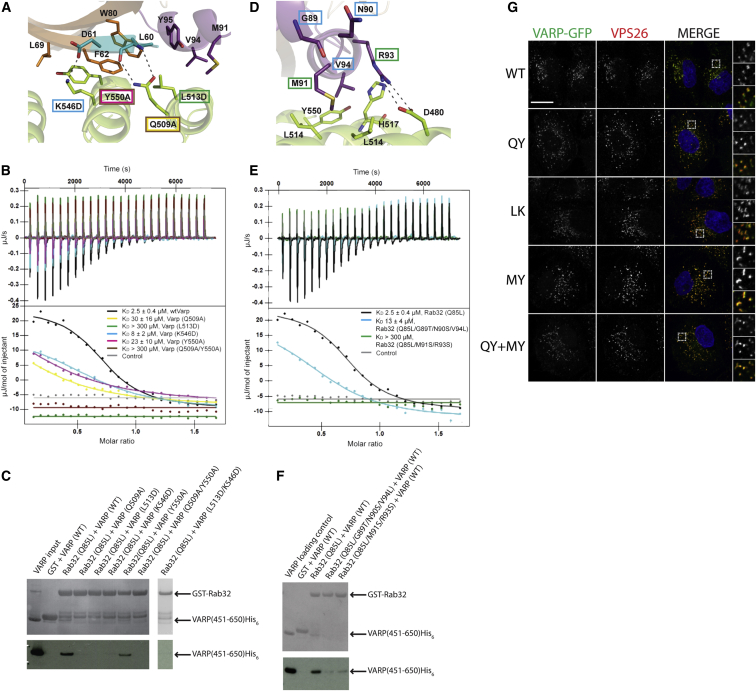
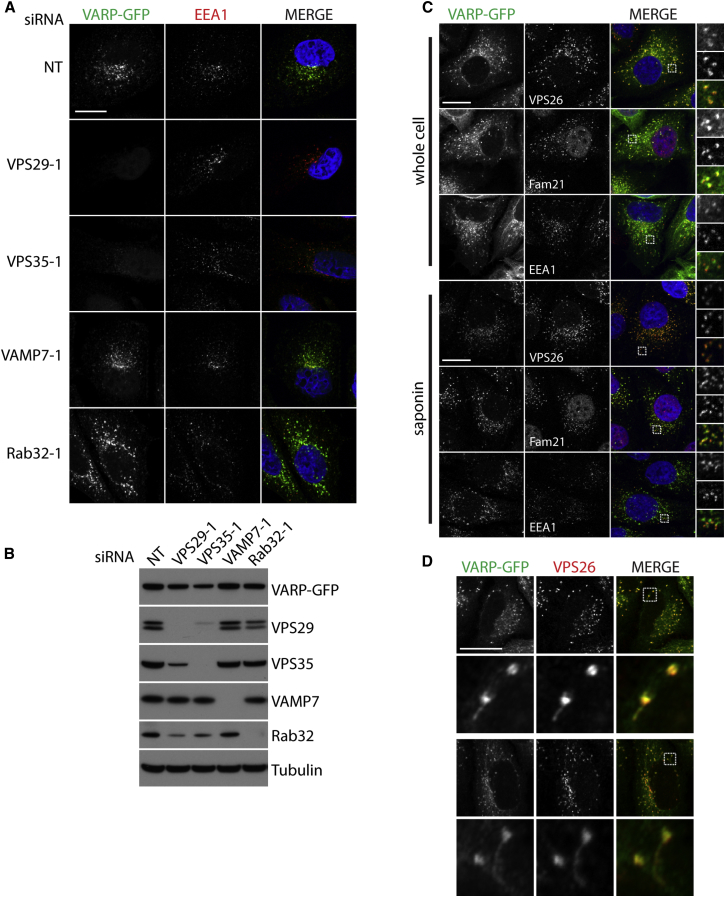
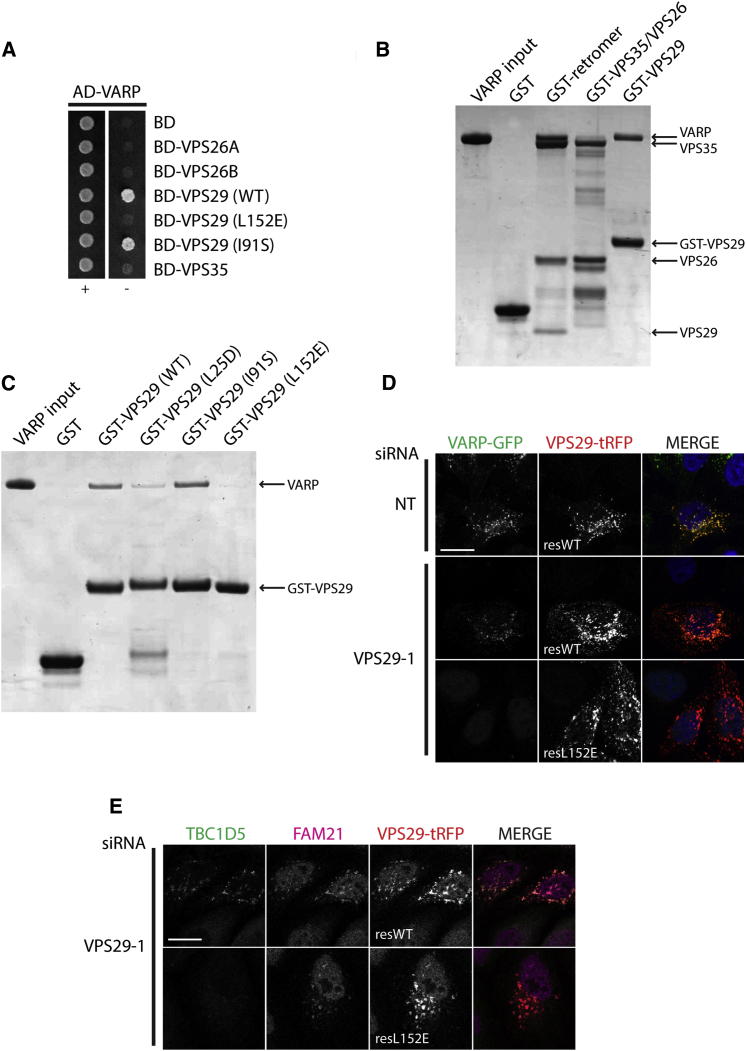
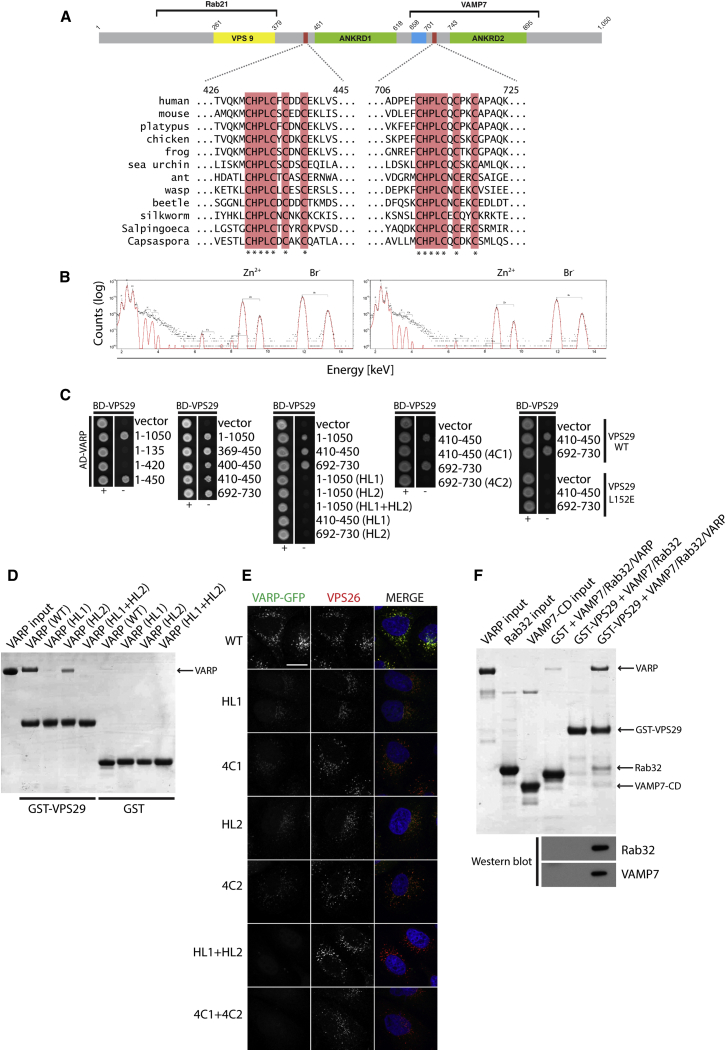
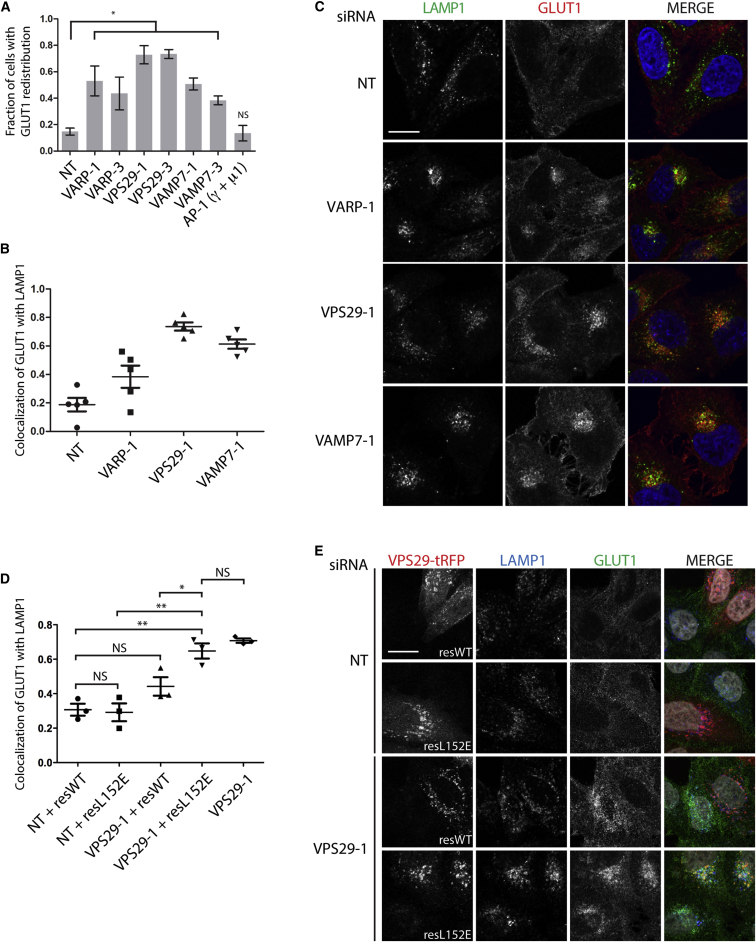
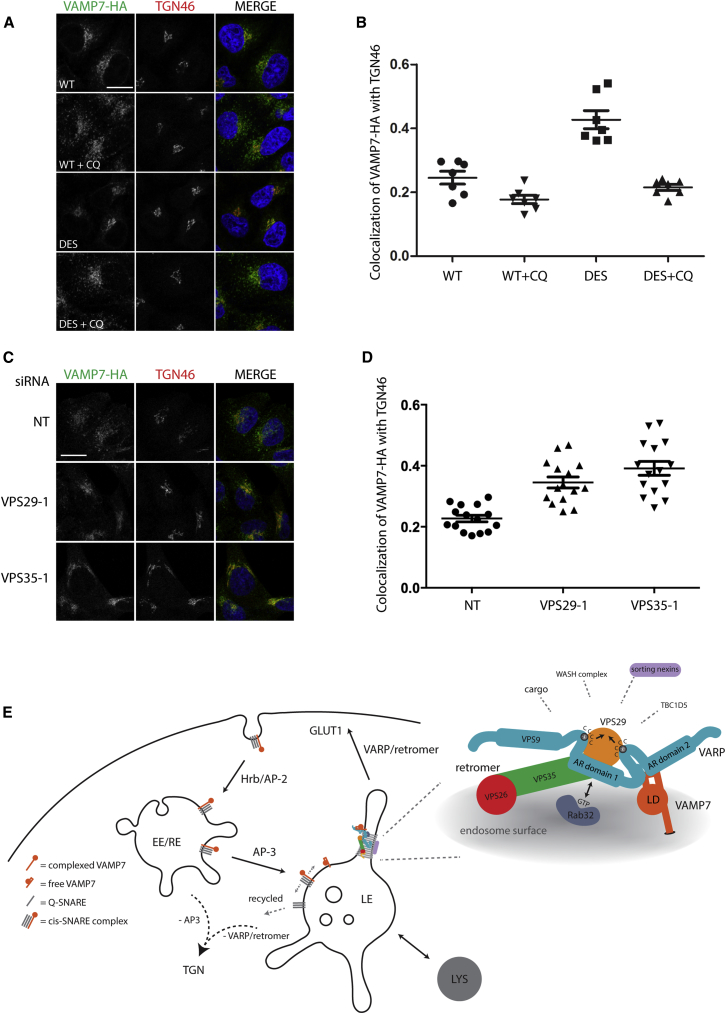
VARP is a Rab32/38 effector that also binds to the endosomal/lysosomal R-SNARE VAMP7. VARP binding regulates VAMP7 participation in SNARE complex formation and can therefore influence VAMP7-mediated membrane fusion events. Mutant versions of VARP that cannot bind Rab32:GTP, designed on the basis of the VARP ankyrin repeat/Rab32:GTP complex structure described here, unexpectedly retain endosomal localization, showing that VARP recruitment is not dependent on Rab32 binding. We show that recruitment of VARP to the endosomal membrane is mediated by its direct interaction with VPS29, a subunit of the retromer complex, which is involved in trafficking from endosomes to the TGN and the cell surface. Transport of GLUT1 from endosomes to the cell surface requires VARP, VPS29, and VAMP7 and depends on the direct interaction between VPS29 and VARP. Finally, we propose that endocytic cycling of VAMP7 depends on its interaction with VARP and, consequently, also on retromer.


Figures

Figure 1
Figure 1
Structure of the VARP-ANKRD1:Rab32 Complex (A) Schematic representation of VARP and Rab32 proteins, highlighting the functions of different domains. The domain color scheme depicted is used in all subsequent figures. (B) Structure of the VARP (residues 451–640): Rab32(Q85L) heterodimer in “ribbon representation,” with GppCp shown as ball and stick. (C) Orthogonal views of a VARP:Rab32 2:2 cross-dimer formed from two heterodimers that are in different asymmetric units. In the left-hand view, the membrane is located at the bottom, and in the right-hand view, the tetramer is viewed “through the membrane.” (D and E) Surface representation, in (D), of the cross-dimer “opened out” as indicated to show the residues involved in the two different VARP:Rab32 interactions. The main residues involved are labeled in the zoomed-in views (bottom panels) and are shown highlighted in the same colors in the sequence alignment shown in (E). See also Figure S1.
Figure 2
Figure 2
Biochemical Analysis and In Vivo Role of the VARP:Rab32 Interaction (A) Molecular details of the VARP:Rab32 heterodimer interface. Residues mutated in VARP are boxed in color. (B) Effects on the binding of the VARP:Rab32 interaction of mutating key VARP residues in the interface as measured by ITC. Curves are color coded as in (A). (C) GST pull-downs using GSTRab32(Q85L) and VARP451-640His6 showing the effect of mutating key residues on VARP in the interaction interface (A). (D) Molecular details of VARP:Rab32 interface in orthogonal view to (A). Residues mutated in Rab32 are boxed in color. (E) Effects on the VARP:Rab32 interaction of mutating key Rab32 residues in the interface as measured by ITC. Curves are color coded as in (D). (F) GST pull-downs using GSTRab32(Q85L) and VARP451-640His6 showing the effect of mutating key residues on Rab32 in the interaction interface (D). (G) IF confocal microscopy of cytosol-extracted HeLa cells stably expressing VARP-GFP constructs: WT, Q509A/Y550A (QY), L513D/K546D (LK), M684D/Y687S (MY), and Q509A/Y550A/M684D/Y687S (QY+MY). GFP, green; VPS26, red; nuclei, blue, merged panel (MERGE). Boxed regions in the merged panels are shown as separate green (top), red (middle), and merged (bottom) channels on the right. Colocalization coefficients for the VPS26 versus GFP signals were as follows: WT, 0.89; QY, 0.75; LK, 0.59; MY, 0.66; QY+MY, 0.64. Scale bar, 20 μm. In (B) and (E), curves for data showing binding are the mean of a minimum of three experiments ± SD. In (C) and (F), top panels are gel stained with Coomassie blue, and the lower panels are western blots using an anti-His probe. See also Figure S2.
Figure 3
Figure 3
Retromer Recruits VARP on to Endosomes (A) IF confocal microscopy of cytosol-extracted HeLa cells stably expressing VARP-GFP, which were knocked down using single siRNA oligonucleotides at 100 nM (NT, nontargeting control, VPS29-1, VPS35-1, VAMP7-1, Rab32-1). GFP, green; EEA1, red; nuclei, blue, merged panel (MERGE). (B) Western blots of the cells imaged in (A) showing successful protein depletion. (C) IF confocal microscopy of VARP-GFP cells. GFP, green; and either VPS26, Fam21, or EEA1, red; nuclei, blue, merged panels. Cells were either fixed intact (whole cell) or after cytosol extraction (saponin). Boxed regions in the merged panels are shown as separate green (top), red (middle), and merged (bottom) channels on the right. Colocalization coefficients for VPS26, FAM21, and EEA1 versus GFP were as follows, respectively (saponin only): VPS26, 0.56; FAM21, 0.16; EEA1, 0.67. (D) IF confocal microscopy image of VARP-GFP cells. GFP, green; VPS26, red; the boxed regions (shown in the MERGE column) are enlarged below each image, demonstrating colocalization of VARP-GFP and VPS26 on both vacuolar and tubular domains of endosomes. Scale bars, 20 μm. See also Figure S3.
Figure 4
Figure 4
VARP Binds to a Conserved Hydrophobic Patch on VPS29 (A) Y2H analysis using the activation domain (AD) fused to VARP and the DNA binding domain (BD) fused to the indicated retromer subunits. Strains were grown in the absence (−) or presence (+) of histidine. (B) Coomassie-stained gel of GST pull-down experiment showing the interaction of VARP-His10 (input, left lane) with GST alone, GST-VPS35 + VPS26 + VPS29 (GST-retromer), GST-VPS35 + VPS26 (GST-VPS35/VPS26), and GST-VPS29. (C) Coomassie-stained gel of GST pull-down experiment showing the interaction of VARP-His10 (input, left lane) with GST alone, GST-VPS29 WT, and L25D, I91S, and L152E mutants. (D) IF confocal microscopy of cytosol-extracted VARP-GFP cells knocked down using single siRNA oligonucleotides at 100 nM (NT, nontargeting control, VPS29-1). Twenty-four hours prior to fixation, cells were transiently transfected with VPS29-tRFP WT or L152E mutant. MERGE, merged panels. (E) IF confocal microscopy of cytosol-extracted HeLa cells following knockdown with 100 nM VPS29-1 siRNA oligonucleotide performed as in (D). Twenty-four hours prior to fixation, cells were transiently transfected with VPS29-tRFP WT or L152E mutant (TBC1D5 [green], FAM21 [magenta], VPS29-tRFP imaged by native fluorescence, and nuclei [blue, merged panels]). Scale bars, 20 μm. See also Figure S4.
Figure 5
Figure 5
VARP Binds to VPS29 via Two Conserved Zn2+ Coordinating Cys-Rich Motifs (A) The two conserved Cys-rich motifs (conserved residues highlighted in pink with asterisks beneath them) in VARP from different species. Residue numbering is given for the human sequence. (B) Proton-induced X-ray emission (PIXE) spectra for protein fragments containing the first (residues 396–460, left) and second (residues 692–746, right) Cys-rich motifs, with the Zn and Br peaks labeled above them. Black dots indicate the individual data points, and the red line is the fit. (C–E) In (C), Y2H analysis is shown of the DNA binding domain (BD) fused to VPS29 and the activation domain (AD) fused to the indicated VARP fragments. Mutations within the Cys-rich motifs are labeled as follows in (C), (D), and (E): (first motif) H432A/L434A = HL1, C431S/C435S/C437S/C440S = 4C1; (second motif) H712A/L714A = HL2, C711S/C715S/C717S/C720S = 4C2. (D) Coomassie-stained gel of GST pull-down experiment showing interaction of VARP-His10 WT or the indicated VARP mutants with GST-VPS29 or with GST alone. (E) IF confocal microscopy of cytosol extracted HeLa cells stably expressing VARP-GFP WT or the indicated VARP mutants. GFP, green; VPS26, red; nuclei, blue, merged panels (MERGE). Colocalization coefficients of VPS26 versus GFP were as follows: WT, 0.9; HL1, 0.08; 4C1, 0.09; HL2, 0.07; 4C2, 0.1; HL1+HL2, 0; 4C1+ 4C2, 0. Scale bar, 20 μm. (F) GST pull-down experiment showing the interaction of the indicated combinations of VARP-His10, Rab32, and VAMP7 cytoplasmic domain (CD) (inputs, left three lanes), with either GST alone or GST-VPS29. The pull-down samples were western blotted for Rab32 and VAMP7. See also Figure S5.
Figure 6
Figure 6
The VARP/Retromer/VAMP7 Protein Network Is Required for GLUT1 Trafficking between Endosomes and the Cell Surface (A) HeLa cells knocked down with single siRNA oligonucleotides at 100 nM (NT, nontargeting control). AP-1 γ and μ1 subunits were knocked down simultaneously (pool of four individual oligonucleotides at 20 nM for each subunit). Cells were imaged by IF confocal microscopy, and the fraction of cells with GLUT1 redistributed from the cell surface to an intracellular endosomal localization with the indicated knockdown was graphed (mean ± SEM of three independent experiments with >400 cells scored for each condition, p < 0.05). (B and C) HeLa cells were knocked down as shown in (A), and cells were imaged by IF confocal microscopy. LAMP1, green; GLUT1, red; nuclei, blue, merged panels (MERGE). Five independent fields of cells were imaged for each condition, and the colocalization coefficient measuring the colocalization of GLUT1 with LAMP1 was obtained for each field. The graph in (B) is a representative experiment (mean ± SEM of five fields), with representative IF confocal images shown in (C). (D and E) HeLa cells were knocked down as in (A) with either nontargeting control (NT) or VPS29-1 oligonucleotides. Twenty-four hours prior to fixation, cells were transfected with siRNA-resistant VPS29-tRFP WT (resWT) or L152E mutant (resL152E). Cells were imaged by IF confocal microscopy. tRFP, red; LAMP1, blue; GLUT1, green; nuclei, white, merged panels (MERGE). Individual VPS29-tRFP-expressing cells (≥17 cells per condition) were identified, and the colocalization coefficient measuring the colocalization of GLUT1 with LAMP1 was obtained for each cell. Colocalization coefficients from three independent experiments are shown in (D) (mean ± SEM, p < 0.05, ∗∗p < 0.01, NS, not significant, using a two-tailed unpaired t test), and representative cell images are shown in (E). Cells analyzed in the VP29-1 knockdown-only condition were cells not transfected by VPS29-tRFP within VPS29-1 + resL152E experiments. Scale bars, 20 μm. See also Figure S6.
Figure 7
Figure 7
The Steady-State Localization of VAMP7 Depends on Its Interaction with VARP (A and B) HeLa cells stably expressing VAMP7-HA WT or DES were imaged by IF confocal microscopy: HA, green; TGN46, red; nuclei, blue, merged panels (MERGE). Cells were either left untreated or treated with 100 μM CQ for 2 hr prior to fixation. Seven independent fields (≥10 cells per field) were imaged for each condition, and the colocalization coefficient measuring the colocalization of VAMP7-HA with TGN46 was obtained for each field [mean ± SEM in (B) with representative cell images in (A)]. (C) IF confocal microscopy of VAMP7-HA HeLa cells knocked down with the indicated siRNA oligonucleotides at 100 nM (NT, nontargeting control, VPS29-1, VPS35-1): HA, green; TGN46, red; nuclei, blue, merged panels. Scale bars, 20 μm. (D) Fifteen independent fields (≥10 cells per field) were imaged for each condition, and the colocalization coefficient measuring the colocalization of VAMP7-HA with TGN46 was obtained for each field (mean ± SEM). Data shown are representative of three independent experiments. NT, nontargeting control. (E) Model of the VARP/retromer/VAMP7 protein network. VAMP7 is endocytosed from the plasma membrane as a cis-SNARE complex through the action of Hrb/AP-2 and is subsequently delivered to a late endosomal compartment through the action of AP-3. VARP is recruited to endosomal membranes by the retromer complex through its direct interaction with VPS29, thus allowing VARP to bind to free VAMP7 on the surface of endosomes.

References

    1. Ambrosio A.L., Boyle J.A., Di Pietro S.M. Mechanism of platelet dense granule biogenesis: study of cargo transport and function of Rab32 and Rab38 in a model system. Blood. 2012;120:4072–4081. - PMC - PubMed
    1. Arighi C.N., Hartnell L.M., Aguilar R.C., Haft C.R., Bonifacino J.S. Role of the mammalian retromer in sorting of the cation-independent mannose 6-phosphate receptor. J. Cell Biol. 2004;165:123–133. - PMC - PubMed
    1. Bal M., Leitz J., Reese A.L., Ramirez D.M., Durakoglugil M., Herz J., Monteggia L.M., Kavalali E.T. Reelin mobilizes a VAMP7-dependent synaptic vesicle pool and selectively augments spontaneous neurotransmission. Neuron. 2013;80:934–946. - PMC - PubMed
    1. Boucrot E., Kirchhausen T. Endosomal recycling controls plasma membrane area during mitosis. Proc. Natl. Acad. Sci. USA. 2007;104:7939–7944. - PMC - PubMed
    1. Bultema J.J., Ambrosio A.L., Burek C.L., Di Pietro S.M. BLOC-2, AP-3, and AP-1 proteins function in concert with Rab38 and Rab32 proteins to mediate protein trafficking to lysosome-related organelles. J. Biol. Chem. 2012;287:19550–19563. - PMC - PubMed

Publication types

MeSH terms

Associated data