. 2014 Jun 16;25(6):735-47.
doi: 10.1016/j.ccr.2014.04.021. Epub 2014 May 22.

Stromal elements act to restrain, rather than support, pancreatic ductal adenocarcinoma

Affiliations

Stromal elements act to restrain, rather than support, pancreatic ductal adenocarcinoma

Andrew D Rhim et al. Cancer Cell. .

Abstract

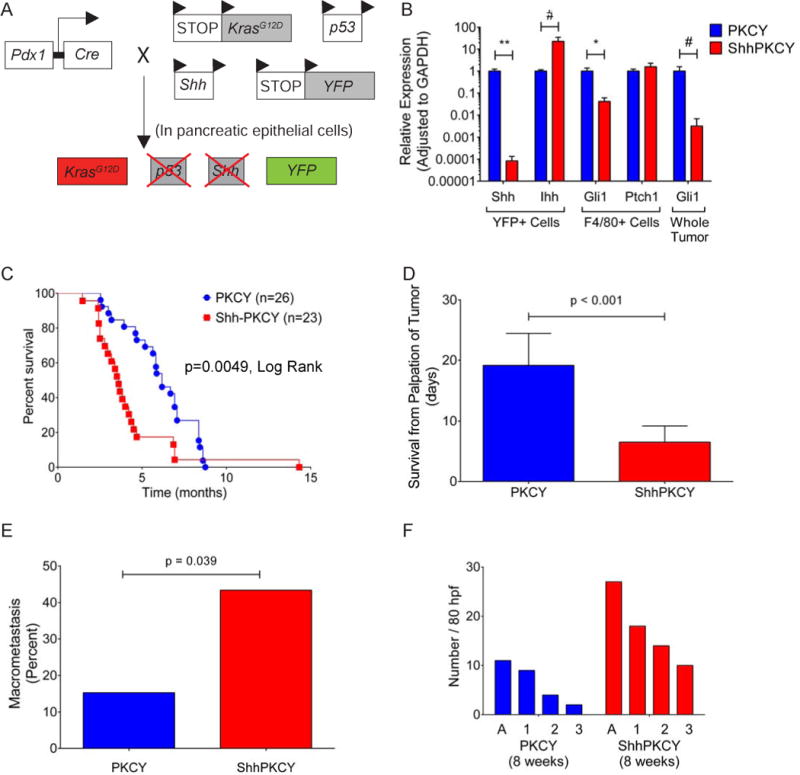
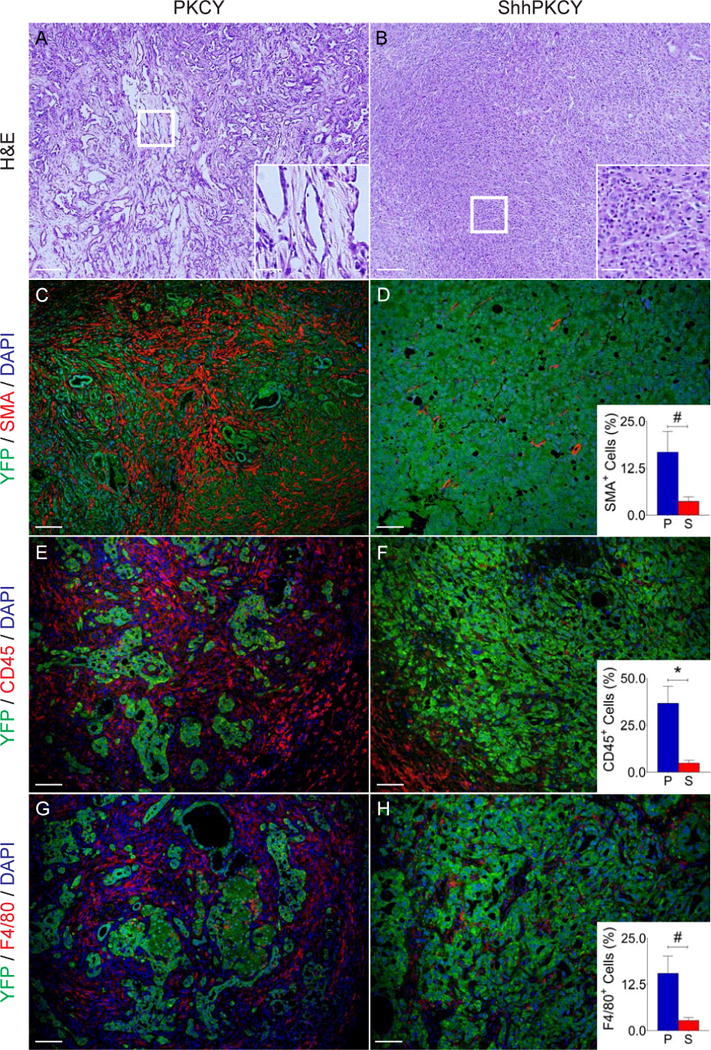
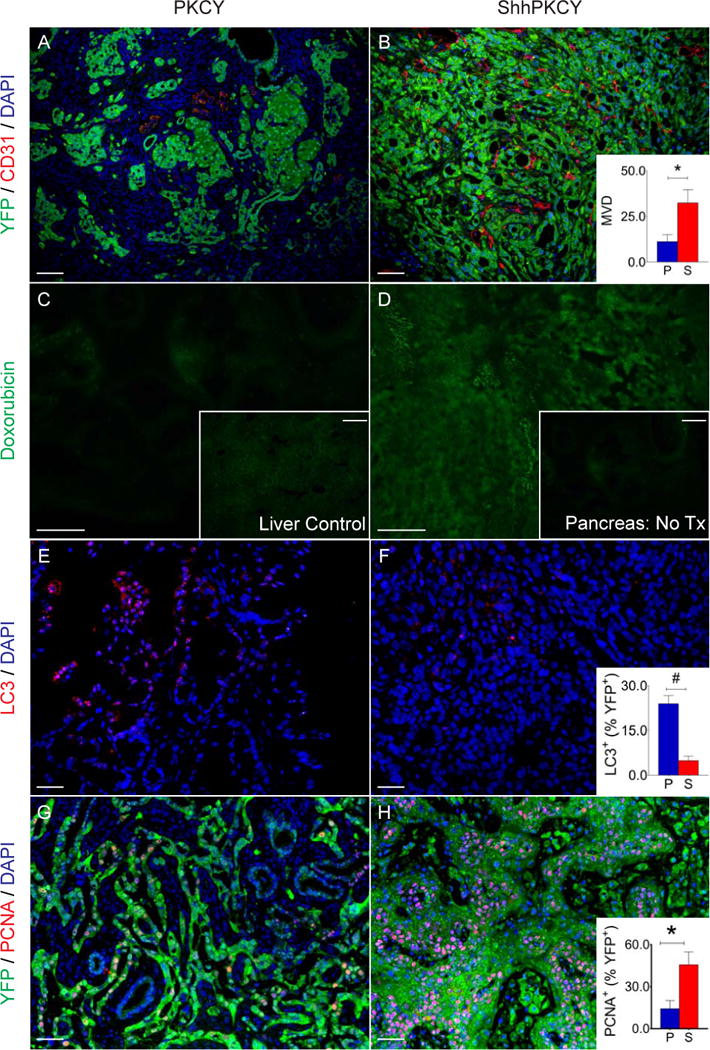
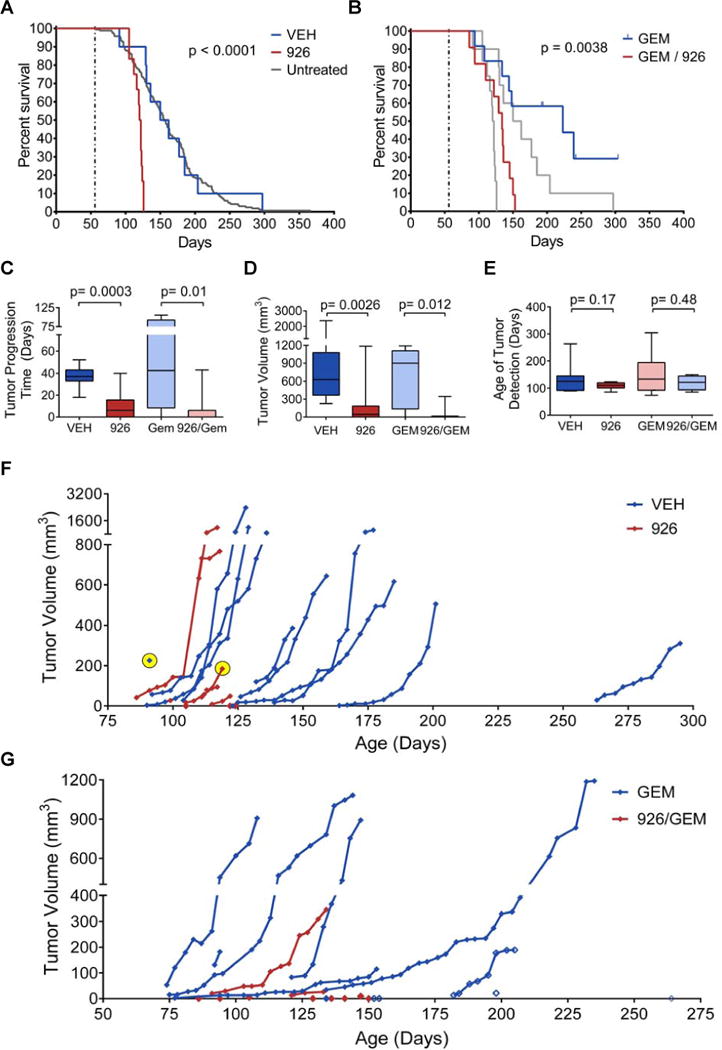
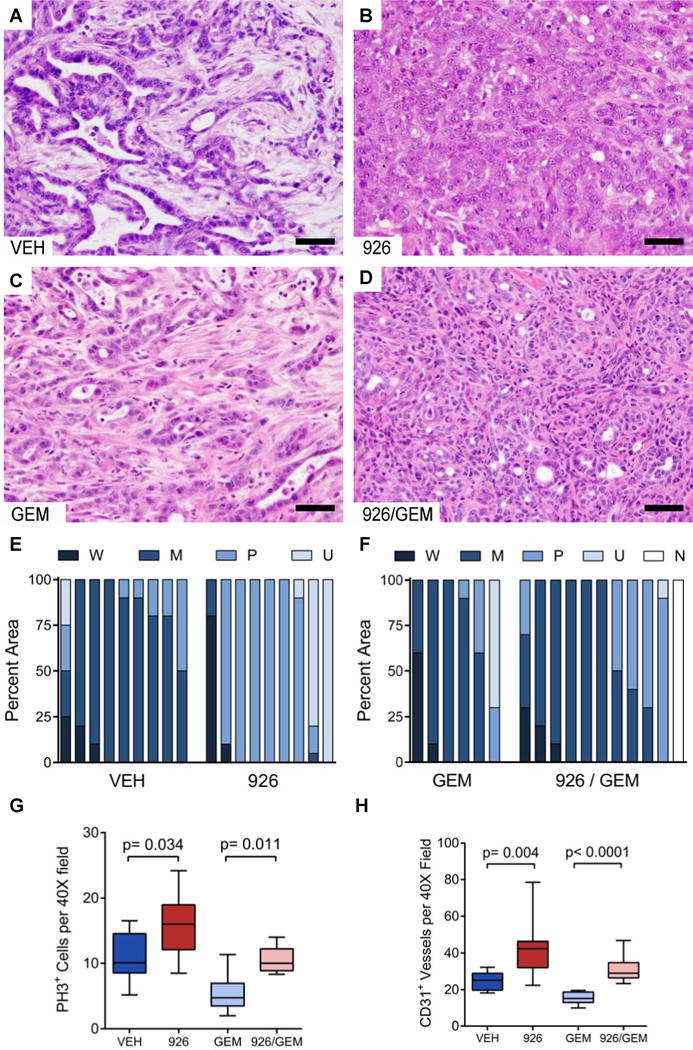
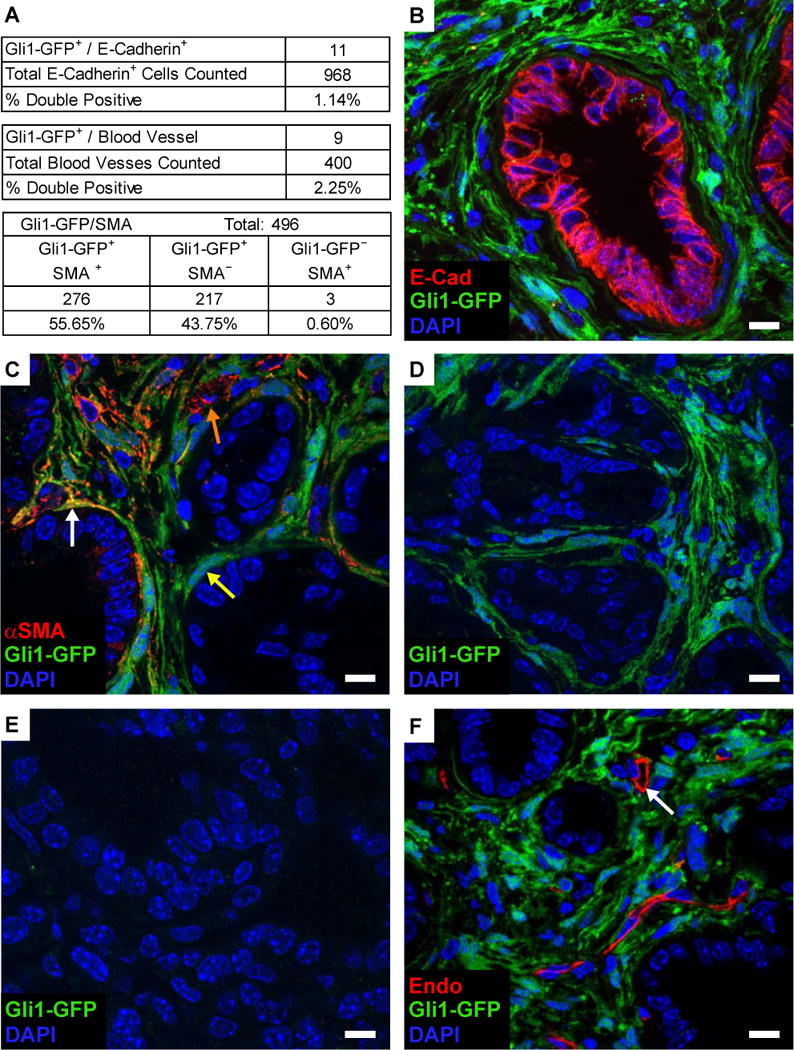
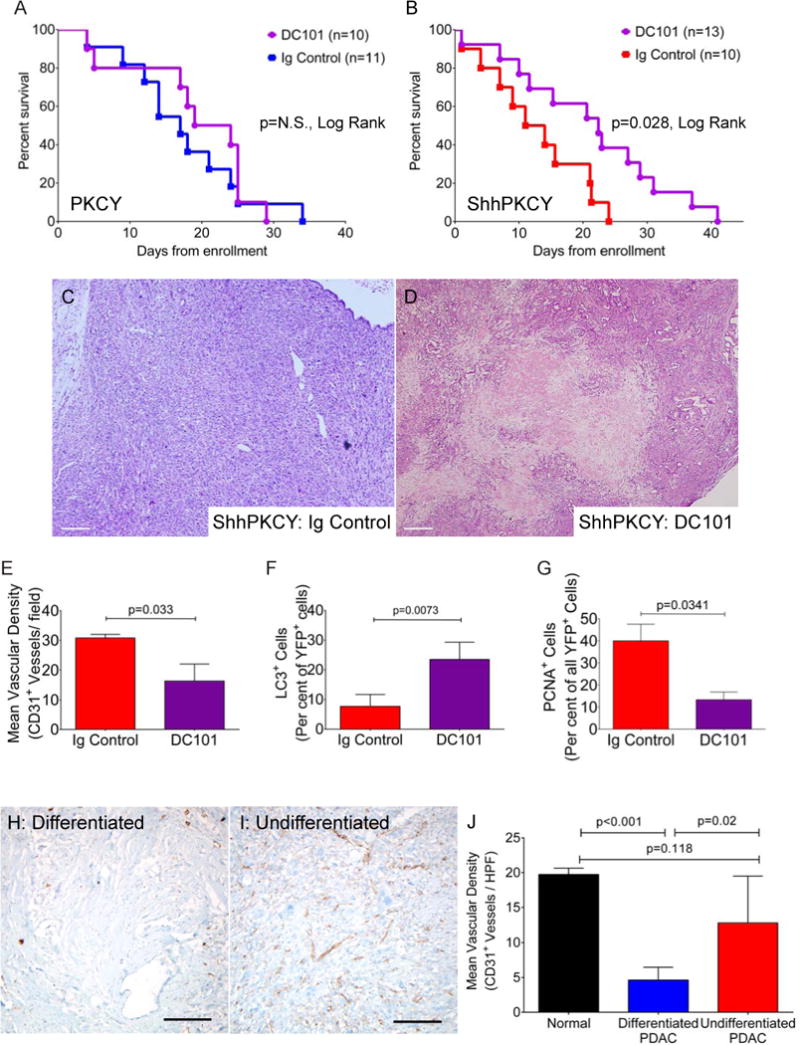
Sonic hedgehog (Shh), a soluble ligand overexpressed by neoplastic cells in pancreatic ductal adenocarcinoma (PDAC), drives formation of a fibroblast-rich desmoplastic stroma. To better understand its role in malignant progression, we deleted Shh in a well-defined mouse model of PDAC. As predicted, Shh-deficient tumors had reduced stromal content. Surprisingly, such tumors were more aggressive and exhibited undifferentiated histology, increased vascularity, and heightened proliferation--features that were fully recapitulated in control mice treated with a Smoothened inhibitor. Furthermore, administration of VEGFR blocking antibody selectively improved survival of Shh-deficient tumors, indicating that Hedgehog-driven stroma suppresses tumor growth in part by restraining tumor angiogenesis. Together, these data demonstrate that some components of the tumor stroma can act to restrain tumor growth.


Figures

Figure 1
Figure 1. Sonic hedgehog behaves as a tumor suppressor in a genetically engineered mouse model of PDAC
(A) Schematic of the ShhPKCY mouse model used in this study, which employs the KrasG12D, (“K”), Pdx1-Cre (“C”), p53 (P”), RosaYFP (“Y”) and Shh alleles. Cre-mediated deletion results in simultaneous activation of Kras, deletion of one allele of p53 and both alleles of Shh, and recombination of the YFP lineage label. (B) Confirmation of Shh knockdown in ShhPKCY animals. qPCR analysis of Hedgehog signaling components in YFP+ sorted pancreatic epithelial derived cells and F4/80+ cells from tumors as well as whole tumor derived from PKCY (blue) and ShhPKCY (red) mice (n=5 for each group; bars represent mean +/− SD). (C) Kaplan-Meier survival analysis for PKCY (n=26) and ShhPKCY mice (n=23). p<0.005 by Mantel-Cox (log-rank) test. (D) Survival of mice from first clinical palpation of tumor. Presence of tumor was confirmed by ultrasound. Bars represent mean +/− SD; p<0.001. (E) Fraction of mice with any macrometastatic lesion by visual inspection at the time of tissue harvest by genotype (n=26 and 23 for PKCY and ShhPKCY mice, respectively). p=0.039. (F) Quantitation of acinar to ductal metaplasia (A) and PanIN lesions by grade (1, 2, or 3) in 8 week-old PKCY and ShhPKCY mice. Eighty non-overlapping high powered fields in which pancreas tissue covered at least 90% of the entire field were analyzed (n=3 for each group). Data are presented as the aggregate number of ADMs and PanINs (by grade) for each genotype. #, p<0.05; *, p<0.01; **, p<0.001 by two-tailed Student’s t test. See also Figure S1.
Figure 2
Figure 2. Loss of Shh leads to a shift in pancreatic tumor histopathology
(A and B) H&E staining showing representative histology from PKCY (A) and ShhPKCY (B) tumors. Insets show higher magnified view of sections marked by the box. (C–H) Multicolor immunofluorescence (IF) images of PKCY (left column) and ShhPKCY tumors (right column) assessed for myofibroblasts (C–D), total leukocytes (E–F), or macrophages (G–H). (C and D) Fluorescent images showing staining with the pancreas epithelial lineage label YFP (green) and the myofibroblast marker alpha smooth muscle actin (SMA, red). Inset, quantitation of SMA+ cells as a percentage of all nucleated (DAPI+) cells within PKCY (blue) and ShhPKCY (red) tumors (n=3–5; #, p=0.016; bars represent mean +/− SD). (E and F) Fluorescent images showing staining with YFP (green) and the pan-leukocyte marker CD45 (red). Inset, quantitation of CD45+ cells as a percentage of all nucleated (DAPI+) cells (n=3–5; *, p=0.0039; bars represent mean +/− SD). (G and H) Fluorescent images showing staining with YFP (green) and the macrophage marker F4/80 (red). Inset, quantitation of F4/80+ cells as a percentage of all nucleated (DAPI+) cells (n=3–5; #, p=0.010; bars represent mean +/− SD). Scale bars = 40 μm for larger images and 20 μm for insets. See also Figure S2.
Figure 3
Figure 3. Shh deletion results in greater vascular density and proliferation within pancreatic tumors
(A and B) Blood vessel density in PKCY and ShhPKCY tumors was determined by staining for the endothelial marker CD31 (red) and the tumor cell lineage marker YFP (green). Inset, measurement of mean vascular density within PKCY (blue) and ShhPKCY (red) tumors (quantified as number of CD31+ vessels per high powered field; n=3–5; *, p=0.004; bars represent mean +/− SD). (C and D) Cellular perfusion in PKCY and ShhPKCY tumors was determined by intravascular delivery of the autofluorescent drug doxorubicin. Inset in C shows fluorescence of a liver section from the same PKCY mouse (positive control). Inset in D shows fluorescence of a ShhPKCY tumor injected with PBS (negative control). (E–F) Autophagy in PKCY and ShhPKCY tumors was determined by staining for the autophagosomal protein LC3 (red). Inset, percentage of LC3+ cells within the YFP+ tumor cell population in PKCY (blue) and ShhPKCY (red) tumors (n=3–5; #, p=0.002; bars represent mean +/− SD). (G–H) Proliferation in PKCY and ShhPKCY tumors was determined by staining for the cell cycle marker PCNA (red). Inset, percentage of PCNA+ cells within the YFP+ tumor cell population in PKCY (blue) and ShhPKCY (red) tumors (n=3–5; *, p=0.004; bars represent mean +/− SD). Scale bars = 40 μm.
Figure 4
Figure 4. Smoothened inhibition accelerates pancreatic tumor development
(A–G) Two separate cohorts of KPC mice were treated with vehicle (VEH) vs. IPI-926 (926), or gemcitabine (GEM) vs. IPI-926 + gemcitabine (926/GEM), beginning at 8 weeks of age, as described in Supplementary Online Methods. High resolution 3D ultrasound was used to monitor tumor development and to quantify tumor volumes. Treatment continued until mice met endpoint criteria. (A) Kaplan-Meier curve showing IPI-926 treated KPC mice (red, n=12), vehicle treated KPC mice (blue, n=12) (p<0.0001, Log Rank test, vehicle versus IPI-926) and an historical collection of untreated KPC mice (gray, n=165) (p<0.0001, Log Rank test, historical cohort versus IPI-926). (B) Kaplan-Meier curve showing IPI-926 + gemcitabine treated KPC mice (red, n=11) and vehicle + gemcitabine treated KPC mice (blue, n=12) (p< 0.004, Log Rank test, gemcitabine + vehicle versus gemcitabine + IPI-926). Data from panel A are overlaid in gray (p=0.01, Log Rank test, IPI-926 versus IPI-926 + gemcitabine). (C) Graph of time from first detection of tumor (by 3D ultrasound) to death in animals among the four treatment groups, comparing animals that received IPI-926 to those that did not (p=0.0003 in monotherapy group, p=0.006 in combination group). Animals with microscopic tumors on necropsy but no measurable tumor on ultrasound were included as 0 days. Data are presented as standard box and whisker plots. (D) Final tumor volumes (measured by 3D ultrasound) among the four treatment groups, comparing animals that received IPI-926 to those that did not (p=0.0026 in monotherapy group, p=0.012 in the combination group). Several IPI-926 treated mice met endpoint criteria prior to the detection of tumors by ultrasound and are included as 0 mm3. Data are presented as standard box and whisker plots. (E) Age of tumor detection (by 3D ultrasound) among the four treatment groups (p=0.17 for monotherapy, p=0.48 for combination). Data are presented as standard box and whisker plots. (F) Graph showing tumor volumes of mice treated with IPI-926 (red) or vehicle (blue) plotted versus the mouse’s age in days. Two exceptional tumors noted in the text are highlighted in yellow. (G) Graph showing tumor volumes of mice treated with gemcitabine + IPI-926 (red) or gemcitabine + vehicle (blue) are plotted versus the mouse’s age in days. Lethal tumors that were undetectable by ultrasound were assigned a volume of 0 on the day of death. Animals still alive at the time of submission are denoted with open diamonds. See also Figure S3.
Figure 5
Figure 5. Long-term Smoothened inhibition yields poorly differentiated pancreatic tumors with increased proliferation and vascularity
(A–D) Representative histology (hematoxylin and eosin stain) of KPC tumors arising after long-term treatment with vehicle (A), IPI-926 (B), gemcitabine + vehicle (C), or gemcitabine + IPI-926 (D). (E and F) Quantification of the differentiation state for each cohort. The fraction of each tumor that was observed to be well-differentiated (W), moderately differentiated (M), poorly-differentiated (P), or undifferentiated (U), was scored in a blinded manner, and compared between the treatments. No tumor could be located in one IPI-926 + gemcitabine treated mouse (N). (G) Quantification of phospho-histone H3+ cells per 40X field in each treatment group (p=0.034 for monotherapy, p=0.011 for combination). Data are presented as standard box and whisker plots. (H) Quantification of CD31+ vessel structures by IHC in each treatment cohort (p=0.004 for monotherapy, p<0.0001 for combination). Data are presented as standard box and whisker plots. Two-tailed Mann-Whitney U was used for all unpaired tests. Scale bars = 50 μm. See also Figure S4.
Figure 6
Figure 6. Hh pathway activity is restricted to mesenchymally-derived stromal cells
(A) Quantification of co-immunofluorescence (Co-IF) for the Gli1GFP Hh reporter and markers of various tumor and stromal populations. (B) Co-IF for Gli1GFP (green) and E-Cadherin (red) in KPC-Gli1GFP tumors. (C) Co-IF for Gli1GFP (green) and alpha-smooth muscle actin (αSMA, red) in in KPC-Gli1GFP tumors. (D–E) Co-IF for Gli1GFP reporter on an untreated KPC-Gli1GFP tumor (D) or after 10 days of IPI-926 treatment (E). (F) Co-IF for Gli1GFP (green) and the endothelial marker endomucin (red) in KPC-Gli1GFP tumors. Scale bars = 10 μm. See also Figure S5.
Figure 7
Figure 7. VEGFR2 antagonism leads to selective inhibition of tumor growth in ShhPKCY mice
(A) Kaplan-Meier survival curve for tumor-bearing PKCY mice treated with bi-weekly DC101 (purple, n=10) or Ig control (blue, n=11). (B) Kaplan-Meier survival curve for tumor-bearing ShhPKCY mice treated with bi-weekly DC101 (purple, n=13) or Ig control (red, n=10). (C and D) H&E analysis of ShhPKCY tumors showing a large area of necrosis upon DC101 treatment (D). Scale bars = 250 μm. (E) Quantification of CD31+ vessel density in ShhPKCY mice treated with DC101 compared to Ig control, depicted as mean (± SD) number of CD31+ vessels per high powered field (n=3–5). (F) Quantification of YFP+ cells containing LC3+ autophagosomes in ShhPKCY mice treated with DC101 compared to Ig control, depicted as percentage (± SD) of YFP+ tumor cells exhibiting LC3 staining (n=3–5). (G) Quantification of YFP+ cells staining with the proliferation in ShhPKCY mice treated with DC101 compared to Ig control, depicted as percentage (± SD) of YFP+ tumor cells that were PCNA positive (n=3–5). (H and I) IHC for CD31 in differentiated (H) and undifferentiated (I) portions of human pancreas tumor A21. Scale bars = 200 μm. (J) Mean vascular density of normal pancreas (n=3), differentiated human PDAC (n=5) and undifferentiated human PDAC (n=8). Bars represent p-values by two-sided Student’s t-test. See also Figure S6.

Comment in

Similar articles

Cited by

References

    1. Bailey JM, Swanson BJ, Hamada T, Eggers JP, Singh PK, Caffery T, Ouellette MM, Hollingsworth MA. Sonic hedgehog promotes desmoplasia in pancreatic cancer. Clin Cancer Res. 2008;14:5995–6004. - PMC - PubMed
    1. Brownell I, Guevara E, Bai CB, Loomis CA, Joyner AL. Nerve-derived sonic hedgehog defines a niche for hair follicle stem cells capable of becoming epidermal stem cells. Cell stem cell. 2011;8:552–565. - PMC - PubMed
    1. Chu GC, Kimmelman AC, Hezel AF, DePinho RA. Stromal biology of pancreatic cancer. Journal of cellular biochemistry. 2007;101:887–907. - PubMed
    1. El-Zaatari M, Kao JY, Tessier A, Bai L, Hayes MM, Fontaine C, Eaton KA, Merchant JL. Gli1 deletion prevents Helicobacter-induced gastric metaplasia and expansion of myeloid cell subsets. PloS one. 2013;8:e58935. - PMC - PubMed
    1. Engels B, Rowley DA, Schreiber H. Targeting stroma to treat cancers. Semin Cancer Biol. 2012;22:41–49. - PMC - PubMed

Publication types

MeSH terms

Substances