. 2014 Jun 16;25(6):719-34.
doi: 10.1016/j.ccr.2014.04.005. Epub 2014 May 22.

Depletion of carcinoma-associated fibroblasts and fibrosis induces immunosuppression and accelerates pancreas cancer with reduced survival

Affiliations

Depletion of carcinoma-associated fibroblasts and fibrosis induces immunosuppression and accelerates pancreas cancer with reduced survival

Berna C Özdemir et al. Cancer Cell. .

Erratum in

  • Cancer Cell. 2015 Dec 14;28(6):831-3

Abstract

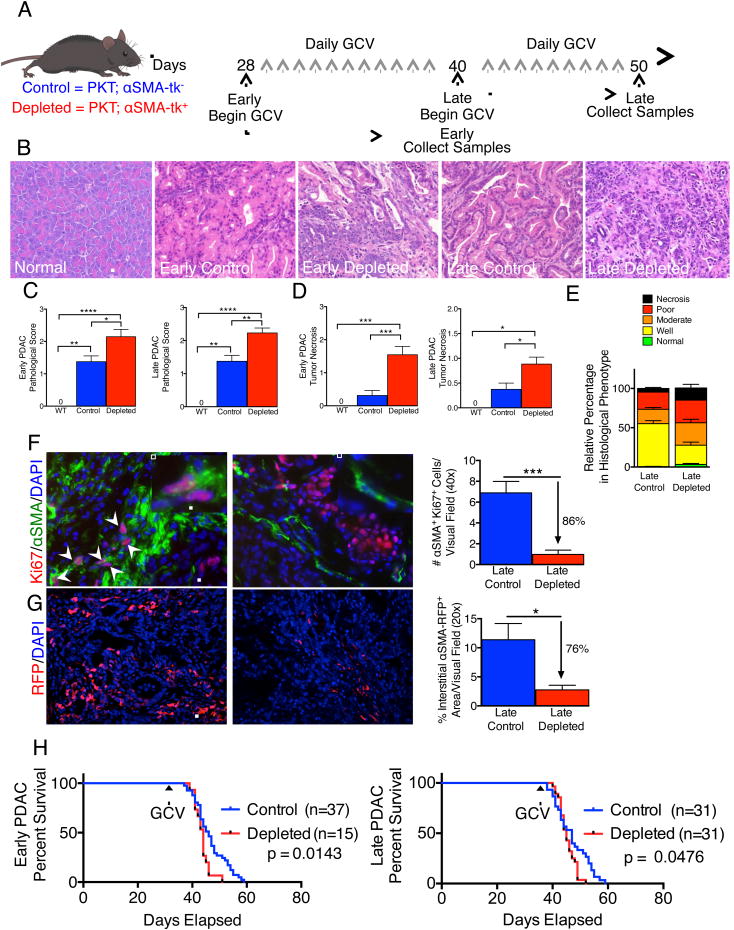
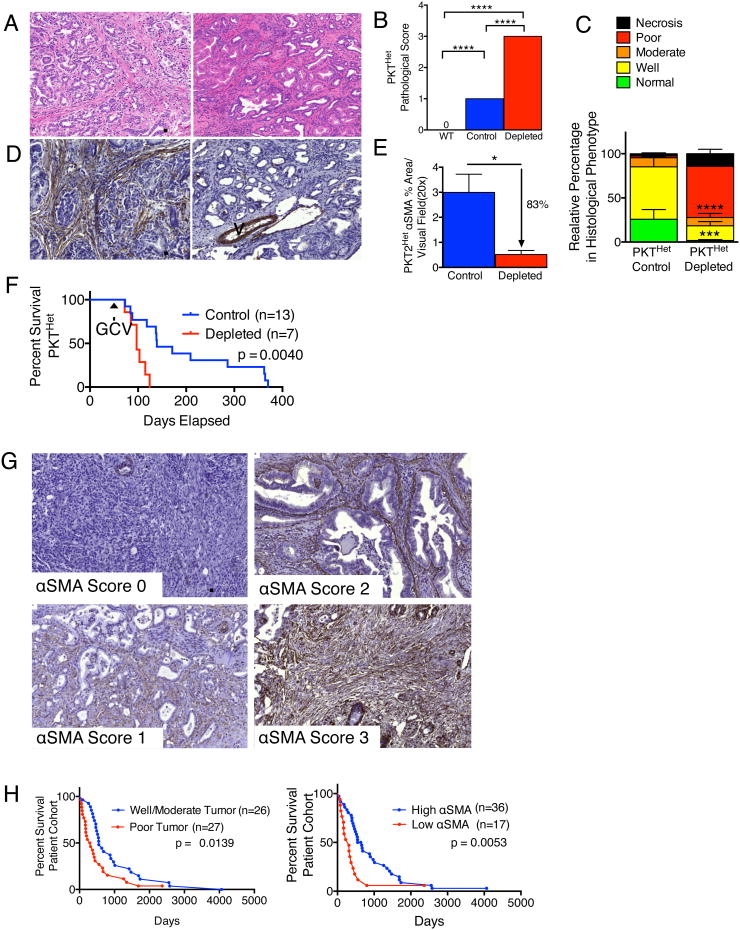
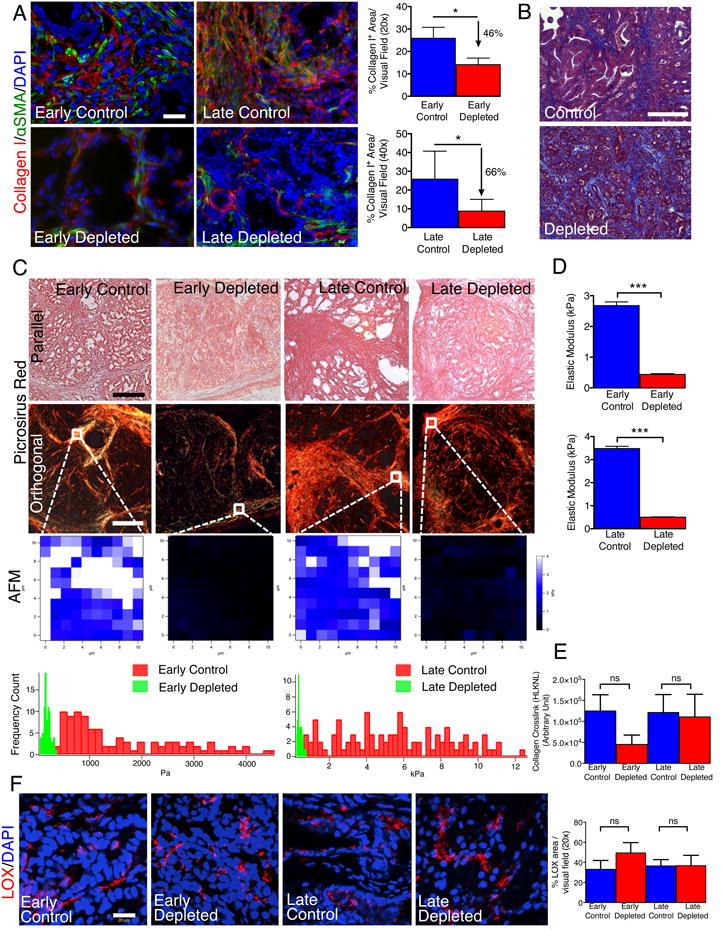
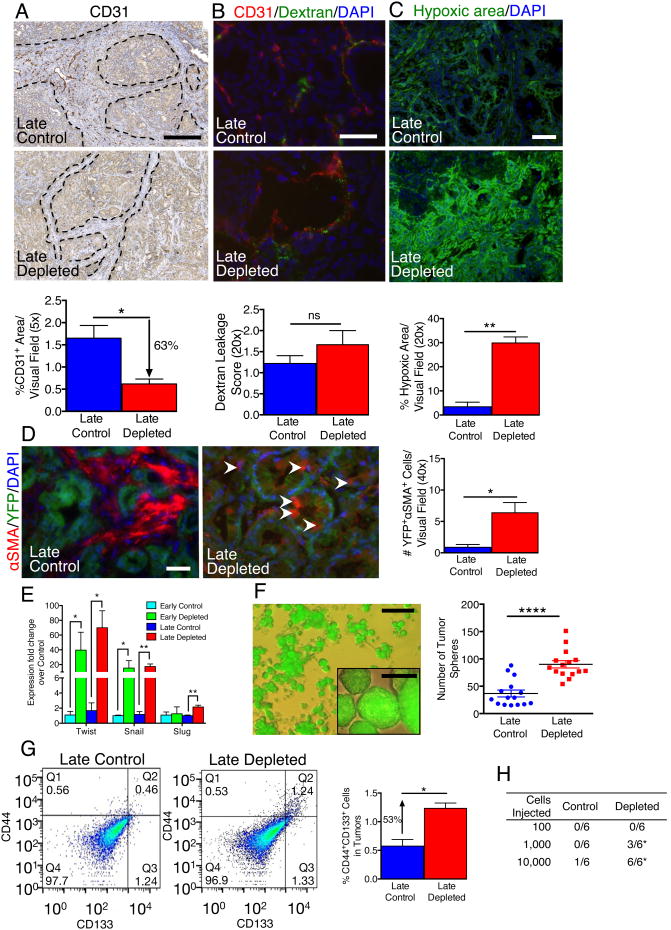
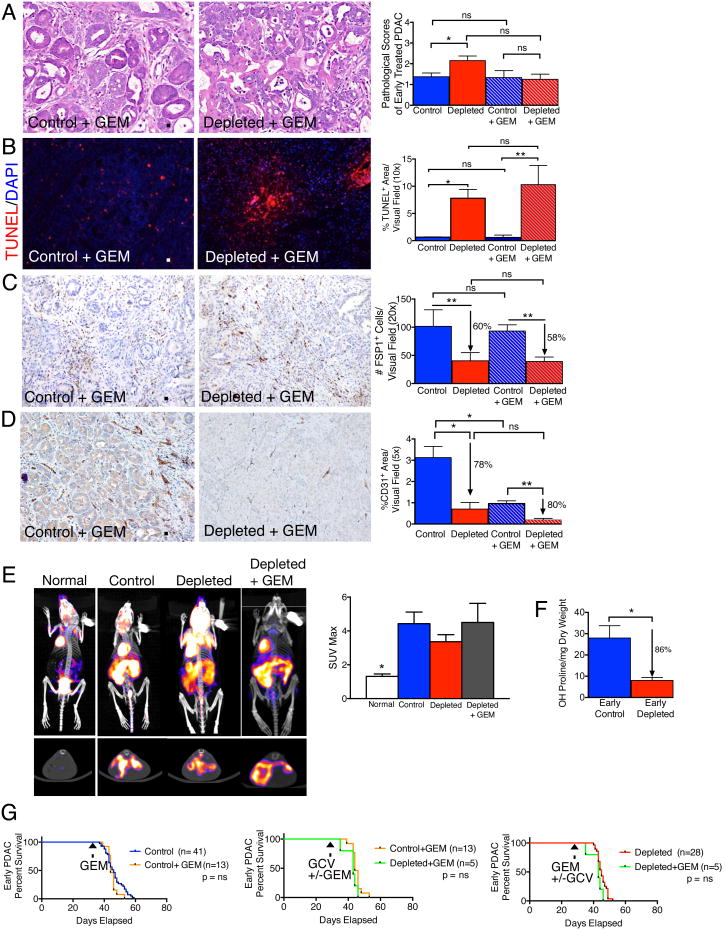
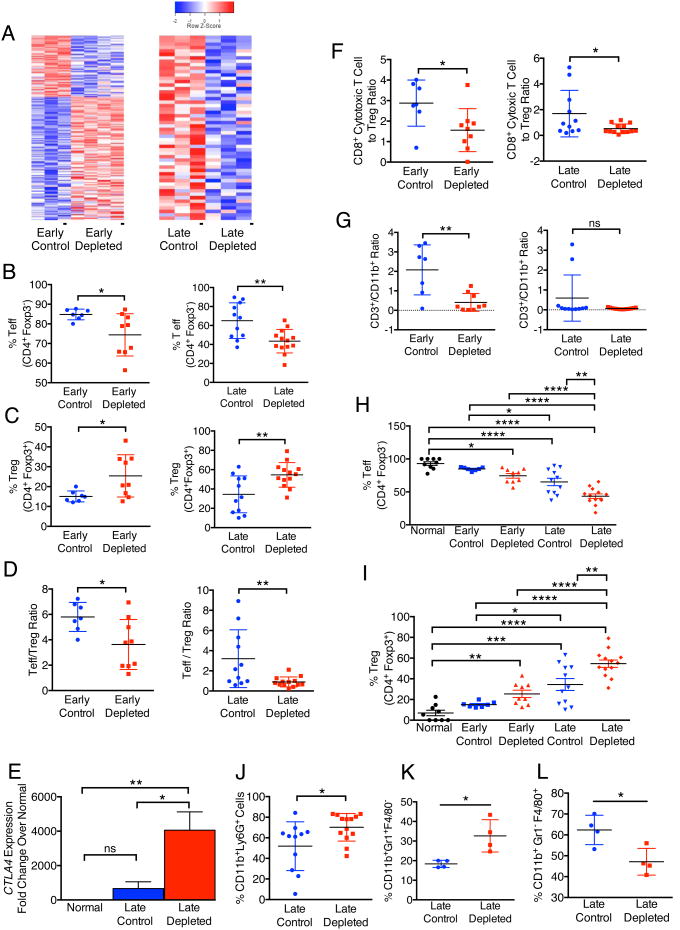
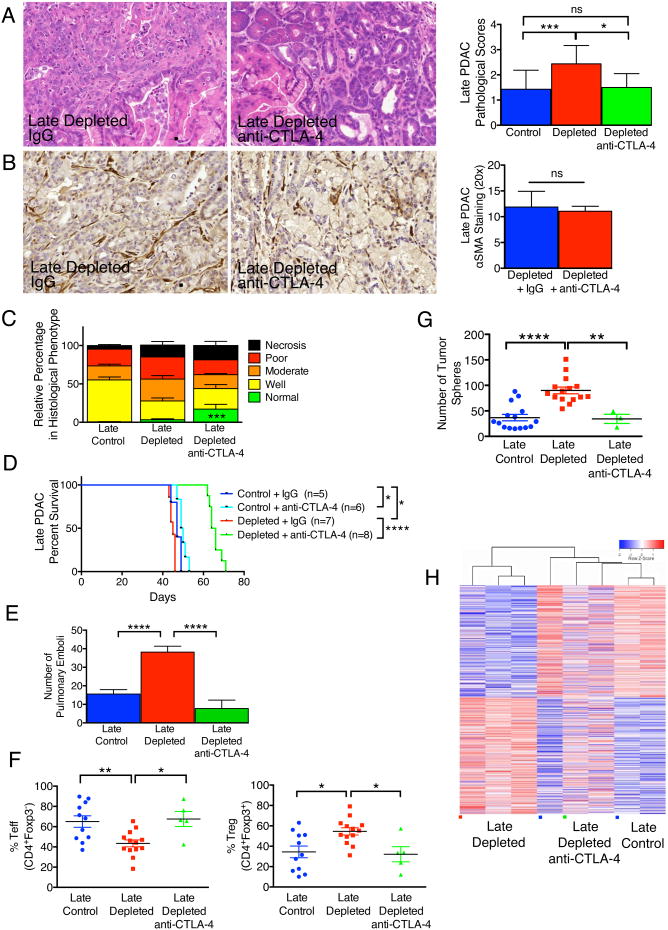
Pancreatic ductal adenocarcinoma (PDAC) is associated with marked fibrosis and stromal myofibroblasts, but their functional contribution remains unknown. Transgenic mice with the ability to delete αSMA(+) myofibroblasts in pancreatic cancer were generated. Depletion starting at either noninvasive precursor (pancreatic intraepithelial neoplasia) or the PDAC stage led to invasive, undifferentiated tumors with enhanced hypoxia, epithelial-to-mesenchymal transition, and cancer stem cells, with diminished animal survival. In PDAC patients, fewer myofibroblasts in their tumors also correlated with reduced survival. Suppressed immune surveillance with increased CD4(+)Foxp3(+) Tregs was observed in myofibroblast-depleted mouse tumors. Although myofibroblast-depleted tumors did not respond to gemcitabine, anti-CTLA4 immunotherapy reversed disease acceleration and prolonged animal survival. This study underscores the need for caution in targeting carcinoma-associated fibroblasts in PDAC.


Conflict of interest statement

Conflict of interest disclosure: Dr. James P. Allison is an Inventor of IP owned by the University of California, Berkeley, and licensed to Bristol Meyers-Squibb.

Figures

Figure 1
Figure 1. Myofibroblast depletion augments PDAC and diminishes overall survival
(A) Tumor progression timeline with experimental treatment time points. Ganciclovir (GCV) administration in PKT;αSMA-tk+ mice allows for myofibroblast depletion in contrast with control PKT;αSMA-tk- mice. (B) Representative micrographs of H&E stained pancreatic samples (scale bar: 100 μm). (C) Pathological scores of early depleted tumors (left. WT, n=5; Control, n=16; Depleted, n=17) and late depleted tumors (right. WT, n=5; Control n=17; Depleted, n=26). Significance was determined by One-way ANOVA with Turkey post-hoc analysis. (D) Necrosis penetrance of early depleted tumors (left. WT, n=5; Control, n=16; Depleted, n=22) and late depleted tumors (right. WT, n=5; Control, n=17; Depleted, n=25). (E) Relative percentage in histological phenotypes in late depleted tumors. Control, n=17; Depleted, n=25. (F) Representative micrographs (scale bar: 50 μm) of Ki-67/αSMA dual-immunofluorescence (left, control; right, depleted) and corresponding quantification (n=4 and 6 for control and depleted, respectively). Arrows point to double positive cells and inserts show high magnification images (scale bar: 25 μm). (G) Representative micrographs (scale bar: 100 μm) of reporter αSMA-RFP tumor samples (left, control; right, depleted) and corresponding quantification (n=3 in each group). (H) Survival analysis of early (left) and late (right) treatment groups. GCV: ganciclovir treatment was initiated. Data is represented as mean +/- SEM. Unless otherwise noted, significance was determine by t-test, * p<0.05, ** p<0.01, ** p< 0.001, ****p < 0.0001. ns: not significant. See also Figure S1.
Figure 2
Figure 2. Decreased αSMA correlates with poor prognosis and overall survival in slow-progressing mice with PDAC and patients with pancreatic cancer
(A, B) Representative micrographs of H&E stained PKTHet tumors at 106 (Control, left) and 103 (Depleted, right) days old (A, scale bar: 100 μm) and pathological scores (B). WT, n=5; Control, n=6; Depleted, n=4. Significance determine by One-way ANOVA with Turkey post-hoc analysis. (C) Relative percentage in histological phenotypes (n=6 and 4, respectively, for control and depleted). (D, E) Representative micrographs of αSMA stained pancreatic samples as in (A) (D, scale bar: 100 μm) and corresponding quantification (E). n=6 and 4, respectively, for control and depleted. V: vessel. (F) Survival analysis in PKTHet mice. GCV: ganciclovir treatment was initiated. (G) Representative micrographs of αSMA stained pancreatic samples resected from patients in each score category :0, 1, 2 and 3 (scale bar: 200 μm). (H) Survival analysis based on histopathological score (left) and αSMA score (right). Low αSMA: scores 0 and 1; high αSMA: scores 2 and 3. Significance determine by Mantel-Cox test. Data is represented as mean +/- SEM. Unless otherwise noted, significance was determine by t-test, * p<0.05, ** p<0.01, ** p< 0.001, ****p < 0.0001. ns: not significant. See also Figure S2 and Table S1.
Figure 3
Figure 3. PDAC extracellular matrix is significantly remodeled in myofibroblast-depleted tumors
(A) Representative micrographs (scale bar: 50 μm) of Collagen I and αSMA and corresponding quantification (n=4). (B) Representative micrographs (scale bar: 200 μm) of Masson Trichrome staining in late control and late deleted mice. (C) Representative images of Picrosirius Red staining of PKT pancreatic tissues samples viewed under parallel (top row) and polarized light (second row) (scale bar: 75 μm), and representative images of stiffness distribution by atomic force microscopy measurement (AFM, third row) and quantification (bottom row, n=3). (D) Quantification of the elastic modulus of tumors matrix (n=3). (E) Collagen crosslinking quantification (n=4). (F) Representative micrographs for LOX (scale bar: 20 μm) and quantification. Data is represented as mean +/- SEM. Significance was determined by t-test, * p<0.05, ** p<0.01, ** p< 0.001, ****p < 0.0001. ns: not significant. See also Figure S3 and Table S2.
Figure 4
Figure 4. Myofibroblast-depleted tumors display increased invasion associated with intra-tumoral hypoxia
(A) Representative micrographs (scale bar: 100 μm) of CD31 staining and corresponding quantification (n=4). Dashed lines delineate the stromal compartment where CD31+ vessels are primarily found. (B) Representative micrographs (scale bar: 100 μm) and corresponding quantification (n=4) of CD31 cells and intra-tumoral FITC-Dextran leakage. (C) Representative micrographs (scale bar: 100 μm) of hypoxia indicator, Hypoxyprobe™, and corresponding quantification (n=4). (D) Representative micrographs (scale bar: 50 μm) of αSMA+ cells in tumors with YFP+ linage tagged cancer cells and corresponding quantification (n=4). White arrowheads point to αSMA+YFP+ cells. (E) Relative Twist, Snail and Slug expression in tumors. (F) Representative micrograph (scale bar: 100 μm) of YFP+ tumor spheres (insert shows higher magnification micrograph, scale bar: 25 μm) and corresponding quantification (n=15). (G) Representative scatter plot and quantification of percent CD44+CD133+ cancer cells (Control: n=2, Depleted: n=3). Q1: CD44+CD133-; Q2: CD44+CD133+; Q3: CD44-CD133+; Q4: CD44-CD133-. (H) Tumorigenic ability of YFP+ cells determined by limiting dilution assay. For each cell dose, 6 mice were injected with YFP+ cancer cells from control or myofibroblast depleted tumors and data is presented as the number of mice displaying tumors. Significance was assayed by Χ2 test. Data is represented as mean +/- SEM. Unless otherwise noted, significance was determine by t-test, * p<0.05, ** p<0.01, ** p< 0.001, ****p < 0.0001. ns: not significant. See also Figure S4 and Table S3.
Figure 5
Figure 5. Gemcitabine treatment does not improve survival of mice with myofibroblast-depleted tumors
(A) Representative micrographs of H&E stained pancreatic samples (scale bar: 100 μm) and pathological scores of indicated experimental groups. Control, n= 16; Depleted, n=17; GEM, n=8 and GEM Depleted, n=8. (B) Representative micrographs (scale bar: 200 μm) of the apoptosis marker TUNEL and corresponding quantification (n=3 in each group). (C) Representative micrographs (scale bar: 100 μm) of FSP1 IHC and corresponding quantification (n=4 in each group). (D) Representative micrographs (scale bar: 100 μm) of CD31 IHC and corresponding quantification (n=3 in each group). (E) Representative 18F-FDG PET/CT scan (top, frontal section; bottom, sagittal section) and associated max standard update value (SUVmax) (n=3 in each group). (F) Hydoxyproline release reflecting collagen content in control and myofibroblast-depleted tumors (n=4 in each group). Significance was determined by t-test. (G). Survival analyses of indicated experimental groups. Data is represented as mean +/- SEM. Unless otherwise noted, significance was determined by One-way ANOVA with Turkey post-hoc analysis, * p<0.05, ** p<0.01, ** p< 0.001, ****p < 0.0001. ns: not significant.
Figure 6
Figure 6. Myofibroblast depletion results in increased frequency of FoxP3+ Treg cells in PDAC
(A) Heat map of differentially regulated genes pertaining to tumor immunity in early and late treated tumors. (B-D) Percent Teff (B), Treg (C) and Teff/Treg ratio (D) in early and late treated tumors. (E) Relative Ctla4 expression in late treated tumors (n=6). (F-G) CD8+ cytotoxic T cell/Treg ratio (F) and CD3/CD11b ratio (G) in early and late treated tumors. (H, I) Percent Teff (H) and Treg (I) in normal pancreas and in early and late treated tumors. (J-L) Percent CD11b+Ly6G+ (J), CD11b+Gr1+F4/80- (K) and CD11b+Gr1-F4/80+ (L) cells in late treated tumors. Data is represented as mean +/- SEM. Significance was determine by t-test except for multiple groups comparison, in which significance was determined by One-way ANOVA with Turkey post-hoc analysis, * p<0.05, ** p<0.01, ** p< 0.001, ****p < 0.0001. ns: not significant. See also Figure S5.
Figure 7
Figure 7. Anti-CTLA-4 attenuates PDAC and improves survival in mice with myofibroblast-depleted tumors
(A) Representative micrographs of H&E stained tumors (scale bar: 100 μm) and pathological scores of tumors in indicated experimental groups. Control, n=14; Depleted, n=16; Depleted + anti-CTLA-4, n=6. Significance was determined by One-way ANOVA with Turkey post-hoc analysis. (B) Representative micrographs of αSMA stained pancreatic samples (scale bar: 100 μm) and corresponding quantification. Depleted, n=5; Depleted + anti-CTLA-4, n=7. (C) Relative percent of tissue encompassed by each histology hallmark. Control, n=15; Depleted, n=16; Depleted + anti-CTLA-4, n=6. Significance was determined by One-way ANOVA with Turkey post-hoc analysis. (D) Survival analysis of the indicated experimental groups. (E) Number of pulmonary emboli. Control, n=14; Depleted, n=28; Depleted + anti-CTLA-4, n=8. (F) Percent Teff (left) and Treg (right) cells in tumors of indicated experimental groups. (G) Number of spheres formed from tumors of indicated experimental groups. (H) Heat map of differentially expressed genes in the indicated groups. Data is represented as mean +/- SEM. Unless otherwise noted, significance was determine by t-test, * p<0.05, ** p<0.01, ** p< 0.001, ****p < 0.0001. ns: not significant. See also Figure S6.

Comment in

Similar articles

Cited by

References

    1. Aguirre AJ, Bardeesy N, Sinha M, Lopez L, Tuveson DA, Horner J, Redston MS, DePinho RA. Activated Kras and Ink4a/Arf deficiency cooperate to produce metastatic pancreatic ductal adenocarcinoma. Genes & development. 2003;17:3112–3126. - PMC - PubMed
    1. Amakye D, Jagani Z, Dorsch M. Unraveling the therapeutic potential of the Hedgehog pathway in cancer. Nature medicine. 2013;19:1410–1422. - PubMed
    1. Angeli F, Koumakis G, Chen MC, Kumar S, Delinassios JG. Role of stromal fibroblasts in cancer: promoting or impeding? Tumour biology : the journal of the International Society for Oncodevelopmental Biology and Medicine. 2009;30:109–120. - PubMed
    1. Armstrong T, Packham G, Murphy LB, Bateman AC, Conti JA, Fine DR, Johnson CD, Benyon RC, Iredale JP. Type I collagen promotes the malignant phenotype of pancreatic ductal adenocarcinoma. Clinical cancer research : an official journal of the American Association for Cancer Research. 2004;10:7427–7437. - PubMed
    1. Bardeesy N, Aguirre AJ, Chu GC, Cheng KH, Lopez LV, Hezel AF, Feng B, Brennan C, Weissleder R, Mahmood U, et al. Both p16(Ink4a) and the p19(Arf)-p53 pathway constrain progression of pancreatic adenocarcinoma in the mouse. Proceedings of the National Academy of Sciences of the United States of America. 2006a;103:5947–5952. - PMC - PubMed

Publication types