. 2014 Jun 19;21(6):732-42.
doi: 10.1016/j.chembiol.2014.03.014. Epub 2014 May 22.

Direct observations of amyloid β self-assembly in live cells provide insights into differences in the kinetics of Aβ(1-40) and Aβ(1-42) aggregation

Affiliations

Direct observations of amyloid β self-assembly in live cells provide insights into differences in the kinetics of Aβ(1-40) and Aβ(1-42) aggregation

Elin K Esbjörner et al. Chem Biol. .

Abstract

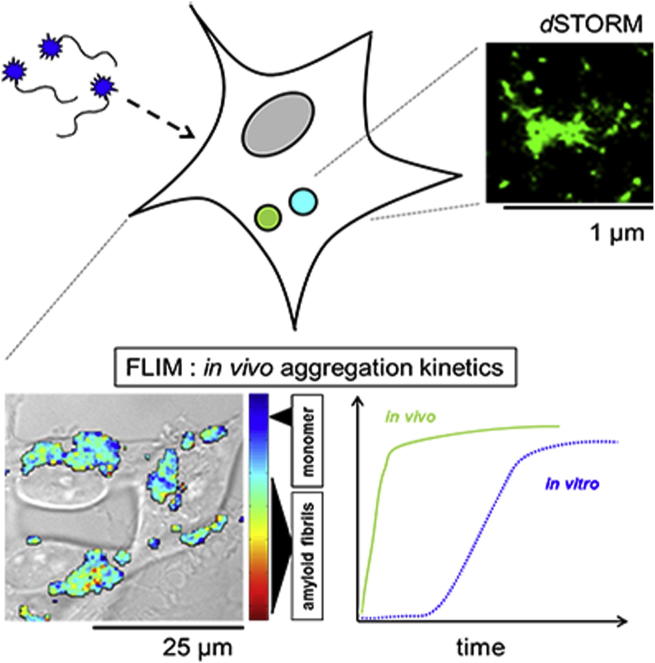
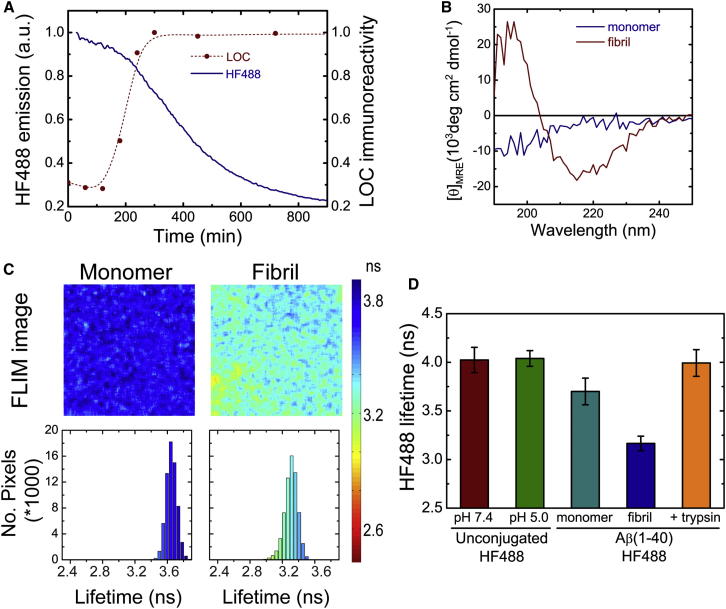
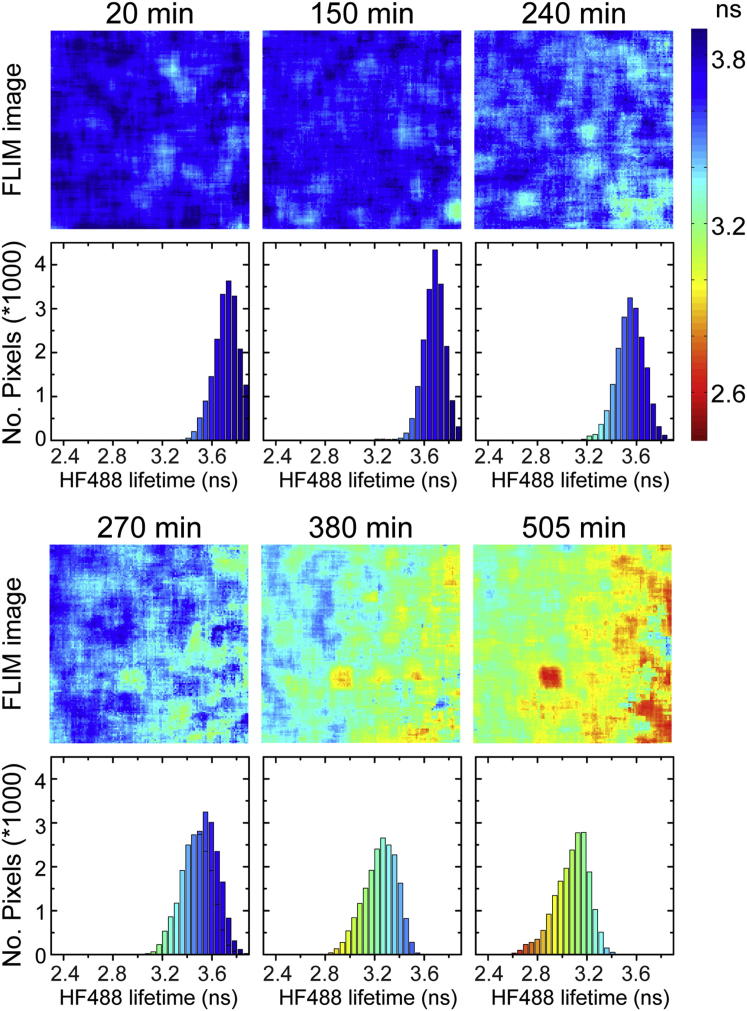
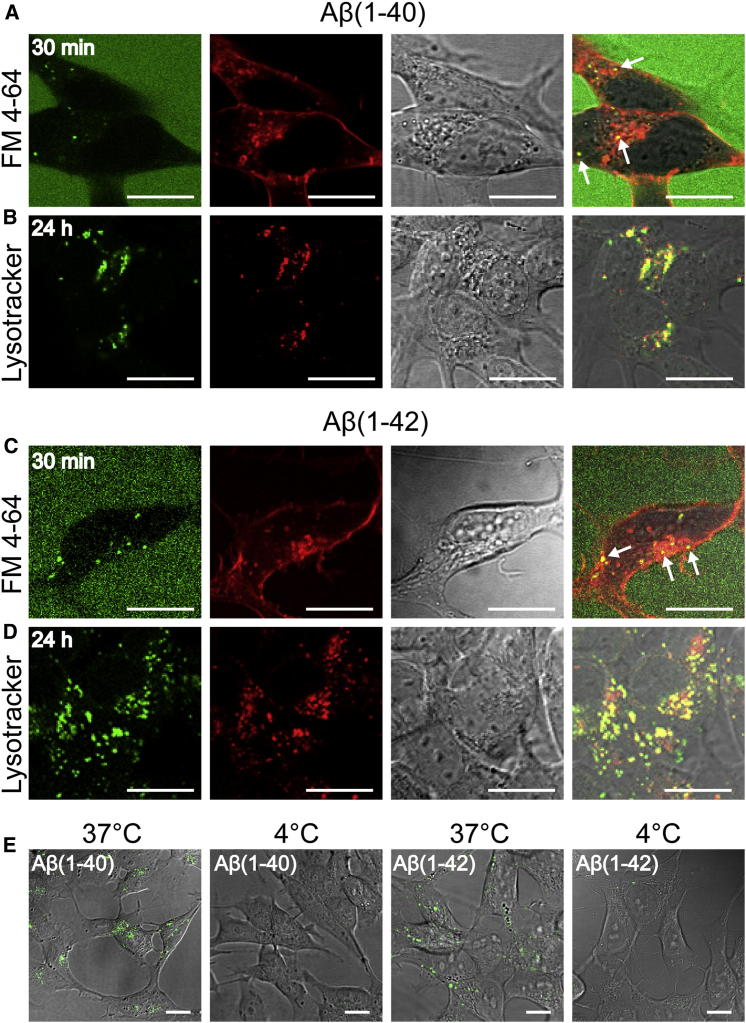
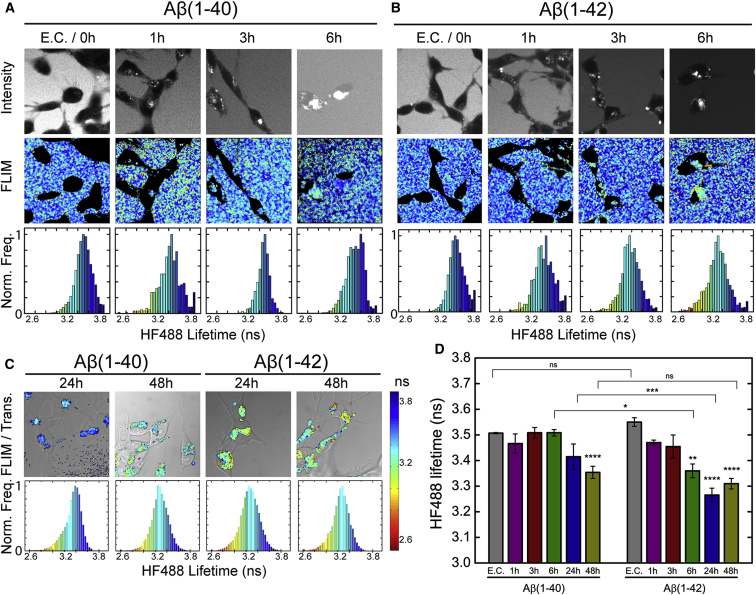
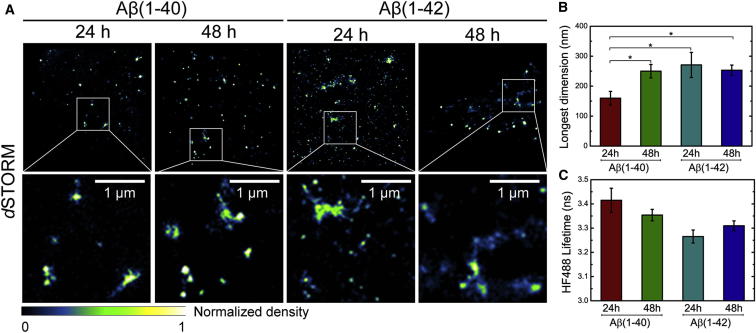
Insight into how amyloid β (Aβ) aggregation occurs in vivo is vital for understanding the molecular pathways that underlie Alzheimer's disease and requires new techniques that provide detailed kinetic and mechanistic information. Using noninvasive fluorescence lifetime recordings, we imaged the formation of Aβ(1-40) and Aβ(1-42) aggregates in live cells. For both peptides, the cellular uptake via endocytosis is rapid and spontaneous. They are then retained in lysosomes, where their accumulation leads to aggregation. The kinetics of Aβ(1-42) aggregation are considerably faster than those of Aβ(1-40) and, unlike those of the latter peptide, show no detectable lag phase. We used superresolution fluorescence imaging to examine the resulting aggregates and could observe compact amyloid structures, likely because of spatial confinement within cellular compartments. Taken together, these findings provide clues as to how Aβ aggregation may occur within neurons.


Figures

None
Graphical abstract
Figure 1
Figure 1
Amyloid Fibril Formation and Fluorescence Lifetimes of the HF488-Labeled Aβ Peptides In Vitro (A) Amyloid formation by HF488Aβ(1–42) (5 μM in 50 mM sodium phosphate buffer [pH 7.4]) as a function of time. The quantity of amyloid fibrils was monitored by immunochemistry using the conformation-specific antibody LOC (red circles and dashed line) to detect fibrillar species. The normalized fibril quantity (relative to the maximum value) is given on the right axis in the graph. The amyloid formation was also monitored by the decrease in fluorescence emission intensity of the HF488 dye (blue). a.u., arbitrary units. See also Figure S1A. (B) Far UV circular dichroism spectra of monomeric and fibrillar Aβ(1–42). (C) Fluorescence lifetime images of solutions of monomeric and fibrillar HF488Aβ(1–42). The lifetime color coding is shown in the bar to the right of the images. The frequency histograms show the per-pixel distribution of HF488 fluorescence lifetimes in each of the images. (D) Mean fluorescence lifetime (± SD) of the unconjugated HF488 dye at different pH values and for monomeric, fibrillar, and trypsin-treated monomeric HF488Aβ(1–40).
Figure 2
Figure 2
Kinetics of HF488Aβ(1–40) Fibril Formation Monitored by Fluorescence Lifetime Imaging Fluorescence lifetime images and corresponding frequency histograms showing the evolution of the HF488 fluorescence lifetime in a defined volume of a droplet sample of HF488Aβ(1–40) deposited onto a glass-bottomed culture dish and mounted on the FLIM microscope. The color coding of images and histograms relate to the color bar on the right. The HF488Aβ(1–40) concentration was 5 μM, and the peptide was diluted into 50 mM sodium phosphate buffer (pH 7.4). See also Figure S2.
Figure 3
Figure 3
Confocal Fluorescence Microscopy Images Showing the Uptake and Intracellular Localization of HF488Aβ(1–40) and HF488Aβ(1–42) in SH-SY5Y Cells (A and C) Uptake of (A) HF488Aβ(1–40) and (C) HF488Aβ(1–42) (green) and the endocytosis marker FM 4–64 (red) after 30 min of incubation. The white arrows in the overlay panels indicate colocalization in intracellular vesicles. Note that the peptides do not accumulate at the plasma membrane. (B and D) Colocalization of (B) HF488Aβ(1–40) and (D) HF488Aβ(1–42) (green) with LysoTracker red (red) after 24 hr of incubation with 500 nM peptide followed by 1 hr of incubation with 100 nM LysoTracker red. (E) Uptake of HF488Aβ(1–40) and HF488Aβ(1–42) upon incubation at 37°C (allowing endocytotic internalization) and 4°C (inhibiting endocytotic internalization). The images show the overlay of HF488 fluorescence (green) and the transmitted image. All scale bars represent 10 μm. See also Figure S3.
Figure 4
Figure 4
Fluorescence Lifetime Imaging of the Uptake and Accumulation of HF488Aβ(1–40) and HF488Aβ(1–42) in Live SH-SY5Y Cells (A and B) Cells treated with (A) 500 nM HF488Aβ(1–40) or (B) 500 nM HF488Aβ(1–42) for 0–6 hr. The upper panels show fluorescence intensity, the center panels show HF488 fluorescence lifetimes, and the lower panels show the normalized per-pixel HF488 fluorescence lifetime frequency (Norm. Freq.) in the corresponding image above. The histograms at the 0 hr time point show the HF488 fluorescence lifetime distribution of the extracellular peptides (E.C.). Subsequent histograms (1, 3, and 6 h) show the HF488 fluorescence lifetime distributions of the intracellular peptides only. See the color bar in (C) for the color coding of FLIM images and frequency histograms. (C) Cells treated with 500 nM HF488Aβ(1–40) or 500 nM HF488Aβ(1–42) for 24 or 48 hr. The cells were washed once prior to imaging. The images show an overlay of the color-coded FLIM image and the transmitted image. The HF488 fluorescence lifetime frequency histograms show the distribution over several analyzed images (n = 6–9). Trans., transmission. (D) Mean HF488 fluorescence lifetime (± SEM) of extracellular and intracellular HF488Aβ(1–40) and HF488Aβ(1–42). At 0 hr, the bars represent the mean HF488 fluorescence lifetime (± SEM) of the extracellular peptide (E.C.). The subsequent bars show the mean HF488 fluorescence lifetime (± SEM) of the intracellular peptides at the indicated time points after addition of 500 nM HF488Aβ(1–40) or 500 nM HF488Aβ(1–42) to the culture medium. Asterisks () over bars indicate a significant difference compared to 0 h (E.C.), and lines over bars indicate a significant difference between the two peptides at the specified time points according to Fisher’s least significant difference test (p < 0.05). p < 0.05; ∗∗p < 0.01; ∗∗∗p < 0.001; ∗∗∗∗p < 0.0001. Individual p values are given in Tables S1 and S2.
Figure 5
Figure 5
Super-Resolution Fluorescence Microscopy Imaging of Intracellular Aβ(1–40) and Aβ(1–42) (A) dSTORM images of intracellular HF647Aβ(1–40) and HF647Aβ(1–42) in fixed SH-SY5Y cells. The cells were imaged after 24 and 48 hr of incubation. Scale bars represent 1 μm. (B) Mean size of the intracellular aggregates (± SEM) estimated by pixel counting in dSTORM images. The lines above the bars indicate statistically significant mean differences (paired Student’s t test; p < 0.05; n = 18–27). Only aggregates with dimensions exceeding the resolution limit were included in the analysis. (C) Mean fluorescence lifetime (± SEM) of intracellular HF488Aβ(1–40) and HF488Aβ(1–42) at the time points corresponding to the dSTORM images. The data were extracted from Figure 4D.

Comment in

References

    1. Billings L.M., Oddo S., Green K.N., McGaugh J.L., LaFerla F.M. Intraneuronal Aβ causes the onset of early Alzheimer’s disease-related cognitive deficits in transgenic mice. Neuron. 2005;45:675–688. - PubMed
    1. Burdick D., Soreghan B., Kwon M., Kosmoski J., Knauer M., Henschen A., Yates J., Cotman C., Glabe C. Assembly and aggregation properties of synthetic Alzheimer’s A4/β amyloid peptide analogs. J. Biol. Chem. 1992;267:546–554. - PubMed
    1. Burdick D., Kosmoski J., Knauer M.F., Glabe C.G. Preferential adsorption, internalization and resistance to degradation of the major isoform of the Alzheimer’s amyloid peptide, A β 1-42, in differentiated PC12 cells. Brain Res. 1997;746:275–284. - PubMed
    1. Campioni S., Mannini B., Zampagni M., Pensalfini A., Parrini C., Evangelisti E., Relini A., Stefani M., Dobson C.M., Cecchi C., Chiti F. A causative link between the structure of aberrant protein oligomers and their toxicity. Nat. Chem. Biol. 2010;6:140–147. - PubMed
    1. Capetillo-Zarate E., Gracia L., Yu F., Banfelder J.R., Lin M.T., Tampellini D., Gouras G.K. High-resolution 3D reconstruction reveals intra-synaptic amyloid fibrils. Am. J. Pathol. 2011;179:2551–2558. - PMC - PubMed

Publication types

LinkOut - more resources