. 2014 Jul 1;20(1):41-53.
doi: 10.1016/j.cmet.2014.03.031. Epub 2014 May 22.

Estradiol regulates brown adipose tissue thermogenesis via hypothalamic AMPK

Affiliations

Estradiol regulates brown adipose tissue thermogenesis via hypothalamic AMPK

Pablo B Martínez de Morentin et al. Cell Metab. .

Abstract

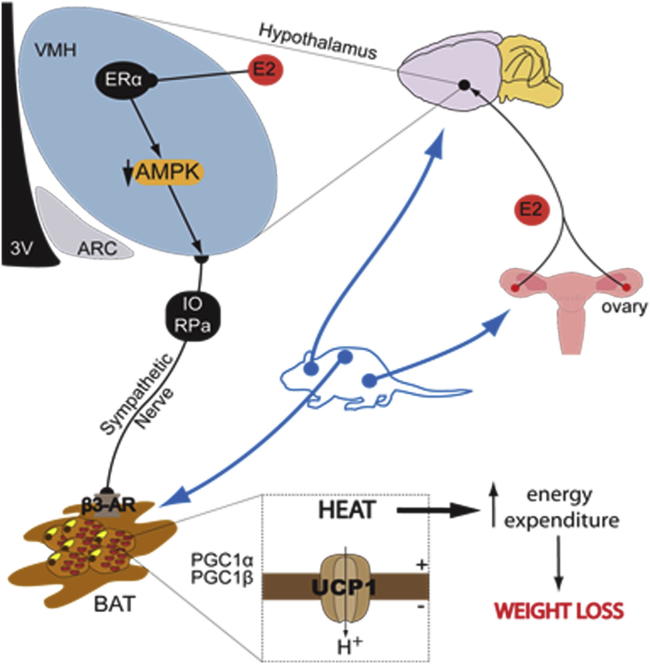
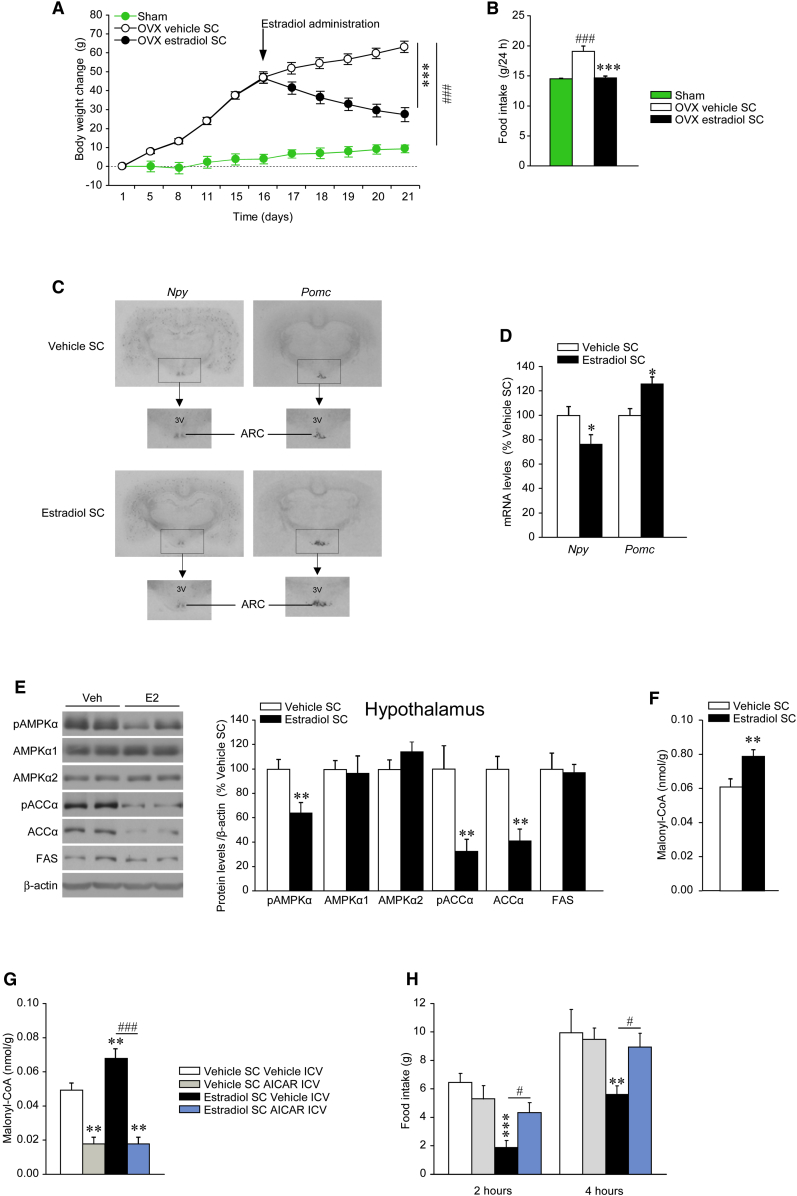
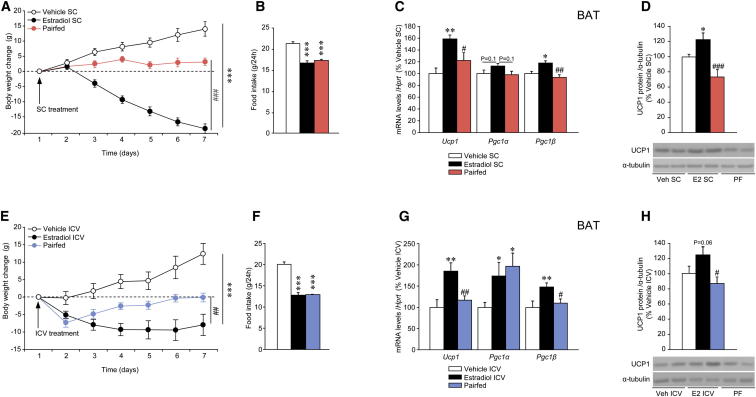
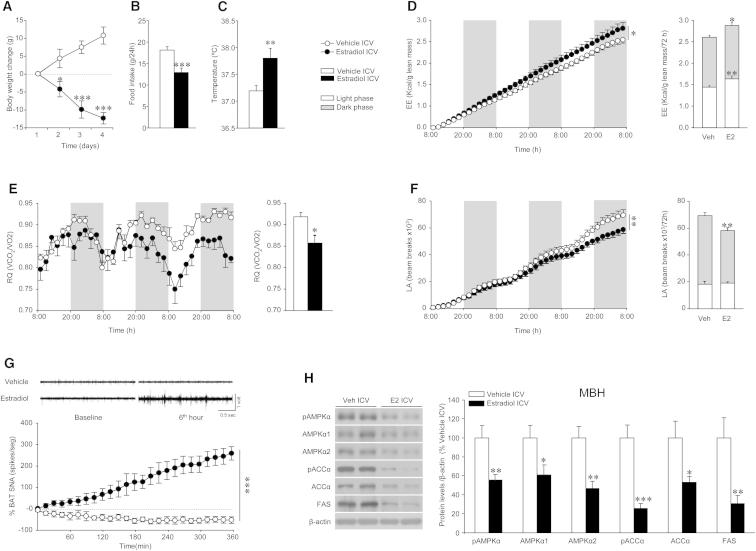
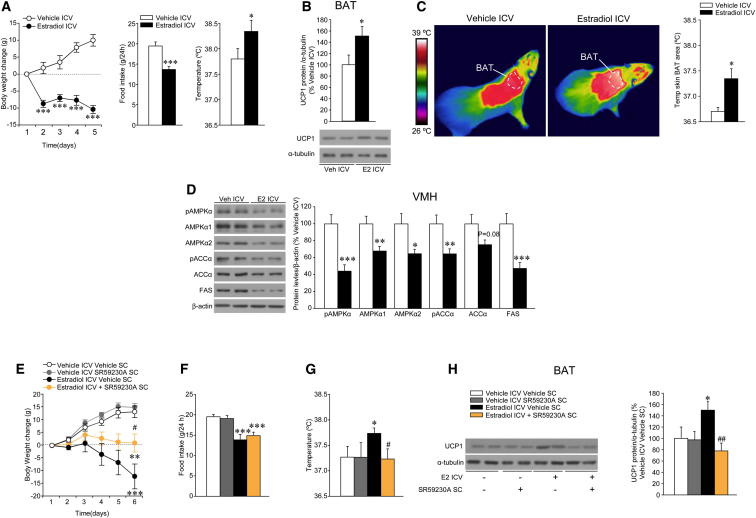
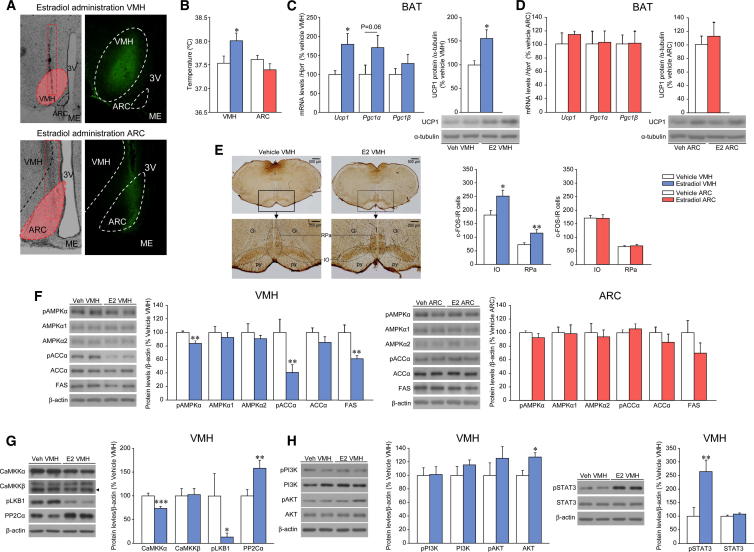
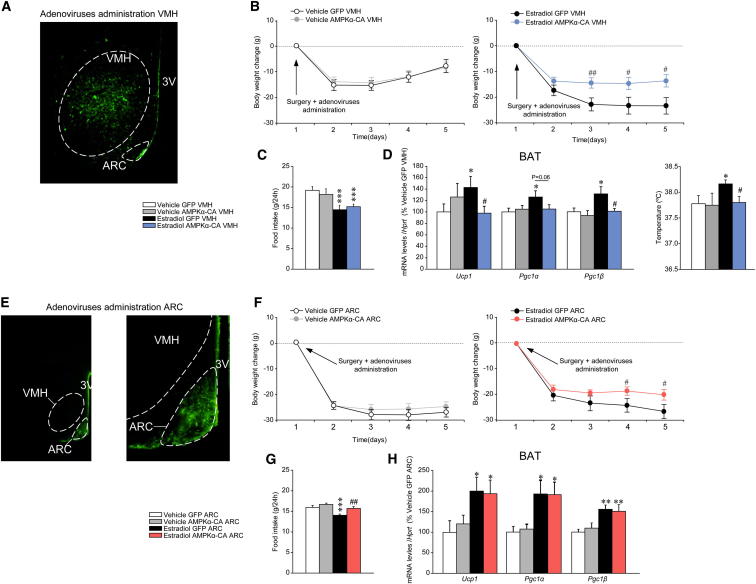
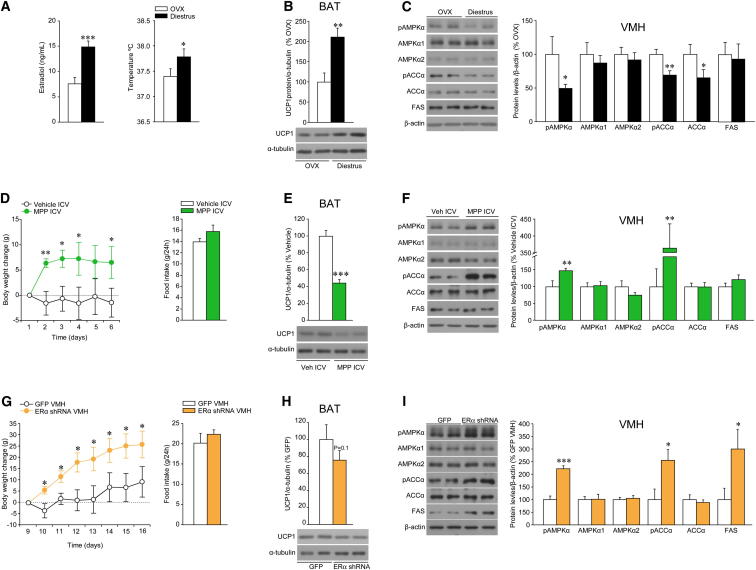
Estrogens play a major role in the modulation of energy balance through central and peripheral actions. Here, we demonstrate that central action of estradiol (E2) inhibits AMP-activated protein kinase (AMPK) through estrogen receptor alpha (ERα) selectively in the ventromedial nucleus of the hypothalamus (VMH), leading to activation of thermogenesis in brown adipose tissue (BAT) through the sympathetic nervous system (SNS) in a feeding-independent manner. Genetic activation of AMPK in the VMH prevented E2-induced increase in BAT-mediated thermogenesis and weight loss. Notably, fluctuations in E2 levels during estrous cycle also modulate this integrated physiological network. Together, these findings demonstrate that E2 regulation of the VMH AMPK-SNS-BAT axis is an important determinant of energy balance and suggest that dysregulation in this axis may account for the common changes in energy homeostasis and obesity linked to dysfunction of the female gonadal axis.


Figures

None
Graphical abstract
Figure 1
Figure 1
Effect of SC E2 on Energy Balance (A–F) (A) Body weight change, (B) daily food intake, (C) in situ hybridization autoradiographic images, (D) Npy and Pomc mRNA levels in the ARC, (E) western blot autoradiographic images (left panel) and hypothalamic levels of proteins of AMPK pathway (right panel), and (F) hypothalamic malonyl-CoA levels of OVX rats and OVX rats SC treated with vehicle or E2. (G and H) (G) Hypothalamic malonyl-CoA levels and (H) food intake of OVX rats SC treated with vehicle or E2 and ICV treated with vehicle or AICAR. Error bars represent SEM; n = 8–16 animals per experimental group. 3V: third ventricle; , ∗∗ and ∗∗∗p < 0.05, 0.01, and 0.001 vs. OVX E2 SC or vehicle SC vehicle ICV; #p < 0.05 E2 SC vehicle ICV versus E2 SC AICAR ICV; ###p < 0.001 versus sham or E2 SC vehicle ICV versus E2 SC AICAR ICV.
Figure 2
Figure 2
Effect of SC and ICV E2 on BAT Thermogenic Markers (A–D) (A) Body weight change, (B) daily food intake, (C) mRNA expression profile in the BAT, and (D) protein levels (upper panel) and western blot autoradiographic images of BAT UCP1 protein (lower panel) of OVX rats treated with vehicle or E2 SC and pair-fed (PF) rats. (E–H) (E) Body weight change, (F) daily food intake, (G) mRNA expression profile in the BAT, and (H) protein levels (upper panel) and western blot autoradiographic images of BAT UCP1 protein (lower panel) of OVX rats treated with vehicle or E2 ICV (5 nmol) and pair-fed rats. Error bars represent SEM; n = 8–20 animals per experimental group. , ∗∗, and ∗∗∗p < 0.05, 0.01, and 0.001 versus vehicle (SC or ICV); #, ##, and ###p < 0.05, 0.01, and 0.001 versus E2 (SC or ICV).
Figure 3
Figure 3
Effect of ICV E2 on Energy Balance, BAT Activation, and Hypothalamic AMPK Pathway (A–H) (A) Body weight change, (B) daily food intake, (C) core temperature, (D) energy expenditure (EE) (cumulative in left panel and total in right panel), (E) respiratory quotient (RQ) (cumulative in left panel and total in right panel), (F) locomotor activity (LA) (cumulative in left panel and total in right panel), (G) BAT sympathetic nervous activity (SNA) tracings (upper panel) and time-course of BAT SNA response (lower panel), and (H) western blot autoradiographic images (left panel) and hypothalamic protein levels of proteins of the AMPK pathway (right panel) of OVX rats ICV treated with vehicle or E2 (5 nmol). Error bars represent SEM; n = 6 (SNA recordings) or 8–12 animals per experimental group. , ∗∗, and ∗∗∗p < 0.05, 0.01, and 0.001 vs. vehicle ICV.
Figure 4
Figure 4
Effect of ICV E2 on Energy Balance and the VMH AMPK-SNS-BAT Axis (A–D) (A) Body weight change (left panel), daily food intake (middle panel), and core temperature (right panel); (B) protein levels (upper panel) and western blot autoradiographic images of BAT UCP1 protein (lower panel); (C) infrared thermal images (left panel) and quantification of temperature of the skin surrounding interscapular BAT (right panel); and (D) western blot autoradiographic images (left panel) and VMH protein levels of proteins of the AMPK pathway (right panel) of OVX rats ICV treated with vehicle or E2 (1 nmol). (E–H) (E) Body weight change, (F) daily food intake, (G) core temperature, and (H) western blot autoradiographic images of BAT UCP1 protein (left panel) and UCP1 protein levels (right panel) of OVX rats ICV treated with vehicle or E2 (1 nmol), previously SC treated with the β3-AR-antagonist SR59230A for 2 days. Error bars represent SEM; n = 7–12 animals per experimental group. and ∗∗∗p < 0.05 and 0.001 versus vehicle ICV or vehicle ICV vehicle SC; # and ##p < 0.05 and 0.01 versus E2 ICV vehicle SC.
Figure 5
Figure 5
Effect of E2 within the VMH or ARC on BAT Thermogenic Markers, Central SNS Outflow, and Hypothalamic AMPK Pathway (A) Representative photomicrographs of brain sections showing the injection route enclosed in a red rectangle, precisely placed in the VMH or ARC (10×, left panel), and immunofluorescence of brain sections (20×) showing the presence of the dye (FITC) after comicroinjection with E2 within the VMH or the ARC. (B and C) (B) Core temperature and (C) mRNA expression profile in the BAT (left panel), protein levels (right-upper panel), and western blot autoradiographic images of BAT UCP1 (right-lower panel) of OVX rats stereotaxically treated with vehicle or E2 within the VMH. (D) mRNA expression profile in the BAT (left panel), protein levels (right-upper panel), and western blot autoradiographic images of BAT UCP1 (right-lower panel) of rats stereotaxically treated with vehicle or E2 within the ARC. (E) Representative photomicrographs (upper: 1.25×, lower 10×) showing immunohistochemistry of c-FOS (left panel) and c-FOS immunoreactive (IR) (right panel) cells in the inferior olive (IO) and the raphe pallidus (RPa) nuclei of OVX rats stereotaxically treated with vehicle or E2 within the VMH or ARC. (F) Western blot autoradiographic images (left panels) and levels of proteins of the AMPK pathway (right panels) in the VMH or ARC of OVX rats stereotaxically treated with vehicle or E2 within the VMH (left images and graph) and the ARC (right images and graph); thus, when injection of E2 was performed in the VMH, the AMPK pathway was analyzed in the VMH, and when injection of E2 was performed in the ARC, the AMPK pathway was analyzed in the ARC. (G and H) Western blot autoradiographic images (left panels) and protein levels (right panels) of (G) upstream kinases of AMPK and (H) PI3K/AKT pathway (left images and graph) and pSTAT3/STAT (right images and graph) in the VMH of OVX rats stereotaxically treated with vehicle or E2 within the VMH. Error bars represent SEM; n = 5 (c-FOS analysis) or 7–8 animals per experimental group. Gi: gigantocellular reticular nucleus; IO: inferior olive; ME: median eminence; py: pyramidal tract; RPa: raphe pallidus nucleus. , ∗∗ and ∗∗∗p < 0.05, 0.01, and 0.001 vs. vehicle VMH. In (A), it is important to note that the figure oversimplifies the protocol, since injections were given bilaterally.
Figure 6
Figure 6
Effect of Activation of Hypothalamic AMPK on the Central Actions of E2 on Energy Balance (A) Representative immunofluorescence (20×) with anti-GFP antibody showing GFP expression in the VMH of OVX rats treated with adenoviruses encoding AMPKα-CA within the VMH. (B–D) (B) Body weight change, (C) daily food intake, and (D) mRNA expression profile in the BAT (left panel) and core temperature (at 24 hr, right panel) of OVX rats SC treated with vehicle or E2 (VMH in [D], right) and stereotaxically treated with GFP or AMPKα-CA adenoviruses within the VMH. (E) Representative immunofluorescence (20×, left panel, and 40×, right panel) with anti-GFP antibody showing GFP expression in the ARC of rats treated with adenoviruses encoding AMPKα-CA within the ARC. (F–H) (F) Body weight change, (G) daily food intake, and (H) mRNA expression profile in the BAT of OVX rats SC treated with vehicle or E2 and stereotaxically treated with GFP or AMPKα-CA adenoviruses within the ARC. Error bars represent SEM; n = 8–17 animals per experimental group. 3V: third ventricle; , ∗∗, and ∗∗∗p < 0.05 and 0.01 vs. vehicle GFP VMH or ARC; #, ## and ### p < 0.05 and 0.01versus E2 GFP VMH or ARC.
Figure 7
Figure 7
Effect of Physiological Levels of E2 and Pharmacological and Genetic Manipulation of ERα on the VMH AMPK-SNS-BAT Axis (A–C) (A) Serum E2 levels (left panel) and core temperature (right panel), (B) protein levels (upper panel) and western blot autoradiographic images of BAT UCP1 protein (lower panel), and (C) western blot autoradiographic images (left panel) and levels of proteins of AMPK pathway in the VMH (right panel) of diestrus cycled rats. (D–F) (D) Body weight change (left panel) and daily food intake (right panel), (E) protein levels (upper panel) and western blot autoradiographic images of BAT UCP1 protein (lower panel), and (F) western blot autoradiographic images (left panel) and levels of proteins of AMPK pathway in the VMH (right panel) of intact rats ICV treated with the specific ERα antagonist MPP. (G–I) (G) Body weight change (left panel) and daily food intake (right panel), (H) protein levels (upper panel) and western blot autoradiographic images of BAT UCP1 protein (lower panel), and (I) western blot autoradiographic images (left panel) and levels of proteins of AMPK pathway in the VMH (right panel) of intact rats stereotaxically treated within the VMH with lentivirus encoding short hairpin RNA of the ERα. Error bars represent SEM; n = 7–8 animals per experimental group. , ∗∗, and ∗∗∗p < 0.05, 0.01, and 0.001 versus OVX, vehicle ICV, or GFP VMH.

References

    1. Andrews Z.B., Liu Z.W., Walllingford N., Erion D.M., Borok E., Friedman J.M., Tschöp M.H., Shanabrough M., Cline G., Shulman G.I. UCP2 mediates ghrelin’s action on NPY/AgRP neurons by lowering free radicals. Nature. 2008;454:846–851. - PMC - PubMed
    1. Apps R. Movement-related gating of climbing fibre input to cerebellar cortical zones. Prog. Neurobiol. 1999;57:537–562. - PubMed
    1. Cannon B., Nedergaard J. Brown adipose tissue: function and physiological significance. Physiol. Rev. 2004;84:277–359. - PubMed
    1. Cano G., Passerin A.M., Schiltz J.C., Card J.P., Morrison S.F., Sved A.F. Anatomical substrates for the central control of sympathetic outflow to interscapular adipose tissue during cold exposure. J. Comp. Neurol. 2003;460:303–326. - PubMed
    1. Carling D., Mayer F.V., Sanders M.J., Gamblin S.J. AMP-activated protein kinase: nature’s energy sensor. Nat. Chem. Biol. 2011;7:512–518. - PubMed

Publication types

MeSH terms

LinkOut - more resources