. 2014 Jun 18;82(6):1271-88.
doi: 10.1016/j.neuron.2014.04.047. Epub 2014 May 22.

Distinct tau prion strains propagate in cells and mice and define different tauopathies

Affiliations

Distinct tau prion strains propagate in cells and mice and define different tauopathies

David W Sanders et al. Neuron. .

Abstract

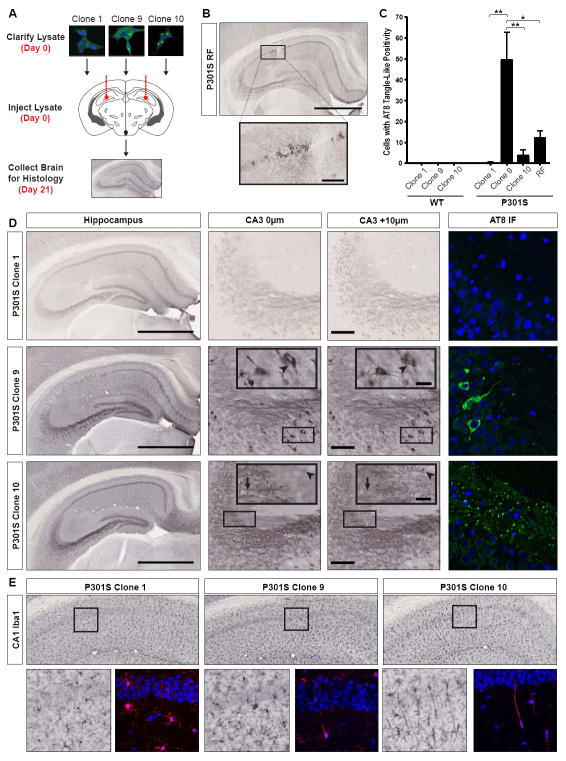
Prion-like propagation of tau aggregation might underlie the stereotyped progression of neurodegenerative tauopathies. True prions stably maintain unique conformations ("strains") in vivo that link structure to patterns of pathology. We now find that tau meets this criterion. Stably expressed tau repeat domain indefinitely propagates distinct amyloid conformations in a clonal fashion in culture. Reintroduction of tau from these lines into naive cells reestablishes identical clones. We produced two strains in vitro that induce distinct pathologies in vivo as determined by successive inoculations into three generations of transgenic mice. Immunopurified tau from these mice recreates the original strains in culture. We used the cell system to isolate tau strains from 29 patients with 5 different tauopathies, finding that different diseases are associated with different sets of strains. Tau thus demonstrates essential characteristics of a prion. This might explain the phenotypic diversity of tauopathies and could enable more effective diagnosis and therapy.


Conflict of interest statement

Conflict of Interest: M.I.D. acknowledges a potential conflict of interest in that he is a co-inventor of antibodies used in this study (HJ9.3 and HJ8.5) that have been licensed by C2N Diagnostics through an agreement with Washington University in St. Louis.

Figures

Figure 1
Figure 1. Homotypic seeding produces stably propagated tau RD inclusions
(A) Polyclonal HEK293 lines stably expressing YFP-tagged tau RD, α-synuclein, or htt exon1(Q25) were transduced with buffer, or fibrils of Aβ, Htt, α-syn, or tau RD. Cells were DAPI-stained on Day 6. Only homotypic seeding occurred. See Figure S1A for construct diagrams, Figure S1B for quantification, and Figure S1C,D for similar homotypic seeding using full-length (FL) 4R1N tau P301S. (B) Polyclonal HEK293 lines stably expressing tau RD-YFP with no mutations (WT), ΔK280 (pro-aggregation), ΔK280/I277P/I308P (2P; anti-aggregation), or P301L/V337M (LM; pro-aggregation) were transduced with either buffer or tau RD fibrils. Upon fibril transduction, all form inclusions, except for 2P. (C) Tau RD(LM)-YFP cells transduced with either buffer or tau RD fibrils were passaged every two days. On every other passage, the percentage of cells with inclusions was quantified (n=10 fields, each with 150+ cells per condition). Inset highlights inclusion-positive cells at later time points. Error bars represent S.E.M. (D) At Day 50 following exposure to fibrils, inclusion-positive cells were visible. (E-F) At Day 3 following exposure to fibrils, tau RD(LM)-YFP cells were diluted sparsely on coverslips and grown for 8 days. Colonies were either 100% inclusion-negative (E) or 100% inclusion-positive (F).
Figure 2
Figure 2. Generation of stably inherited tau RD prion strains
(A) A monoclonal HEK293 line stably expressing tau RD(LM)-YFP (hereafter referred to as tau RD) was transduced with tau RD fibrils. At Day 3, cells were diluted sparsely in a 10 cm dish. At Day 12, inclusion-positive colonies were identified and picked, amplifying to confluency in separate 10 cm dishes. At Day 30, cells were re-plated for confocal analysis or harvested for subsequent experiments. (B) Confocal analysis of morphologically distinct tau RD prion strains. Clone 1 does not contain inclusions. Clone 9 contains nuclear speckles and a small juxtanuclear inclusion. Clone 10 features one very large juxtanuclear inclusion and no nuclear speckles. See Figure S2A for other clones. (C) Clones 1, 9 and 10 were stained with X-34, an amyloid dye. X-34 staining is only observed in Clone 9 and Clone 10, indicating that the propagated aggregates are amyloids. (D) SDD-AGE demonstrates that Clone 10 features larger aggregates than Clone 9. (E) Sedimentation analysis was performed on Clones 1, 9, and 10. Pellet (P) was isolated from supernatant (S) by ultracentrifugation. For Clones 9 and 10, supernatant was loaded at a 3:1 ratio to pellet and total (T) to allow clear detection; Clone 1, a 1:1 ratio. Clone 1 has all tau RD in the supernatant, whereas Clone 9 has almost all tau RD in the pellet. Clone 10 has mixed solubility. (F) Limited proteolysis (pronase) digests all tau RD in Clone 1, but reveals protease-resistant tau RD peptides between 10 and 13 kDa as well as between 20 and 25 kDa in Clone 9 and 10. Unlike Clone 9, Clone 10 digestion produces a doublet, consistent with a distinct conformation. (G) A split-luciferase assay reports differential seeding efficiency of tau RD prion strains. A polyclonal HEK293 line expressing both tau RD-CLuc and tau RD-Nluc was transduced with lysate from the three clones. Clone 1 does not seed aggregation. Clone 9 seeds robustly, whereas Clone 10 seeds significantly less. Averages of four separate experiments are shown, each read in quadruplicate 48 hours post-transduction (error bars = S.E.M, * = p<0.05, **** = p<0.0001). See Figure S2B for evidence that differences in cell confluency do not account for differences in luminescence. (H) Inclusion elimination rates differ between clones. After transduction with lysate from Clone 9 or 10, the percentage of cells containing inclusions was quantified on days 4, 17, and 30 (n=10 fields, each with 150+ cells per condition). Cells with inclusions derived from Clone 9 are eliminated more rapidly from the population. Error bars = S.E.M, **** = p<0.0001. (I) Clone 9-transduced cells grow more slowly. After transduction of stable cells, colonies with inclusions derived from Clone 9 have fewer cells than colonies with inclusions derived from Clone 10. Colonies without inclusions have identical cell numbers (error bars = S.E.M, **** = p<0.0001). See Figure S2C for differences in cell growth rate in tau RD(LM)-HA cells and Figure S2D for LDH toxicity assay in tau RD(LM)-HA background. (J) Clones 1, 9, and 10 maintain distinctive morphologies after 6 months in culture. See also Figure S2E-H for data indicating that juxtanuclear Clone 10 but not Clone 9 inclusions are aggresomes. (K) Structural characteristics (limited proteolysis digestion patterns) of strains are propagated with high fidelity over six months.
Figure 3
Figure 3. Tau RD aggregates transfer strain conformations into naïve cells
(A) Lysates from Clones 9 and 10 were transduced into naïve tau RD-YFP cells and monoclonal inclusion-containing cells were isolated and amplified. Six secondary clones were generated for each condition, but one (Clone 9C) failed to amplify. (B) Morphologies of primary clones are maintained in secondary cell lines. See also Figure S3A, which demonstrates that this templating of morphology is not dependent on liposome-mediated transduction of lysate. (C) SDD-AGE of lysates from both primary and secondary clones demonstrates similar aggregate sizes in secondary clones relative to the primary ones. A line separates gels run separately. (D) Sedimentation analysis was performed as described in Figure 2E. Secondary clones feature similar sedimentation patterns to the clones from which they were derived. For original blots, see Figure S3B. (E) Split-luciferase complementation demonstrates similar seeding efficiencies in secondary lines vs. parental lines. Averages of four separate experiments are shown, each read in quadruplicate 48-hours post-transduction of lysate (error bars = S.E.M, **** = p<0.0001). (F) Limited proteolysis shows that all Clone 10 derivatives feature a doublet whereas Clone 9 derivatives are associated with an unresolvable band between 10 and 13 kDa. Clone 9 derivatives feature a more resistant band between 20 and 25 kDa. See Figure S3C,D for reversibility of aggregated state. (G) Lysates from Clones 9 and 10, but not Clone 1, induce detergent-resistant FL tau P301S-YFP species, which co-localize with AT8 (red) in primary cortical neurons. Clone 9 induces tangle-like structures throughout the soma and neuritic processes. Clone 10 primarily seeds punctate-like structures in the soma. See Figure S3E for data showing that Clone 9 seeds more widespread inclusion formation, Figure S3F for similar results in neurons expressing untagged FL tau P301S, and Figure S3G for images of tangles throughout processes of Clone 9-inoculated neurons. (H) Clone 9 and Clone 10 lysates containing tau RD(P301L/V337M)-YFP, do not seed inclusion formation in neurons expressing WT FL tau. For evidence that this is due to an asymmetric seeding barrier between FL tau with and without P301 mutations, see Figure S3H.
Figure 4
Figure 4. Clone 9 and 10 induce unique tau and microglia pathology in P301S mice
(A) Lysates (10 μg total protein) were injected bilaterally into the hippocampi of 3-month P301S and wild-type (WT) mice. 21 days post-injection, left hemispheres were collected for histology; right hemispheres for homogenization. See Figure S1 for description of mice used in all experiments. (B) Recombinant tau RD fibrils (RF) induce tangle-like, AT8-positive tau pathology near the injection site in CA1 (scale bars: hippocampus – 1 mm; inset – 100 μm). (C) Quantification of tangle-like, AT8-positive cell bodies within the hippocampus (CA1 and CA3) of WT and P301S mice. P301S mice injected with Clone 9 lysate have significantly more AT8-positive cell bodies than those injected with Clone 1, Clone 10, or RF (error bars = S.E.M., * = p<0.05, ** = p<0.01). WT mice do not develop pathology after injection. (D) P301S mice were inoculated with Clone 1, Clone 9, or Clone 10 lysate. Representative whole hippocampus images are shown with the corresponding CA3 z-stacks. Arrowheads in Clone 9 CA3 insets highlight an AT8-positive cell body that can be seen throughout both z-stack images. The arrow and arrowhead in Clone 10 CA3 insets each represent a different AT8-positive puncta that is visible in only one z-stack plane (scale bars: hippocampus – 1 mm; CA3 – 100 μm; CA3 inset and AT8 IF – 25 μm; n=3-4 per clone). See Figure S4A for MC1 and X-34 staining, Figure S4B for lack of pathology in inoculated WT mice. (E) Iba1 staining of microglia in CA1 of inoculated P301S mice indicates that only Clone 10 induces the formation of rod microglia, which extend highly polarized processes into CA1. See Figure S4C for columns of rod microglia in these animals and Figure S4D for absence of these microglia in Clone 10- inoculated WT animals. See Figure S4E and Figure S4F for data indicating that identical amounts of total and insoluble tau were used in inoculations.
Figure 5
Figure 5. Tau strains passage stably through multiple generations of P301S mice
(A) Lysates (10 μg protein) were injected bilaterally into the hippocampi of 3-month P301S mice (Generation 0/G0). 21 days post-injection, brains were collected for histology and homogenization. Hippocampal homogenate (10 μg) was then bilaterally inoculated into a new round of 3-month P301S mice (Generation 1/G1) followed by a 28-day incubation before the process was repeated for a new cohort of 3-month P301S mice (Generation 2/G2). At G0 and G2, hippocampal homogenates were IPed (anti-tau 8.5; epitope = aa 25-30; outside RD region) and inoculated into the original tau RD-YFP line to test the fidelity of strain inheritance (G0 and G2 clones). For each cohort, n=3-4 animals. (B-C) AT8 staining (DAB = B and immunofluorescence = C) reveals that the morphological phenotypes of phosphorylated tau inclusions breed true through multiple generations of tau P301S mice. See Figure S5A for images of whole hippocampi, Figure S5B for images of Clone 1 AT8 immunofluorescence, and Figure S5C for data indicating that strain passage is not due to residual tau RD seeds remaining in diluted inoculate.
Figure 6
Figure 6. Strains transfer faithfully to cell culture after passage through Generation 0 and Generation 2 mice
(A) IPed material was transduced into tau RD-YFP cells prior to passage onto coverslips. At 96 hours, cells were fixed. Only Clone 9-, Clone 10-, and RF-inoculated mice seed inclusions robustly. WT mouse homogenates never seed aggregation. Ten fields, each with 100+ cells, were analyzed per brain, and averages were collapsed within cohorts (error bars = S.E.M., **** = p<0.0001). See also Figure S6A for split-luciferase complementation data. (B) Inclusion morphologies are maintained following passage through P301S mice (G0). IPed FL tau from individual P301S mice inoculated with Clone 9 or Clone 10 was transduced into tau RD-YFP cells, and a single representative clone per mouse was isolated and amplified. All G0-derived clones continue to propagate the original phenotypes. See also Figure S6B,C for quantification of colony morphologies prior to monoclonal cell line isolation and Figure S6D for quantification of total IPed tau used in G0 experiments. (C) Limited proteolysis reveals that G0 clones feature similar banding patterns to the original parental lines, with G0-Clone 10 featuring a doublet between 10-13 kDa (vs. smear for G0-Clone 9) and a band between 20 and 25 kDa that is slightly smaller than G0-Clone 9 bands. (D) Split-luciferase complementation demonstrates similar seeding efficiencies in G0 clones relative to original parental lines. Averages of four separate experiments are shown, each read in quadruplicate 48- hours post-transduction of lysate (error bars = S.E.M, **** = p<0.0001). (E). IPed material from pooled G2 mice was transduced into naïve tau RD-YFP cells prior to passage onto coverslips. At 96 hours, cells were fixed. Seeding of inclusion formation is significantly greater for G2-Clone 9 and G2-Clone 10 mice than G2-Clone 1 mice. G2-Clone 1 tau induces inclusions on rare occasions (~1% of cells). Seeding is specific to tau as IgG-precipitated material never seeds. Ten fields, each with 150+ cells, were analyzed per condition (error bars = S.E.M., * = p<0.05, **** = p<0.0001). See also Figure S6E for split-luciferase complementation data. (F) Inclusion morphologies are maintained following passage through three generations of mice. IPed full-length tau from pooled G2 homogenates was transduced into tau RD-YFP cells, and 12 clones per cohort were isolated. Representative examples are shown. The two clones boxed in red feature similar limited proteolysis digestion patterns and seeding ratios to each other, which are unique from all 22 other clones. See Figure S6F for quantification of colony morphologies prior to monoclonal cell line isolation and Figure S6G for images of all 24 clones. (G) Limited proteolysis reveals that G2 clones feature similar banding patterns to their parental lines, with G2-Clone 10 featuring a doublet between 10-13 kDa (vs. smear for G2-Clone 9) and a band between 20 and 25 kDa that is slightly smaller than G2-Clone 9 digests. Two clones (boxed in red), one for each cohort, are unique in featuring bands at 15 and 25 kDa. (H) Split-luciferase complementation demonstrates similar seeding efficiencies in G2 clones relative to original parental lines. Seeding ratios were averaged across clones, each of which was read in quadruplicate 48-hours post-transduction of lysate (error bars = S.E.M, **** = p<0.0001). Boxed in red are two outlier clones (9G and 10D), which also feature unique inclusion morphologies and limited proteolysis digestion patterns.
Figure 7
Figure 7. Anterograde and retrograde spread of pathology to synaptically connected regions in Generation 3-Clone 9 (G3-Clone 9) mice
(A) Schematic of known projections to and from the hippocampus (DG = dentate gyrus; MEC/LEC = medial and lateral entorhinal cortices; MF = mossy fibers; RSp = retrosplenial cortex; Sub = subiculum). (B) Representative images of AT8 staining in the hippocampi of G3 mice inoculated with 10 μg of G2 brain homogenate. Spread of Clone 9 pathology to the contralateral hippocampus is evident. See Figure S7A for whole brain slices. (C) Summary of pathology present in G3-Clone 9 mice. Gradient represents semi-quantitative analysis of neurofibrillary tangle-like AT8 cell body positivity observed in each region (PPA = posterior parietal association area) both 2.5 and 3.0 mm posterior to bregma. (D) AT8 histopathology observed in brain regions with known projections to/from the hippocampus. Ipsilateral AT8 pathology is observed in the EC and appears in cortical layers II-III, whereas contralateral pathology is observed in deeper layers of the EC. Pathology is also observed in the retrosplenial cortex, especially ipsilateral to the injection site. See Figure S7B for subiculum and dentate gyrus images.
Figure 8
Figure 8. Diverse tau prion strains within patients and across diseases
(A) Schematic illustrating methods used to generate patient-derived tau RD prion strains in a monoclonal Tet Off-tau RD-YFP line. See Figure S8 for data indicating that different inclusion morphologies are associated with different biochemical and seeding properties. (B) Morphological phenotypes associated with tau RD prion strains induced by patient material: no seeding, toxic, mosaic, ordered, disordered, speckles. Representative examples are shown. (C) IPed tau from 29 patient samples (AD = Alzheimer’s disease, AGD = argyrophilic grain disease, CBD = corticobasal degeneration, PiD = Pick’s disease, PSP = progressive supranuclear palsy) was transduced into tau RD-YFP cells (Tet Off) and as many inclusion-positive clones as could be identified for each patient sample were blindly picked and amplified. Once confluent in 10 cm dishes, morphological phenotypes were scored by a separate blinded experimenter. See Table S2 for numerical values, patient-related information, and tissue origin.

Comment in

References

    1. Aguzzi A, Rajendran L. The transcellular spread of cytosolic amyloids, prions, and prionoids. Neuron. 2009;64:783–790. - PubMed
    1. Andersen P. The Hippocampus Book. Oxford University Press; 2007.
    1. Aoyagi H, Hasegawa M, Tamaoka A. Fibrillogenic nuclei composed of P301L mutant tau induce elongation of P301L tau but not wild-type tau. J Biol Chem. 2007;282:20309–20318. - PubMed
    1. Barghorn S, Zheng-Fischhöfer Q, Ackmann M, Biernat J, Bergen von M, Mandelkow EM, Mandelkow E. Structure, microtubule interactions, and paired helical filament aggregation by tau mutants of frontotemporal dementias. Biochemistry. 2000;39:11714–11721. - PubMed
    1. Bergen von M, Barghorn S, Li L, Marx A, Biernat J, Mandelkow EM, Mandelkow E. Mutations of tau protein in frontotemporal dementia promote aggregation of paired helical filaments by enhancing local beta-structure. J Biol Chem. 2001;276:48165–48174. - PubMed

Publication types