. 2014 Oct 1;23(19):2336-51.
doi: 10.1089/scd.2014.0122. Epub 2014 Jul 3.

SHIP1 regulates MSC numbers and their osteolineage commitment by limiting induction of the PI3K/Akt/β-catenin/Id2 axis

Affiliations

SHIP1 regulates MSC numbers and their osteolineage commitment by limiting induction of the PI3K/Akt/β-catenin/Id2 axis

Sonia Iyer et al. Stem Cells Dev. .

Abstract

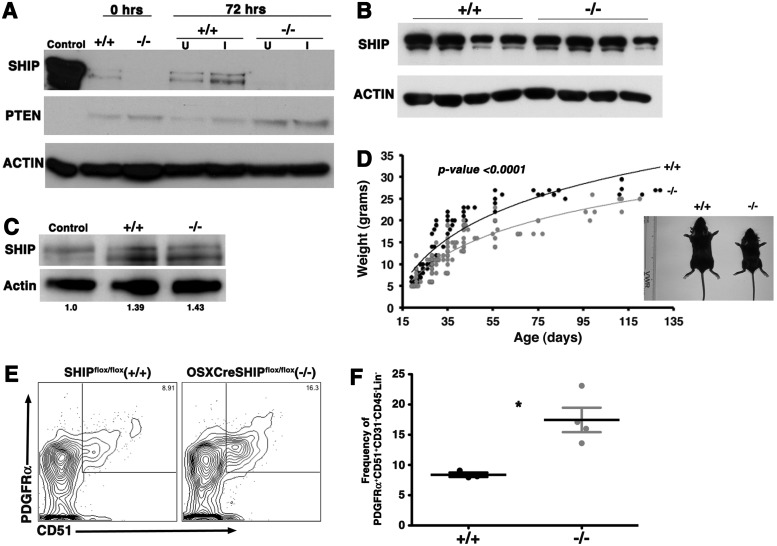
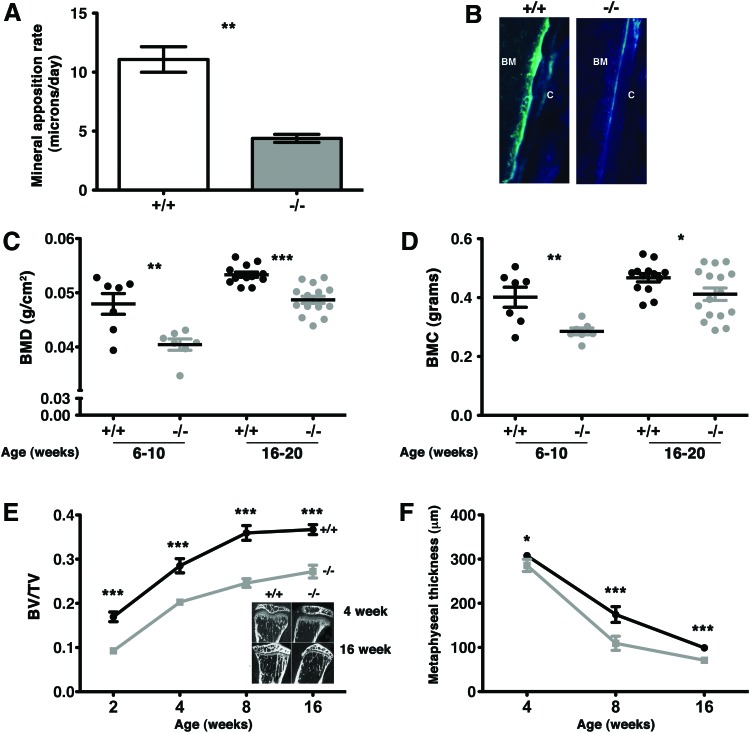
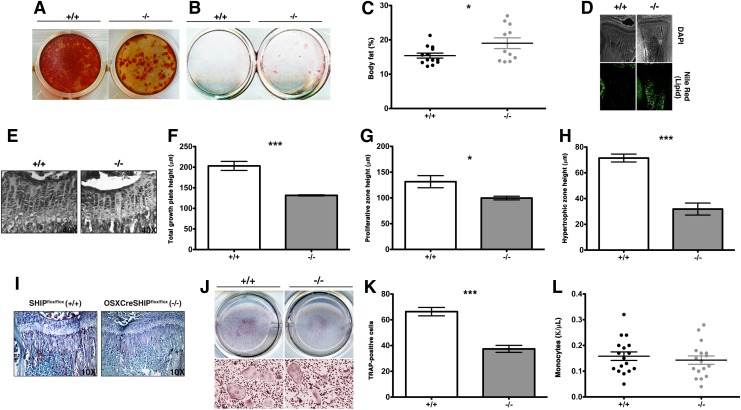
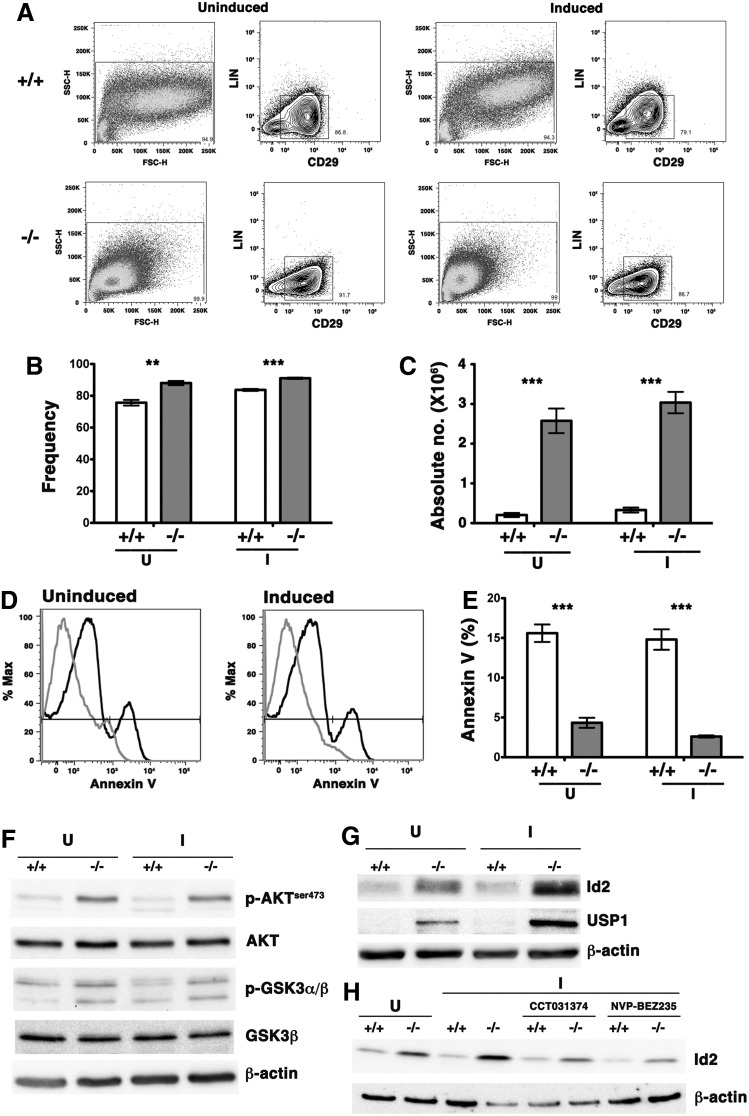
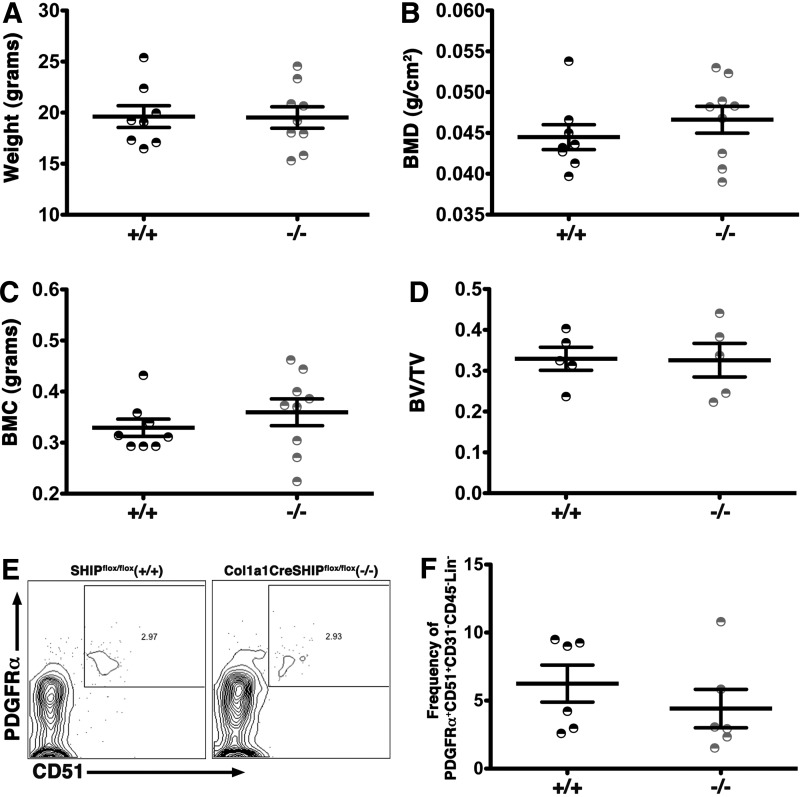
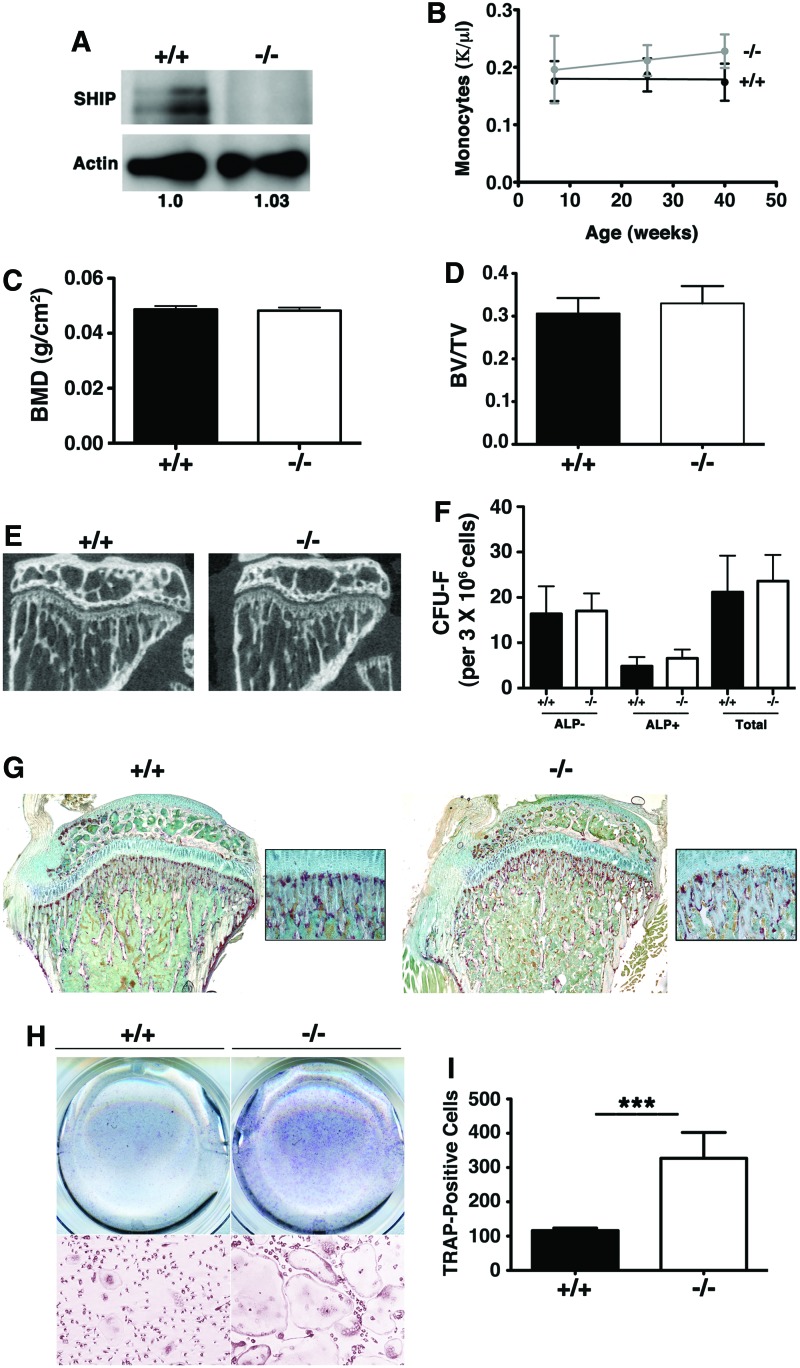
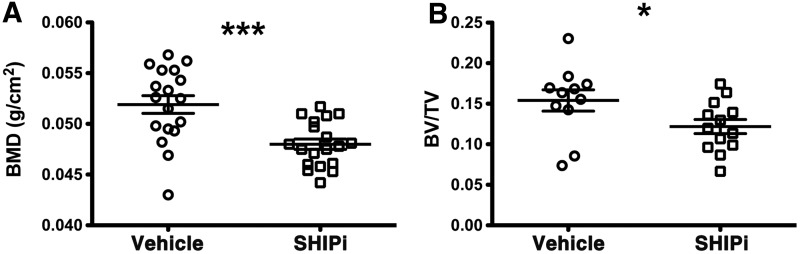
Here, we show that Src homology 2-domain-containing inositol 5'-phosphatase 1 (SHIP1) is required for the efficient development of osteoblasts from mesenchymal stem cells (MSCs) such that bone growth and density are reduced in mice that lack SHIP1 expression in MSCs. We find that SHIP1 promotes the osteogenic output of MSCs by limiting activation of the PI3K/Akt/β-catenin pathway required for induction of the MSC stemness factor Id2. In parallel, we demonstrate that mice with myeloid-restricted ablation of SHIP1, including osteoclasts (OCs), show no reduction in bone mass or density. Hence, diminished bone mass and density in the SHIP1-deficient mice results from SHIP deficiency in MSC and osteolineage progenitors. Intriguingly, mice with a SHIP-deficient MSC compartment also exhibit decreased OC numbers. In agreement with our genetic findings we also show that treatment of mice with an SHIP1 inhibitor (SHIPi) significantly reduces bone mass. These findings demonstrate a novel role for SHIP1 in MSC fate determination and bone growth. Further, SHIPi may represent a novel therapeutic approach to limit bone development in osteopetrotic and sclerotic bone diseases.


Figures

<b>FIG. 1.</b>
FIG. 1.
MSC and osteolineage progenitors (MS/PC)-specific ablation of Src homology 2-domain-containing inositol 5′-phosphatase 1 (SHIP1) expression retards growth and expanded mesenchymal stem cell (MSC) compartment. (A) Bone marrow (BM)-derived MSCs were cultured in conditions that induce osteoblast (OB) differentiation. SHIP1 and PTEN expression in cell lysates were assessed by immunoblotting at days 0 and 3. Actin serves as a loading control. Lanes containing SHIPflox/flox (+/+) or OSXCreSHIPflox/flox (−/−) cell lysates are as indicated. (B) SHIP1 level in blood mononuclear cell lysates were assessed by immunoblotting from four independent SHIPflox/flox (+/+) and OSXCreSHIPflox/flox (−/−) mice. (C) Macrophage progenitors in BM were cultured with RANKL and M-CSF and SHIP1 levels in whole cell lysates (WCL) were assessed by immunoblotting at day 3 of differentiation. Actin quantification was performed using Image lab software 3.0.1 Beta 2; Bio-Rad Laboratories. Lanes containing control (WT), SHIPflox/flox (+/+) or OSXCreSHIPflox/flox (−/−) cell lysates are as indicated. (D) Weights of male SHIPflox/flox (black circles) and OSXCreSHIPflox/flox (gray circles) mice, each symbol represents an individual mouse, between 19 and 129 days postpartum, data analysis was performed using analysis of covariance (ANCOVA) followed by Bonferroni's multiple comparison post hoc test with age or gender to evaluate the differences between groups. Representative images of 3-week-old male SHIPflox/flox (+/+) and OSXCreSHIPflox/flox (−/−) (see inset). (E) Representative contour plots of PDGFRα+51+ MSC (PDGFRα+CD51+CD31CD45Lin) in 8–10-week-old SHIPflox/flox (+/+) and OSXCreSHIPflox/flox (−/−) mice. (F) Bar graph of Pα+51+ MSC frequency among CD31CD45Lin cells in OSXCreSHIPflox/flox (−/−) versus SHIPflox/flox controls (+/+) (n=4),±SEM. *P≤0.05, Student's unpaired, two-tailed t-test). Note: significant difference in weight was also observed in age-matched female SHIPflox/flox and OSXCreSHIPflox/flox littermates. RANKL, receptor activator of nuclear factor kappa-B ligand.
<b>FIG. 2.</b>
FIG. 2.
A SHIP-deficient MS/PC compartment limits bone apposition and causes osteoporosis. Mineral apposition rate (MAR) was calculated by measuring the distance from the oxytetracycline band to the endosteal surface. (A) Reduced bone MAR was observed in 3-week-old OSXCreSHIPflox/flox in comparison to SHIPflox/flox controls. (n≥4, ±SEM **P ≤ 0.001 Student's unpaired, two-tailed t-test) (B) Representative images of oxytetracycline band seen in SHIPflox/flox (+/+) and OSXCreSHIPflox/flox (−/−) C, cortical bone. (C) Whole-body bone mineral density (BMD) and (D) bone mineral content (BMC) by DEXA analysis of 6–20-week-old SHIPflox/flox (+/+) and OSXCreSHIPflox/flox (−/−) mice; (n≥7,±SEM. *P≤0.05, **P≤0.001 and ***P≤0.0001 Student's unpaired, two-tailed t-test, each symbol represents an individual mouse). (E) Metaphyseal histomorphometric parameters, bone volume over tissue volume (Bv/Tv), measured at 2, 4, 8 and, 16 weeks in SHIPflox/flox (+/+) and OSXCreSHIPflox/flox (−/−) mice (±SEM ***P≤0.0001 Student's unpaired two-tailed t-test). Representative micro computed tomography (microCT) scans of sagittal sections through the proximal metaphysis taken from 4- and 16-week-old SHIPflox/flox (+/+) and OSXCreSHIPflox/flox (−/−) mice (inset). (F) Metaphyseal thickness (μm) of 4, 8, and 16 week-old-male SHIPflox/flox (+/+) (black circles) and OSXCreSHIPflox/flox (−/−) (gray squares) mice (±SD *P≤0.05 and ***P≤0.0001 Student's unpaired, two-tailed t-test). Significant difference in metaphyseal thickness was also observed in female SHIPflox/flox and OSXCreSHIPflox/flox littermates. Note: results presented for MAR, BMC, and Bv/Tv represent pooled male and female SHIPflox/flox and OSXCreSHIPflox/flox mice. Color images available online at www.liebertpub.com/scd
<b>FIG. 3.</b>
FIG. 3.
SHIP deficiency in MS/PC causes defective development of osteolineage cells, growth plate chondrocytes, causes enhanced adipogenesis, and defective development of osteoclastogenesis. (A) Alizarin red staining after osteogenic induction of MSC from OSXCreSHIPflox/flox mice (−/−) in comparison to SHIPflox/flox (+/+) at 4 weeks of age (n=5). (B) Oil Red-O staining on day 21 in OSXCreSHIPflox/flox (−/−) in comparison to SHIPflox/flox (+/+) after adipocyte induction of MSC at 4 weeks of age (n=5). (C) Body fat between 6 and 10 weeks in OSXCreSHIPflox/flox (−/−) in comparison to SHIPflox/flox (+/+) controls (n≥10,±SEM. *P≤0.05 Student's unpaired, two-tailed t-test, each symbol represents an individual mouse, data represent pooled male and female SHIPflox/flox and OSXCreSHIPflox/flox mice). (D) Nile Red (green) fluorescent staining of the BM of 4-week-old OSXCreSHIPflox/flox (−/−) and SHIPflox/flox tibias (+/+); DAPI staining (top panels) was employed to observe general morphology (4×magnification). (E) Representative images of the growth plates of OSXCreSHIPflox/flox (−/−) and SHIPflox/flox (+/+) control mice, 40×magnification image. (F) Total growth plate, (G) proliferative zone, and (H) hypertrophic zone height of OSXCreSHIPflox/flox (−/−) and SHIPflox/flox (+/+) control mice (n=4 mice,±SEM. *P≤0.05 and ***P≤0.0001, Student's unpaired, two-tailed t-test). (I) TRAP+ osteoclasts (OCs) observed in the proximal tibia sections of OSXCreSHIPflox/flox (−/−) and SHIPflox/flox (+/+) controls, in the metaphysis (10× magnification). (J) TRAP staining of OCs differentiated from bone marrow-derived monocytes (BMM) in the presence of RANKL and M-CSF in 8-weeks-old BM of OSXCreSHIPflox/flox (−/−) and SHIPflox/flox (+/+) control mice. Top panels are from representative plates and the bottom panels are 10×magnifications from these plates. (K) The corresponding quantitation of TRAP+ OCs shown to the right SHIPflox/flox (+/+) and OSXCreSHIPflox/flox (−/−), (n=6 mice,±SEM. ***P≤0.0001, Student's unpaired, two-tailed t-test). (L) Circulating monocyte in peripheral blood measured in OSXCreSHIPflox/flox (−/−) and SHIPflox/flox (+/+) controls. Color images available online at www.liebertpub.com/scd
<b>FIG. 4.</b>
FIG. 4.
Dysregulation of the PI3K/Akt/β-catenin/Id2 axis promotes MSC expansion in vivo and ex vivo. BM MSC from OSXCreSHIPflox/flox (−/−) or SHIPflox/flox (+/+) littermates were seeded at equal numbers and cultured under osteogenic conditions (I) for 5 days and processed as described. Uninduced cells (U) were used as controls for all experiments and were also initially seeded at equal cell numbers. Results shown are representative of three independent experiments for MSC of the indicated genotypes and are representative of MSC cultures prepared from 4- to 16-week-old mice. Flow cytometry gates for (A) uninduced and induced cultures (osteogenic conditions) to detect CD29+Lin MSC population in cultures prepared from OSXCreSHIPflox/flox (−/−) and SHIPflox/flox (+/+) mice. Cells were gated for: SSC-H versus FSC-H lack of expression of a Lineage marker panel and surface expression of CD29+ as indicated. (B) Significant increased frequency of OSXCreSHIPflox/flox (−/−) CD29+Lin MSC before (uninduced, U) and after osteogenic induction (induced, I) (±SEM. **P≤0.001 and ***P≤0.0001 Student's unpaired, two-tailed t-test). (C) The absolute numbers of OSXCreSHIPflox/flox (−/−) MSC in both uninduced (U) and induced (I) conditions in OSXCreSHIPflox/flox (−/−) and SHIPflox/flox (+/+) controls. (±SEM. ***P≤0.0001, Student's unpaired, two-tailed t-test) (D) Representative Annexin V histograms for bulk MS/PC prepared from SHIPflox/flox (+/+) black lines and OSXCreSHIPflox/flox (−/−) gray lines mice cultured under uninduced (U) and osteogenic induction (I) conditions. (E) Bar graphs indicating the frequency of apoptotic SHIPflox/flox (+/+) and OSXCreSHIPflox/flox (−/−) CD29+Lin MSC during ex vivo culture in the absence or presence of osteogenic induction factors (±SEM. ***P≤0.0001 Student's unpaired, two-tailed t-test). (F) Phosphorylation status of AKT and GSK3α/β in SHIPflox/flox (+/+) and OSXCreSHIPflox/flox (−/−) BM-derived MSC cultures in the absence (U) or presence (I) of osteogenic induction factors. (G) Expression of Id2 and USP1, was examined by western blotting with β-actin serving as loading control, in SHIPflox/flox (+/+) and OSXCreSHIPflox/flox (−/−) in the absence (U) or presence (I) of osteogenic induction factors. (H) OSXCreSHIPflox/flox (−/−) or SHIPflox/flox (+/+) MSC (U) and were pretreated for an hour with β-catenin inhibitor (CCT031374) and the pan-PI3K/mTOR inhibitor (NVP-BEZ235) prior to osteogenic induction (I). Expression of Id2 was examined by western blotting with β-actin serving as loading control.
<b>FIG. 5.</b>
FIG. 5.
SHIP1 expression in mature OBs does not limit bone apposition. No difference was observed in (A) body weight, (B) BMD, (C) BMC and (D) Bv/Tv in 4-6 week old Col1a1CreSHIPflox/flox (−/−) in comparison to SHIPflox/flox controls (+/+). No difference was observed in Pα+51+ MSC frequency among CD31CD45Lin cells in 8–10-week-old SHIPflox/flox (+/+) and Col1a1CreSHIPflox/flox (−/−) mice. (E) Representative contour plots of PDGFRα+51+ MSC (PDGFRα+CD51+CD31CD45Lin) and (F) bar graph indicating the frequency of Pα+51+ MSC in SHIPflox/flox (+/+) and Col1a1CreSHIPflox/flox (−/−) mice (n=6). Note: results presented for body weight, BMD, BMC, and Bv/Tv represent pooled male and female SHIPflox/flox and Col1a1CreSHIPflox/flox mice.
<b>FIG. 6.</b>
FIG. 6.
A SHIP1-deficient OC compartment does not lead to osteoporosis. (A) Monocytes were differentiated with RANKL and M-CSF and SHIP1 levels in OC from SHIPflox/flox (+/+) and LysMCreSHIPflox/flox (−/−) mice were assessed by western blot. Actin serves as a loading control and its relative quantification is indicated below. (B) Circulating monocyte in peripheral blood measured at 7, 25, and 40 weeks of age in male and female LysMCreSHIPflox/flox (−/−) versus SHIPflox/flox littermates (+/+). (C) Whole-body BMD by DEXA analysis, (D) Bv/Tv measurements and (E) in sagittal sections through the proximal metaphysis taken derived from microCT scans of 16-week-old male SHIPflox/flox (+/+) and LysMCreSHIPflox/flox (−/−) mice (these results are representative of four mice of each genotype). (F) Quantitative plots of colony forming unit-fibroblast (CFU-F) numbers (per 3×10⁶ cells) from 16-week-old male SHIPflox/flox (+/+) (black bars) and LysMCreSHIPflox/flox (−/−) (open bars), mice (n=5). (G) TRAP stained proximal tibia sections of SHIPflox/flox (+/+) and LysMCreSHIPflox/flox (−/−) (4× and 20× magnification). (H) TRAP staining of OCs prepared from BMM that were cultured with RANKL and M-CSF showed a ∼2.8-fold increase in OC numbers in 16 weeks LysMCreSHIPflox/flox (−/−) versus SHIPflox/flox littermates (+/+). Top panels are representative plates and the bottom panels are 10×-magnified images from these plates. (I) The corresponding bar graphs (SHIPflox/flox (+/+) (black bars) and LysMCreSHIPflox/flox (−/−) (open bars) to the right represent mean OC numbers as determined for cultures from four mice/genotype with BMM from each mouse analyzed in duplicate (±SEM, ***P≤0.0001, Student's unpaired, two-tailed t-test). Note: no significant differences were observed in BMD and Bv/Tv in female SHIPflox/flox and LysMCreSHIPflox/flox littermates. Color images available online at www.liebertpub.com/scd
<b>FIG. 7.</b>
FIG. 7.
SHIP1 inhibitor (SHIPi) reduces bone mass. Male 6–12-month-old C57BL6/J mice were injected intraperitoneally with vehicle or SHIPi, a SHIP1 inhibitor, at 25 mg/kg three times per week for 4, 8, and 12 weeks. Significant decrease was observed in (A) whole-body BMD by DEXA analysis in SHIPi-treated group (open square) versus vehicle group (open circle) (±SEM ***P≤0.0001 Student's unpaired, two-tailed t-test). (B) Metaphyseal histomorphometric parameter, Bv/Tv was significantly decreased after SHIPi treatment in the SHIPi group (open squares) in comparison to vehicle group (open circles) (±SEM *P≤0.05 Student's unpaired, two-tailed t-test, each symbol represents an individual mouse).

Similar articles

Cited by

References

    1. Hadjidakis DJ. and Androulakis I. (2006). Bone remodeling. Ann N Y Acad Sci 1092:385–396 - PubMed
    1. Friedenstein AJ, Petrakova KV, Kurolesova AI. and Frolova GP. (1968). Heterotopic of bone marrow. Analysis of precursor cells for osteogenic and hematopoietic tissues. Transplantation 6:230–247 - PubMed
    1. Friedenstein AJ, Deriglasova UF, Kulagina NN, Panasuk AF, Rudakowa SF, Luria EA. and Ruadkow IA. (1974). Precursors for fibroblasts in different populations of hematopoietic cells as detected by the in vitro colony assay method. Exp Hematol 2:83–92 - PubMed
    1. Owen M. and Friedenstein AJ. (1988). Stromal stem cells: marrow-derived osteogenic precursors. Ciba Found Symp 136:42–60 - PubMed
    1. Caplan AI. (1991). Mesenchymal stem cells. J Orthop Res 9:641–650 - PubMed

Publication types

MeSH terms

Substances