Review
. 2015 May;1849(5):484-500.
doi: 10.1016/j.bbagrm.2014.05.016. Epub 2014 May 22.

Functional interactions among members of the MAX and MLX transcriptional network during oncogenesis

Affiliations
Review

Functional interactions among members of the MAX and MLX transcriptional network during oncogenesis

Daniel Diolaiti et al. Biochim Biophys Acta. 2015 May.

Abstract

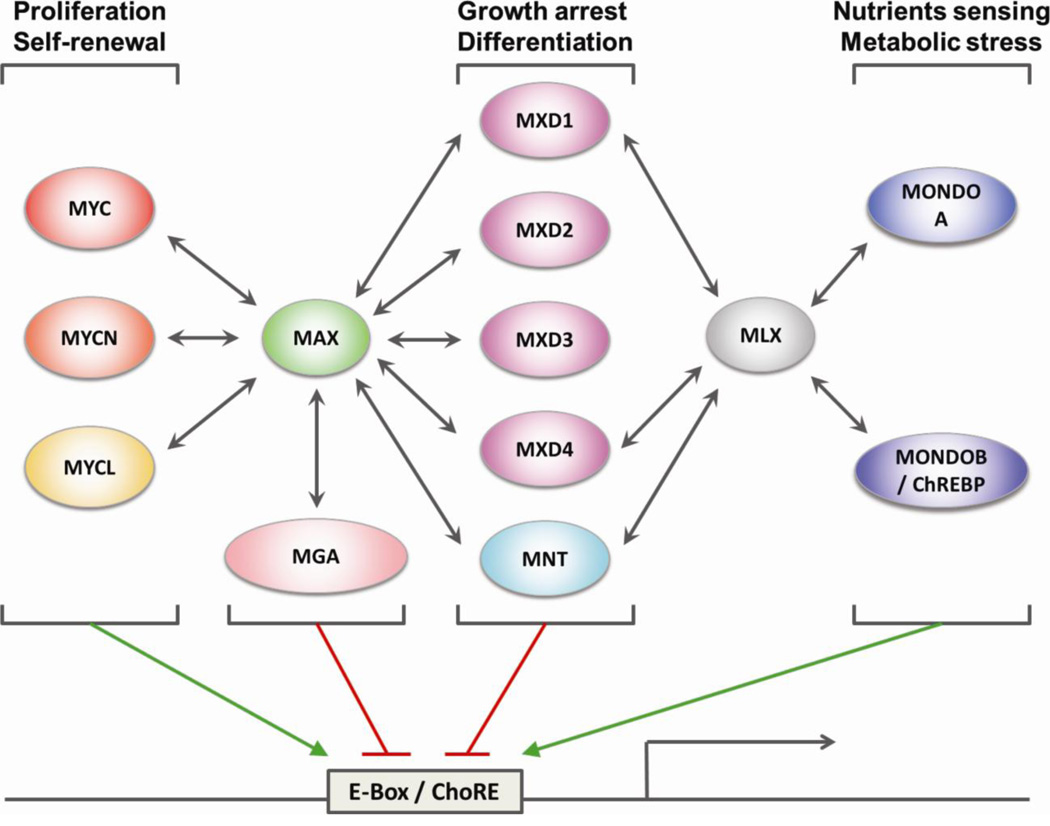
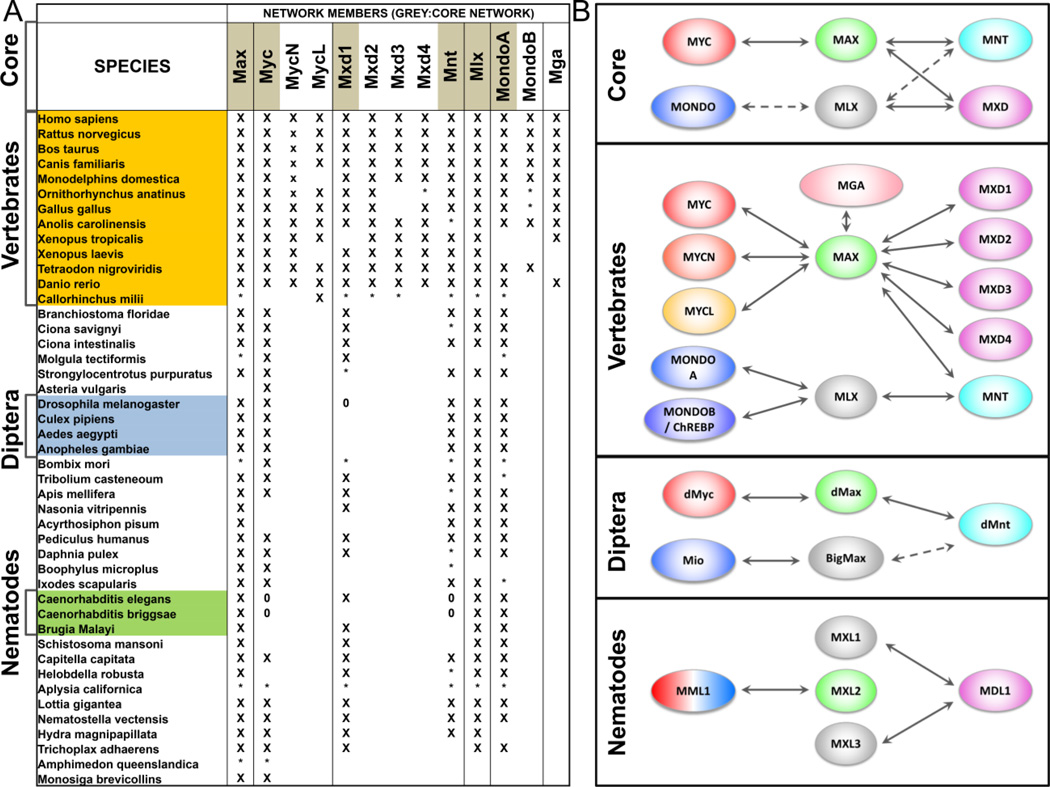
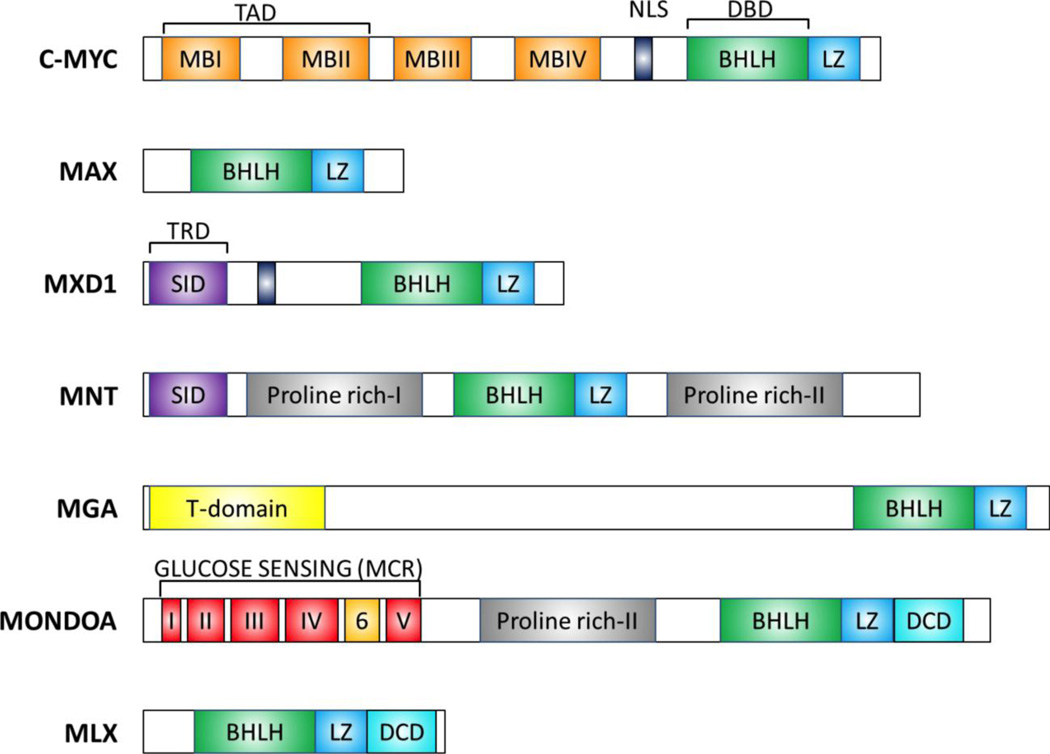
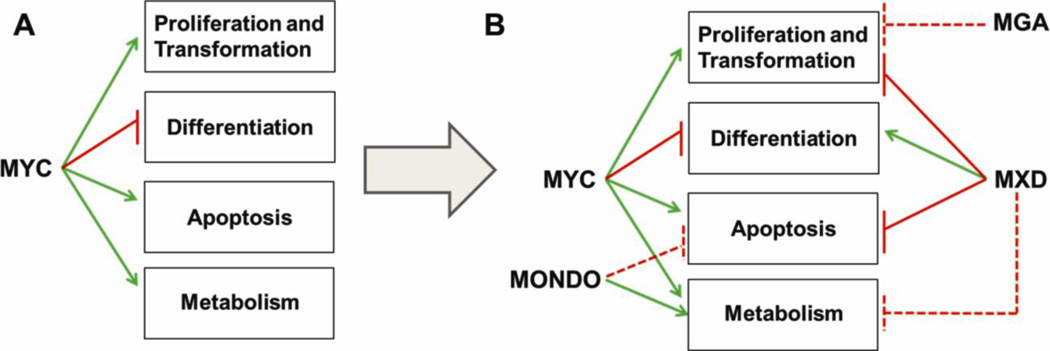
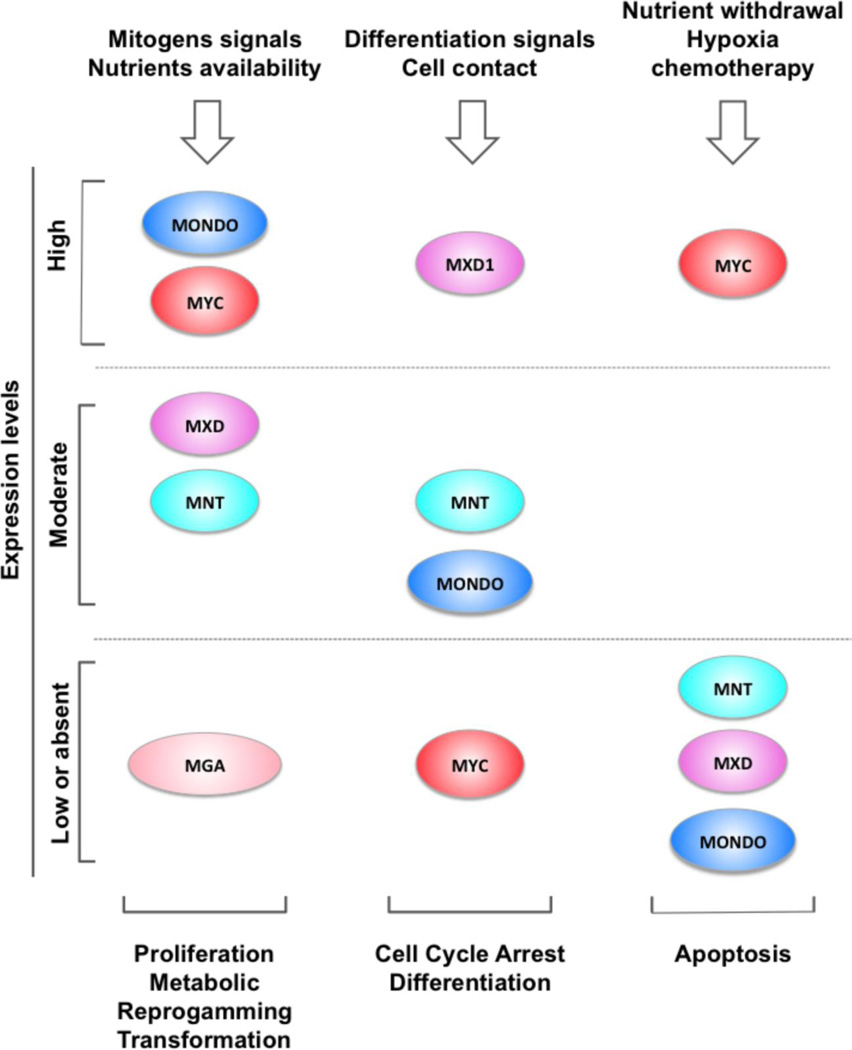
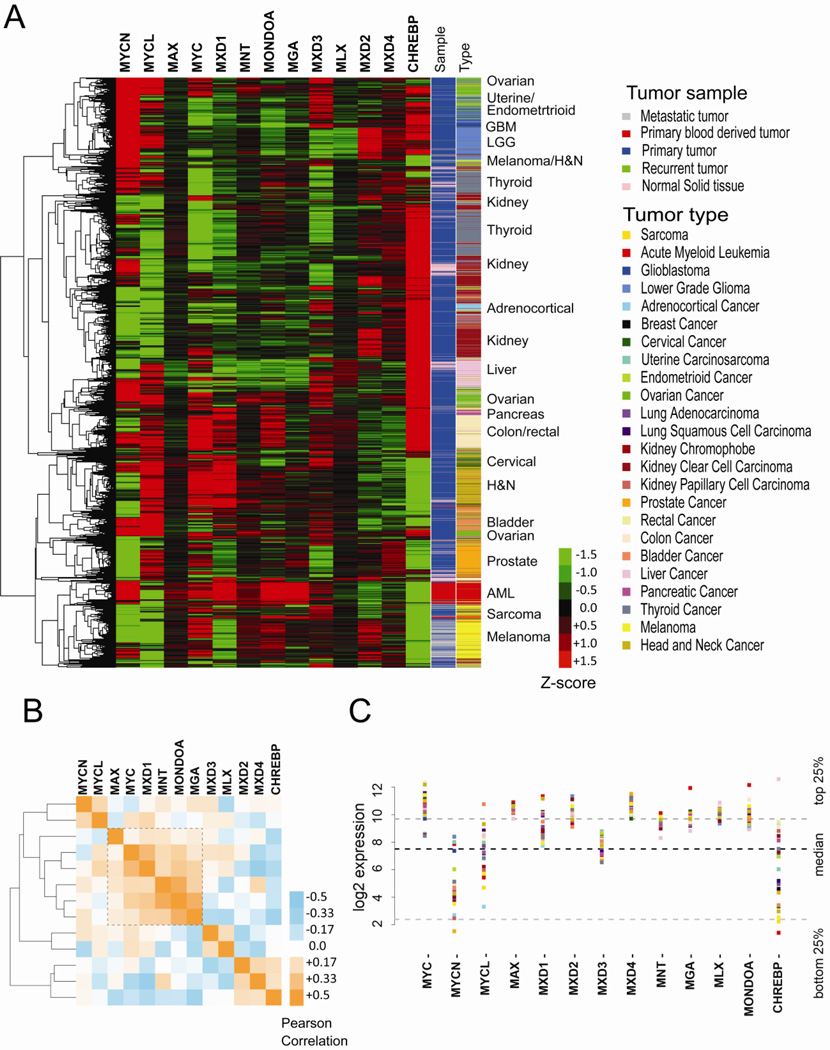
The transcription factor MYC and its related family members MYCN and MYCL have been implicated in the etiology of a wide spectrum of human cancers. Compared to other oncoproteins, such as RAS or SRC, MYC is unique because its protein coding region is rarely mutated. Instead, MYC's oncogenic properties are unleashed by regulatory mutations leading to unconstrained high levels of expression. Under both normal and pathological conditions MYC regulates multiple aspects of cellular physiology including proliferation, differentiation, apoptosis, growth and metabolism by controlling the expression of thousands of genes. How a single transcription factor exerts such broad effects remains a fascinating puzzle. Notably, MYC is part of a network of bHLHLZ proteins centered on the MYC heterodimeric partner MAX and its counterpart, the MAX-like protein MLX. This network includes MXD1-4, MNT, MGA, MONDOA and MONDOB proteins. With some exceptions, MXD proteins have been functionally linked to cell cycle arrest and differentiation, while MONDO proteins control cellular metabolism. Although the temporal expression patterns of many of these proteins can differ markedly they are frequently expressed simultaneously in the same cellular context, and potentially bind to the same, or similar DNA consensus sequence. Here we review the activities and interactions among these proteins and propose that the broad spectrum of phenotypes elicited by MYC deregulation is intimately connected to the functions and regulation of the other network members. Furthermore, we provide a meta-analysis of TCGA data suggesting that the coordinate regulation of the network is important in MYC driven tumorigenesis. This article is part of a Special Issue entitled: Myc proteins in cell biology and pathology.

Keywords: Max/Mlx transcriptional network; Metabolism; Myc; Oncogenesis; The cancer genome atlas (TCGA); Transcription.


Figures

Figure 1
Figure 1. Diagram of the MAX/MLX network
All members of the MAX/MLX network and their reciprocal heterodimerization partners (indicated by the two-headed arrows) are represented. Green arrows and red lines indicate transcriptional activation and repression respectively. E-Box, Enhancer-box; ChoRE, Carbohydrate response element.
Figure 2
Figure 2. The MAX/MLX network in the animal kingdom
A) Species specific distribution of MAx/MLX network members. “X”, the bHLHZ was found within a protein or expressed sequence tag; “*”, part or all of the sequence was found within a genetic region; “0”, the protein is known to be absent. B) Schematic representation of the four main network topologies. Solid arrows indicate experimentally verified interactions, whereas dotted arrows indicate debated or unknown interactions. Figure created from data in McFerrin and Atchley (c) 2011, with permission from the authors.
Figure 3
Figure 3. Domain organization of the MAX/MLX network members
A representative member of each subfamily is included. Colored box indicates functional domains. MBI-IV, MYC box domains; NLS, nuclear localization signal; BHLH, Basic helix loop helix; LZ, leucine zipper; SID, SID3-interacting domain; DCD, dimerization and cytoplasmic localization domain; TAD, transcriptional activation domain; TRD, transcriptional repression domain. The Glucose sensing domain contains six conserved regions named MONDO Conserved Region (MCR). Proteins size is not represented to scale.
Figure 4
Figure 4. Schematic representation of the biological activities regulated by the MAX/MLX network members
Green arrows and red lines indicate positive and negative regulation respectively. Dotted red lines indicate a functional connection that has not been directly investigated or for which only a limited amount of data is available. A) MYC centered view. B) MAX/MLX network centered view.
Figure 5
Figure 5. Comprehensive model of the MAX/MLX network and its role in determining cellular fates
External signals (top) determine the expression levels of the network members, which in turn promote alternative cellular state (bottom). High levels of MYCc sensitize cells to pro-apoptotic stimuli. Loss of function of MXD1, MNT or MONDOA further promotes apoptosis in MYC driven tumor models. MGA has been reported recurrently lost in leukemia and lung cancers. Because MAX and MLX are transcriptionally inert and have multiple heterodimerization partners, they have been excluded from the representation for simplicity.
Figure 6
Figure 6. Analysis of the MAX/MLX network in human cancer
A) Relative distribution of the network members across TCGA tissue types, each represented by a different color (“tumor type column”). “Sample” column: Pink normal tissue; Blue, Primary Tumor; Red, Acute Myeloid Leukemia; Grey, Metastatic tumor; Green Recurrent tumor. Due to the heterogeneity in expression, breast and lung samples have been excluded from this representation to more readily identify the distinct expression patterns of the other tumors. B) Pearson correlation of network member expression levels among all samples (including lung and breast). Orange: positive correlation, blue: negative correlation. C) Median of expression values within each tumor type (colored coded squares) are shown for each network member. Black dashed line, median expression of all genes across tumor types; Grey dashed lines, top and bottom 25% of genes.

References

    1. Lee CM, Reddy EP. The v-myc oncogene. Oncogene. 1999;18:2997–3003. - PubMed
    1. Vennstrom B, Sheiness D, Zabielski J, Bishop JM. Isolation and characterization of c-myc, a cellular homolog of the oncogene (v-myc) of avian myelocytomatosis virus strain 29. J Virol. 1982;42:773–779. - PMC - PubMed
    1. Sheiness D, Bishop JM. DNA and RNA from uninfected vertebrate cells contain nucleotide sequences related to the putative transforming gene of avian myelocytomatosis virus. J Virol. 1979;31:514–521. - PMC - PubMed
    1. Taub R, Kirsch I, Morton C, Lenoir G, Swan D, Tronick S, Aaronson S, Leder P. Translocation of the c-myc gene into the immunoglobulin heavy chain locus in human Burkitt lymphoma and murine plasmacytoma cells. Proc Natl Acad Sci U S A. 1982;79:7837–7841. - PMC - PubMed
    1. Dalla-Favera R, Bregni M, Erikson J, Patterson D, Gallo RC, Croce CM. Human c-myc onc gene is located on the region of chromosome 8 that is translocated in Burkitt lymphoma cells. Proc Natl Acad Sci U S A. 1982;79:7824–7827. - PMC - PubMed

Publication types

MeSH terms

Substances