. 2014 May 23;9(5):e98034.
doi: 10.1371/journal.pone.0098034. eCollection 2014.

Atomic force microscopy reveals a role for endothelial cell ICAM-1 expression in bladder cancer cell adherence

Affiliations

Atomic force microscopy reveals a role for endothelial cell ICAM-1 expression in bladder cancer cell adherence

Valérie M Laurent et al. PLoS One. .

Abstract

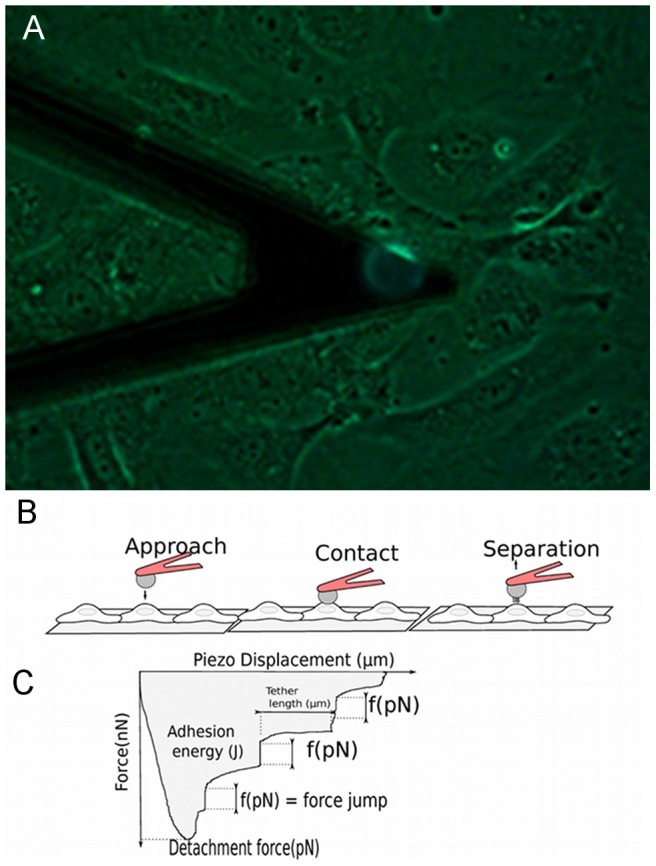
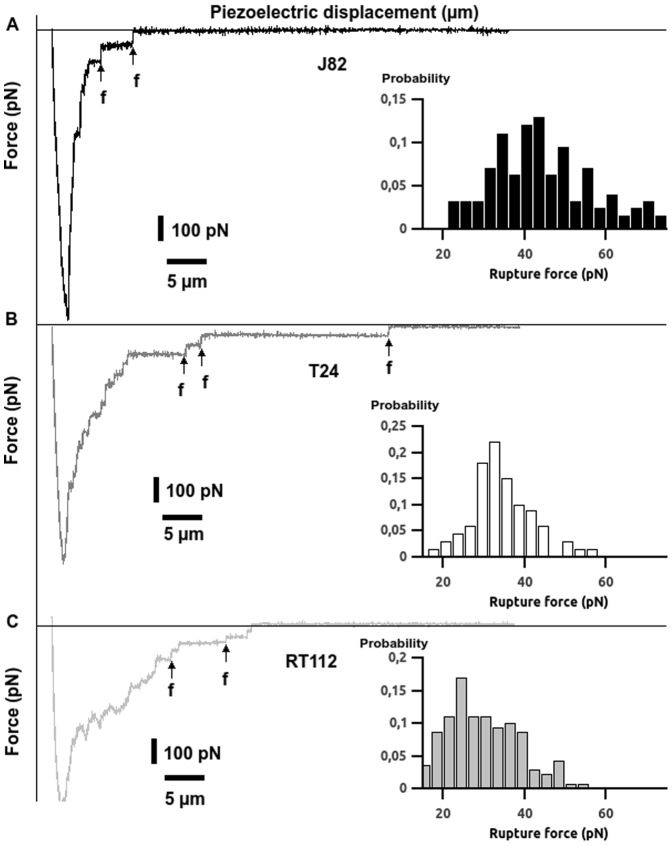
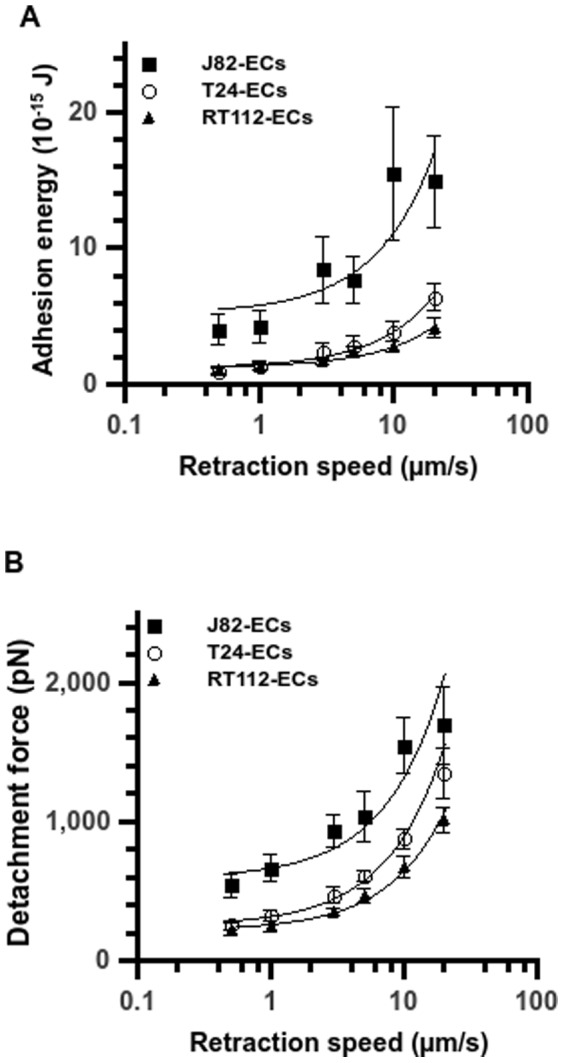
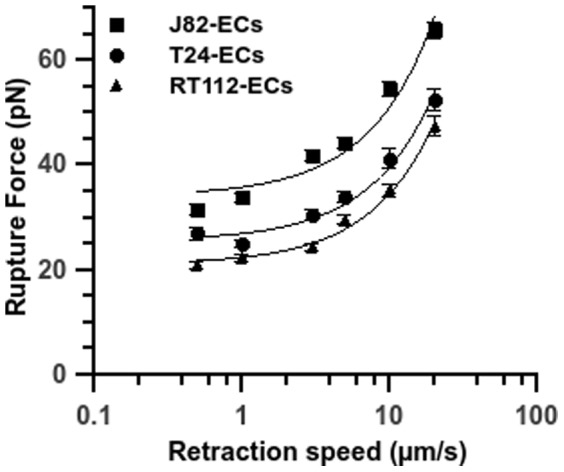
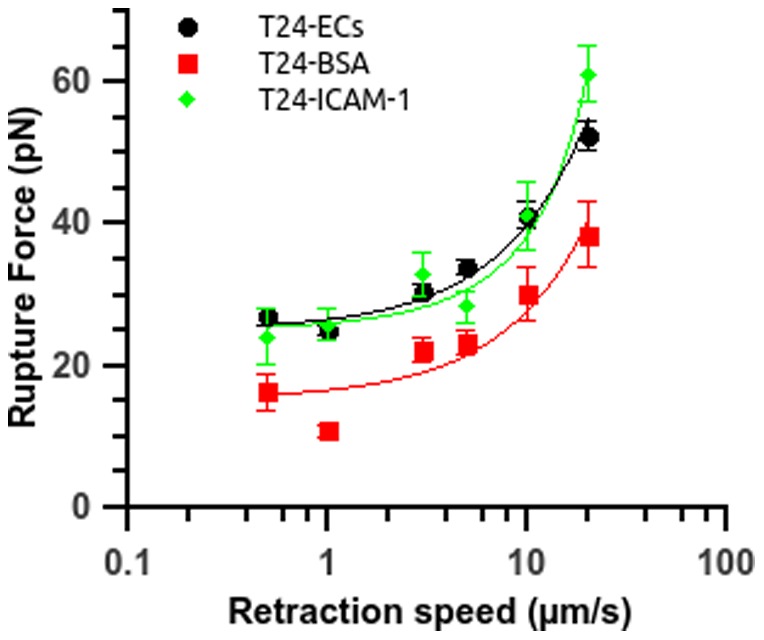
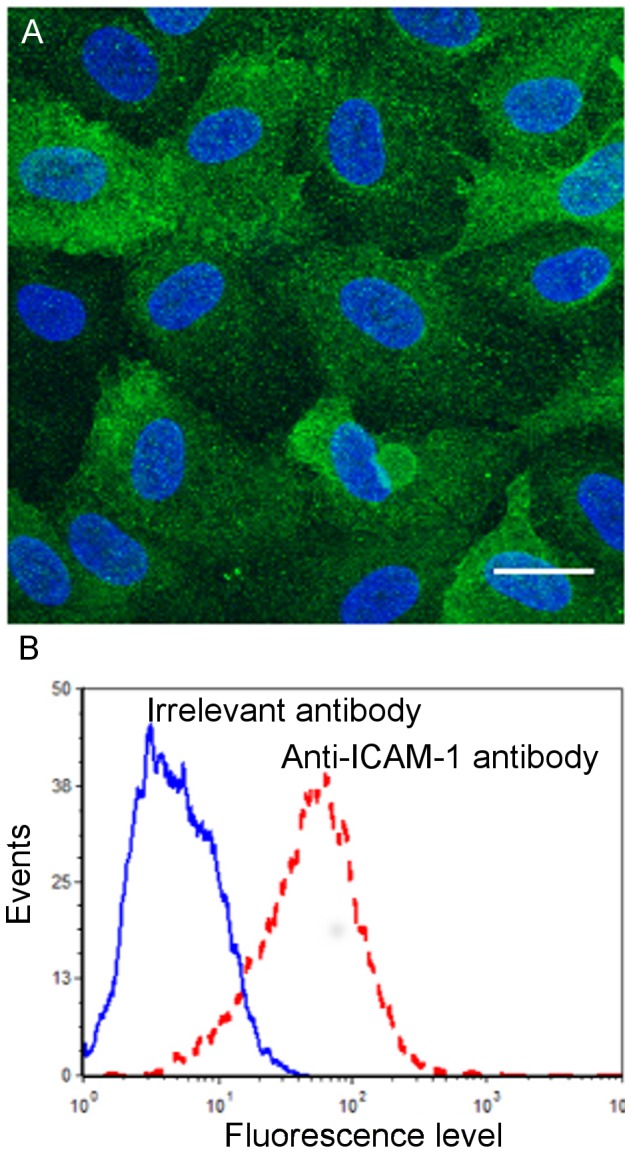
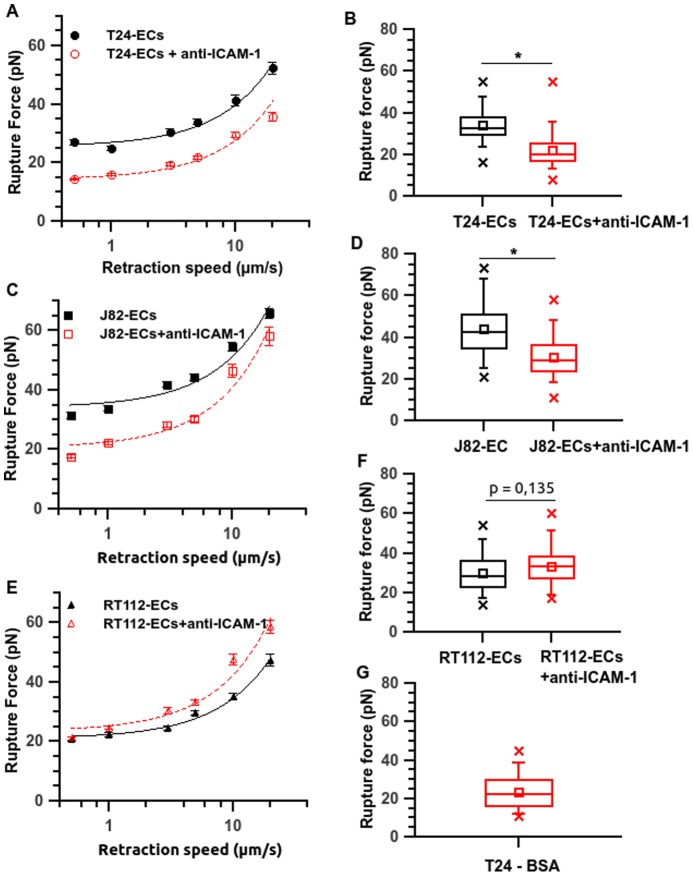
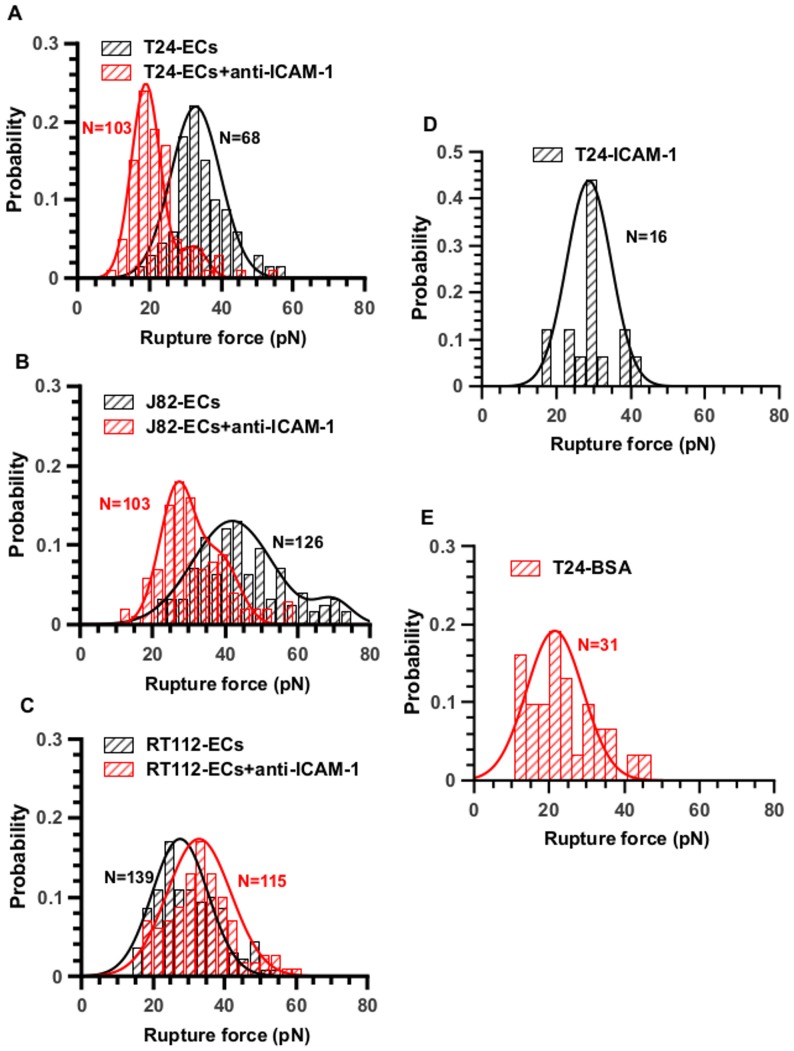
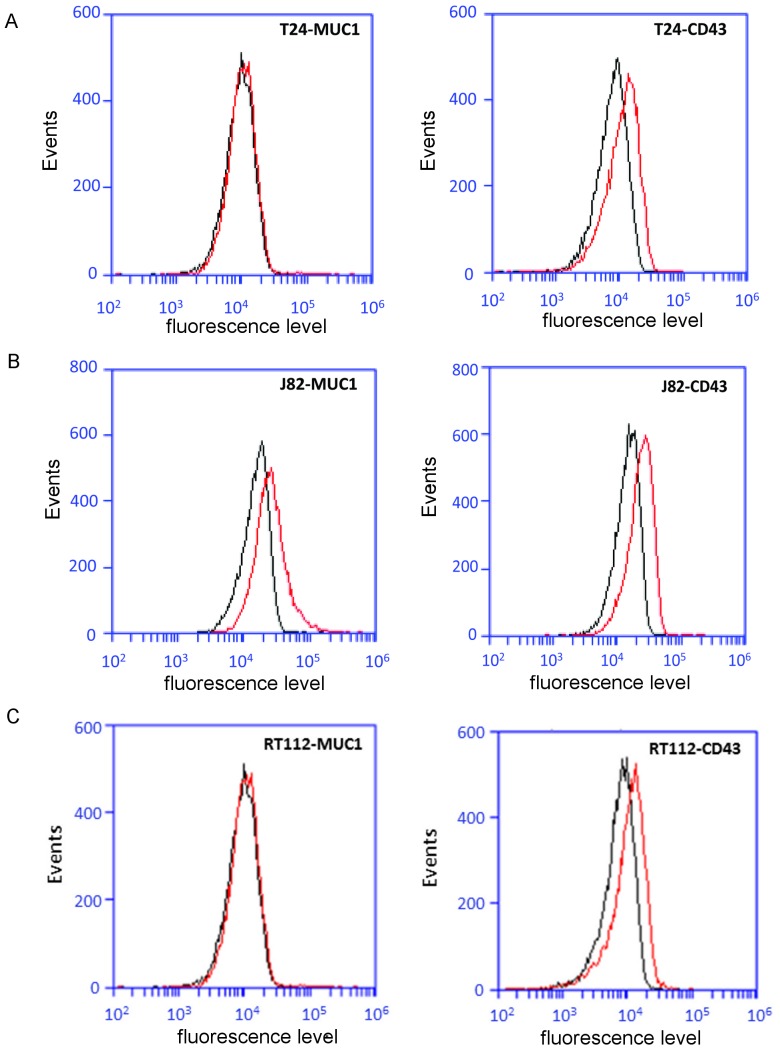
Cancer metastasis is a complex process involving cell-cell interactions mediated by cell adhesive molecules. In this study we determine the adhesion strength between an endothelial cell monolayer and tumor cells of different metastatic potentials using Atomic Force Microscopy. We show that the rupture forces of receptor-ligand bonds increase with retraction speed and range between 20 and 70 pN. It is shown that the most invasive cell lines (T24, J82) form the strongest bonds with endothelial cells. Using ICAM-1 coated substrates and a monoclonal antibody specific for ICAM-1, we demonstrate that ICAM-1 serves as a key receptor on endothelial cells and that its interactions with ligands expressed by tumor cells are correlated with the rupture forces obtained with the most invasive cancer cells (T24, J82). For the less invasive cancer cells (RT112), endothelial ICAM-1 does not seem to play any role in the adhesion process. Moreover, a detailed analysis of the distribution of rupture forces suggests that ICAM-1 interacts preferentially with one ligand on T24 cancer cells and with two ligands on J82 cancer cells. Possible counter receptors for these interactions are CD43 and MUC1, two known ligands for ICAM-1 which are expressed by these cancer cells.


Conflict of interest statement

Competing Interests: The authors have declared that no competing interests exist.

Figures

Figure 1
Figure 1. Interactions between cancer cells and ECs measured with AFM.
A) Photograph of the cantilever with attached fluorescent cancer cell above the HUVEC monolayer. White scale bar corresponds to 20 µm. B) Sketch of the approach-retraction method and typical retraction force curve in terms of the piezo displacement. The cancer cell approaches the EC monolayer at constant speed. Then the cell comes into contact with the EC during 10 seconds (under 1 nN applied force) to create several bond complexes over the adhesion area. The cantilever is retracted at constant velocity in order to detach the adhesive bonds. The retraction curve shows force jumps corresponding to the rupture force (f) of bonds. The adhesive energy (shaded area) represents the detachment work done by the cantilever to completely detach the cell from the substrate. The detachment force is the force necessary to stretch the cancer cell and the EC until bonds start to detach. Note that some force jumps can follow a plateau corresponding to tether formation.
Figure 2
Figure 2. AFM force curves and rupture force histograms for different cancer cell lines.
Typical force curves after 10s-contact between a TC and an EC on a HUVEC monolayer. Probability histograms with collected rupture forces f for J82 (A), T24 (B) and RT112 cells (C) at V = 5 µm/s. Vertical arrows denote examples of force jumps corresponding to breakup of receptor-ligand bonds.
Figure 3
Figure 3. Adhesion energies and detachment forces for different cancer cell lines.
Plot of the adhesion energy (A) and detachment force (B) vs. retraction speed after 10s-contact between a TC and an EC on a HUVEC monolayer. Three cancer cell lines: T24 (open circle), J82 (full square) and RT112 (full triangle). Data are plotted as mean ± standard error of the mean. The line is just a guide for the eye.
Figure 4
Figure 4. Rupture force vs. retraction velocity for different cancer cell lines.
Relationship between rupture force and retraction speed after 10s-contact between a TC and an EC on a HUVEC monolayer. Three cancer cell lines: T24 (full circle), J82 (full square) and RT112 (full triangle) interacting with the endothelium. Data are plotted as mean ± standard error of the mean. The line is just a guide for the eye.
Figure 5
Figure 5. Control experiments for T24 cells interacting with recombinant ICAM-1 or BSA coated surfaces.
Rupture force vs. retraction speed for T24 cells interacting either with a coated substrate or with ECs (circle). The substrate is coated with BSA 100 µg/ml (square) or recombinant ICAM-1 25 µg/ml (diamond). Data are plotted as mean ± standard error of the mean. The line is just a guide for the eye.
Figure 6
Figure 6. ICAM-1 expression on ECs.
A) Confocal microscopy image of an EC monolayer stained for ICAM-1 (green). HUVECs were fixed with PFA. Nuclei are stained in blue using DAPI. B) Quantification of ICAM-1 levels by FACS analysis (dashed line) in comparison with an irrelevant antibody (solid line).
Figure 7
Figure 7. ICAM-1 is involved in the interaction between cancer cells and ECs.
Rupture force vs. retraction speed after interaction between cancer cell and an EC, treated with an anti ICAM-1 antibody or not. Corresponding box-whisker plots show rupture forces at a retraction speed of 5 µm/s. (A, B) T24-EC, (C, D) J82-EC and (E, F) RT112-EC. As a comparison, the rupture force box plot is also shown for the T24-BSA interaction (panel G). For panels A, C and E, the line is just a guide for the eye. Data are plotted as mean ± standard error of the mean. Stars represent the p-value from GLMM statistical tests between parameters calculated on untreated and anti-ICAM-1-treated cells (*p≤0.05).
Figure 8
Figure 8. Distribution of rupture forces and effect of an anti-ICAM-1 antibody.
Effect of an anti-ICAM-1 antibody on cancer-EC interactions. Rupture force distributions are Gaussian with one or two peaks revealing the presence of receptor/ligand bonds or non specific interactions. Probability histograms of rupture force (V = 5 µm/s) for (A) T24-HUVEC, (B) J82-HUVEC, (C) RT112-HUVEC. Black histograms represent interaction cancer-cell and EC without antibody whereas red ones show the force distribution after using the antibody. Panels D (T24-ICAM-1) and E (T24-BSA) show the rupture force probabilities for T24 cells in contact with coated substrates. The number N of events is indicated on the histograms.
Figure 9
Figure 9. Expression of CD43 and MUC1 by the three bladder cell lines used in this study.
Expression levels of CD43 and MUC1 (red line) by FACS analysis in comparison with an irrelevant antibody (black line): (A, D) T24 cells, (B, E) J82 cells and (C, F) RT112 cells.

References

    1. Miles FL, Pruitt FL, van Golen KL, Cooper CR (2008) Stepping out of the flow: capillary extravasation in cancer metastasis. Clin Exp Metastasis 25: 305–324. - PubMed
    1. Steeg PS (2006) Tumor metastasis: mechanistic insights and clinical challenges. Nat Med. 12: 895–904. - PubMed
    1. Chotard-Ghodsnia R, Haddad O, Leyrat A, Drochon A, Verdier C, et al. (2007) Morphological analysis of tumor cell/endothelial cell interactions under shear flow. J Biomech 40: 335–344. - PMC - PubMed
    1. Haddad O, Chotard-Ghodsnia R, Verdier C, Duperray A (2010) Tumor cell/endothelial cell tight contact upregulates endothelial adhesion molecule expression mediated by NFkB: differential role of the shear stress. Exp. Cell Research 316: 615–626. - PubMed
    1. Strell C, Entschladen F (2008) Extravasation of leukocytes in comparison to tumor cells. Cell Commun Signal 6: 1–13. - PMC - PubMed

Publication types