. 2014 Oct 23;33(43):5109-20.
doi: 10.1038/onc.2014.125. Epub 2014 May 26.

MCT-1 expression and PTEN deficiency synergistically promote neoplastic multinucleation through the Src/p190B signaling activation

Affiliations
Free PMC article

MCT-1 expression and PTEN deficiency synergistically promote neoplastic multinucleation through the Src/p190B signaling activation

M-H Wu et al. Oncogene. .
Free PMC article

Abstract

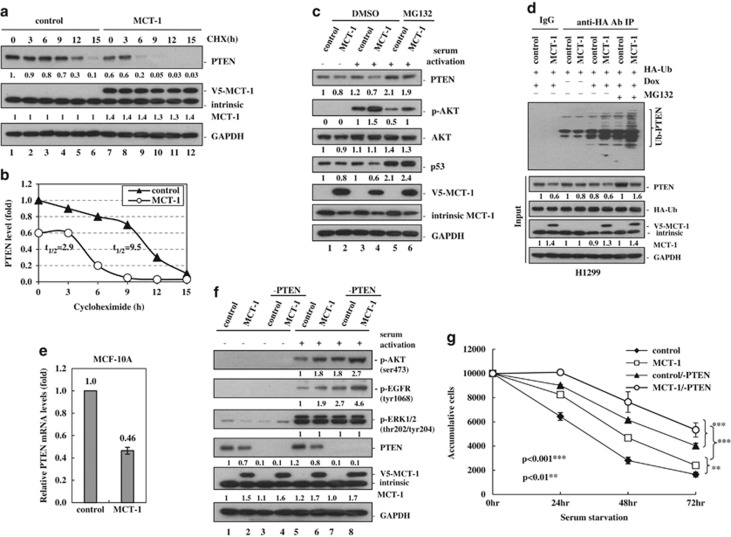
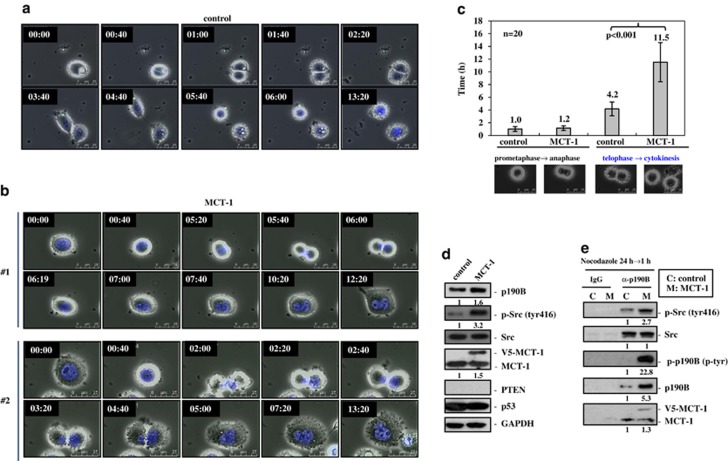
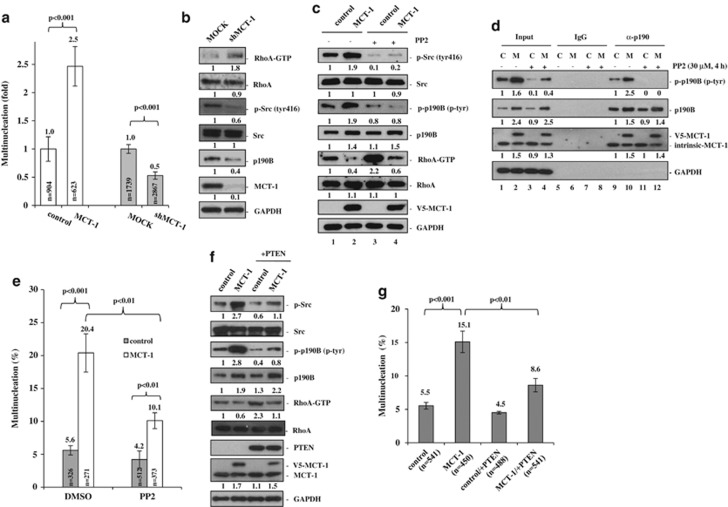
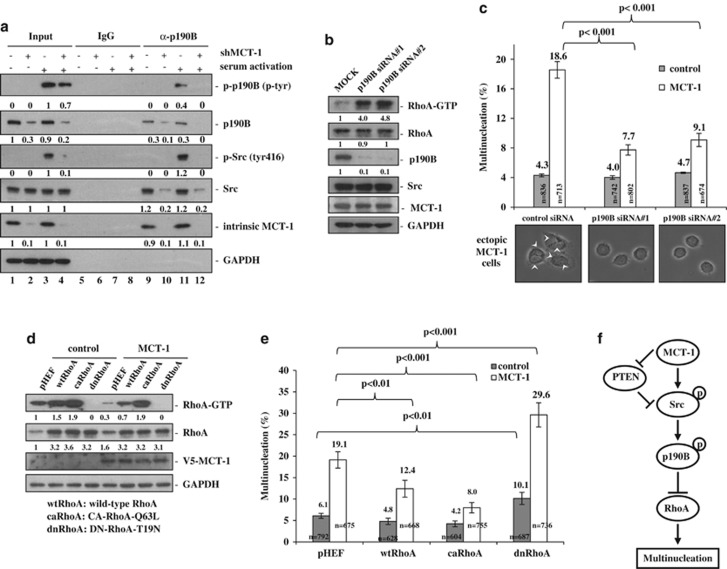
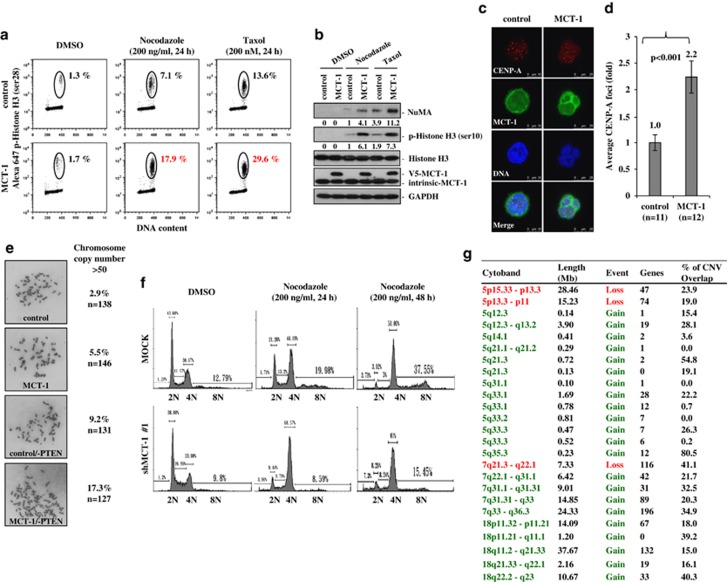
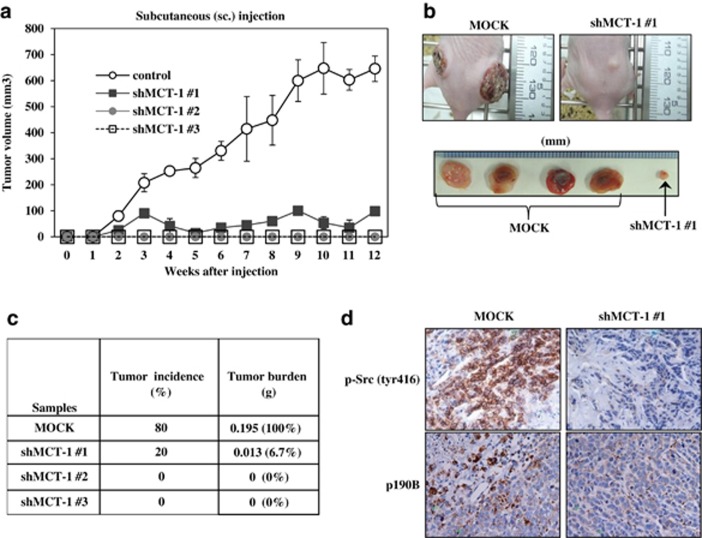
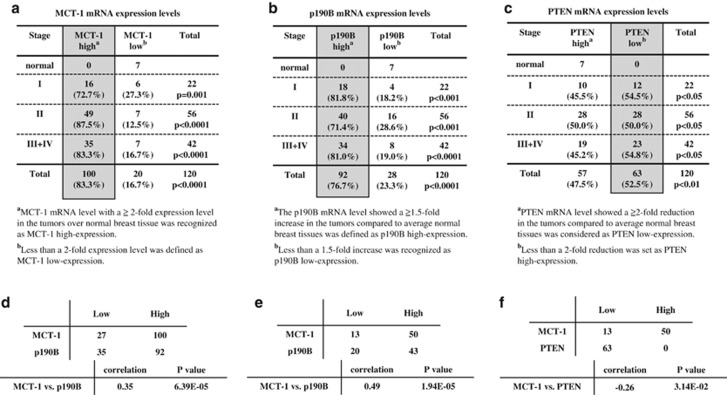
Multinucleation is associated with malignant neoplasms; however, the molecular mechanism underlying the nuclear abnormality remains unclear. Loss or mutation of PTEN promotes the development of malignant tumors. We now demonstrate that increased expression of the oncogene MCT-1 (multiple copies in T-cell malignancy 1) antagonizes PTEN gene presentation, PTEN protein stability and PTEN functional activity, thereby further promoting phosphoinositide 3 kinase/AKT signaling, survival rate and malignancies of the PTEN-deficient cells. In the PTEN-null cancer cells, MCT-1 interacts with p190B and Src in vivo, supporting that they are in proximity of the signaling complexes. MCT-1 overexpression and PTEN loss synergistically augments the Src/p190B signaling function that leads to inhibition of RhoA activity. Under such a condition, the incidence of mitotic catastrophes including spindle multipolarity and cytokinesis failure is enhanced, driving an Src/p190B/RhoA-dependent neoplastic multinucleation. Targeting MCT-1 by the short hairpin RNA markedly represses the Src/p190B function, improves nuclear structures and suppresses xenograft tumorigenicity of the PTEN-null breast cancer cells. Consistent with the oncogenic effects in vitro, clinical evidence has confirmed that MCT-1 gene stimulation is correlated with p190B gene promotion and PTEN gene suppression in human breast cancer. Accordingly, MCT-1 gene induction is recognized as a potential biomarker of breast tumor development. Abrogating MCT-1 function may be a promising stratagem for management of breast cancer involving Src hyperactivation and/or PTEN dysfunction.


Figures

Figure 1
Figure 1
MCT-1 decreases PTEN expression and increases cell viability. MCF-10A cells without (control) or with (MCT-1) MCT-1 overexpression were examined. (a) The cells were treated with 200 μM cyclohexamide (CHX) for the indicated time points. PTEN degradation was analyzed. (b) PTEN half-life in the control and ectopic MCT-1 cells were indicated. (c) The levels of PTEN, p53 and active-phospho-AKT (ser473) were examined without (dimethylsulfoxide (DMSO)) or with MG132 treatment. (d) An in vivo ubiquitination assay was conducted. The H1299/TR cells were induced by doxycycline and transfected with the vector encoding HA-ubiquitin. The ubiquitinated PTEN (Ub-PTEN) was IP with anti-HA Ab and detected by PTEN Ab. (e) PTEN mRNA levels were analyzed by quantitative real-time polymerase chain reaction. (f) The active phosphorylated AKT and EGFR were analyzed in the MCF-10A cells with MCT-1 expression and PTEN knockdown (MCT-1/−PTEN) and compared with the control cells depleting PTEN (control/−PTEN) and the PTEN-proficient cells (control, MCT-1) upon serum activation for 30 min after 24 h starvation. (g) The cells were starved for various time and surviving cells were determined by MTT (3-(4, 5-dimethylthiazol-2-yl)-2, 5-diphenyltetrazolium bromide) assay. **p<0.01 and ***p<0.001.
Figure 2
Figure 2
Enhanced MCT-1 expression induces abscission failure and cell–cell fusion. The PTEN-null MDA-MB-468 cancer cells were analyzed. (a) Time-lapse microscopy was performed and it revealed that the vector control cells entered metaphase (0:40) and completed the mitotic division at 6:00 (h:min). (b) Time-lapse microscopy identified that MCT-1 expression impaired cytokinesis and increased cell–cell fusion, thereby generating giant multinucleated cells. Two typical processes of binucleation were indicated (nos. 1 and 2). (c) The time length in each mitotic stage was analyzed. The MCT-1-overexpressing cells spent longer time in late mitosis from telophase to cytokinesis than the control cells. (d) The cells were activated by the serum for 30 min after starvation for 24 h. Src phosphorylation and p190B expression were enhanced by the ectopic MCT-1 expression (V5-MCT-1). (e) The p190B was IP after the cells treated by nocodazole for 24 h and released for 1 h. The intrinsic/ectopic MCT-1 was co-IP with the active Src. The active phosphorylated p190B and Src were highly induced by MCT-1.
Figure 3
Figure 3
MCT-1 induces multinucleation through the Src signaling pathway. MDA-MB-468 cells were examined. (a) The multinuclear effect was compared between the vector control (control), ectopic MCT-1-expressing (MCT-1), non-silencing control (MOCK) and MCT-1 silencing (shMCT-1) cells. Multinuclear frequencies were increased by MCT-1 overexpression but suppressed by MCT-1 knockdown. (b) The active phosphorylated RhoA (RhoA-GTP) and Src (tyr416) and p190B amounts were examined before and after MCT-1 depletion. Unlike RhoA activation, the levels of p-Src and p190B were repressed by MCT-1 knockdown. (c) Cells were reactivated with serum for 30 min after starvation for 24 h and treatment with an Src inhibitor (PP2) for 4 h. PP2 suppressed the active Src (tyr416) and p190B (p-tyr) but increased RhoA-GTP in the ectopic MCT-1 cells. (d) Immunoprecipitation of p190B was conducted and PP2 decreased the active p190B (p-tyr) (lanes 11 and 12) but not the p190B/MCT-1 interaction (lane 12). (e) PP2 attenuated the multinuclearity promoted by MCT-1. (f) The cells with or without PTEN restoration were analyzed after starving for 24 h and reactivating with serum for 30 min. In contrast to the reduced phosphorylation of Src (tyr416) and p190B (p-tyr), the RhoA-GTP was increased in the ectopic MCT-1 cells expressing PTEN (MCT-1/+PTEN). (g) Multinuclear frequencies and numbers of cells scored in each group were indicated. Re-expression of PTEN inhibited the multinucleation induced by MCT-1.
Figure 4
Figure 4
MCT-1 promotes multinucleation dependent on the p190B/RhoA function. MDA-MB-468 cells were analyzed. (a) Cells were reactivated for 30 min after starving for 24 h. Immunoprecipitation of p190B was conducted and was it observed that MCT-1 knockdown (shMCT-1) reduced the signal activation and interaction of Src/p190B. (b) RhoA activation and multinucleation were analyzed after depleting p190B by  shRNA (nos. 1 and 2). (c) Knockdown of p190B activated RhoA but suppressed the MCT-1-induced multinuclearity. (d) The vectors encoding wtRhoA, caRhoA and dnRhoA were transfected to modify RhoA activity. (e) MCT-1-induced multinucleation was prevented by caRhoA and wtRhoA but promoted by dnRhoA. (f) Overexpression of MCT-1 inhibits PTEN function and works through the Src/p190B/RhoA signaling cascade to induce multinucleation.
Figure 5
Figure 5
MCT-1 status affects mitotic progression and chromosome stability. MDA-MB-468 (ad and g) and MCF-10A (e and f) cells were analyzed. (a) Upon treatment with nocodazole and taxol, mitotic populations were examined by flow cytometry after immunostaining the phosphorylated histone H3 (ser28). (b) The levels of NuMA and phospho-histone H3 (ser10) expression were examined upon nocodazole and taxol treatment. (c, d) CENP-A foci were evaluated in the multinuclear interphase cells, and they were relatively increased through MCT-1 induction. (e) Mitotic spread studies identified more amplified chromosome copy number (>50) upon MCT-1 overexpression and PTEN loss (MCT-1/−PTEN). (f) Cell cycle profiling and polyploidy populations were analyzed by flow cytometry after nocodazole treatment. MCT-1 knockdown (shMCT-1) suppressed the polyploidization. (g) Array-based comparative genomic hybridization (array CGH) study identified the exact locations of the chromosome loss (red) and gain (green) at chromosomes 5, 7 and 18 regions due to MCT-1 overexpression. The ratios of chromosome copy number variation (percentage of copy number variation (%CNV)) are indicated.
Figure 6
Figure 6
Knockdown of MCT-1 inhibits tumorigenicity. (a) MDA-MB-468 cells were subcutaneously (s.c.) injected into the nude mice. Tumor volumes were measured weekly. (b) Mice were killed at the end point of 13 weeks. Tumor burdens were reduced markedly upon MCT-1 knockdown (shMCT-1 no. 1) compared with the non-silence control cells (MOCK). (c) Tumor incidences and burdens were analyzed. MCT-1 depletion (shMCT-1 nos. 1, 2 and 3) significantly inhibited tumor growth. (d) Immunohistochemical study detected low levels of p190B and active Src (tyr416) in the tumors emerged from the MCT-1 knockdown cells.
Figure 7
Figure 7
Clinical relevance of MCT-1, p190B and PTEN expression in human breast cancers. TissueScan breast cancer tissue cDNA arrays (BCRT I, III and IV) were analyzed by quantitative real-time polymerase chain reaction. (a) Relative MCT-1 expression levels in human breast cancers were studied. The MCT-1 mRNA level identified in each tumor sample was normalized to β-actin mRNA and calibrated to the overall mean of MCT-1 mRNA level in normal breast tissues. (b) Relative p190B expression levels in human breast cancers were studied. The p190B mRNA level detected in each tumor biopsy was normalized to β-actin mRNA and compared with the mean of p190B mRNA level in normal breast tissues. (c) Relative PTEN expression levels in human breast cancers were analyzed. The PTEN mRNA level identified in each tumor sample was normalized to β-actin mRNA and calibrated to the overall mean of PTEN mRNA level in normal breast tissues. The comparison between normal breast tissues and different stages of breast tumors were analyzed by the X2 test (ac). A P-value of <0.05 is considered to be statistically significant. (d) The correlation between the expression of MCT-1 and p190B was evaluated. If and only if MCT-1 or p190B expression in each sample is larger than the expression in any of the normal tissues is defined as ‘high'. Based on this definition of ‘high' and ‘low' expression, the dichotomized data for the 127 samples, MCT-1 and p190B expression are positively correlated (P-value 6.39 × 10⁻⁵). (e) The PTEN expression levels in breast tumors showing a twofold lower than average of the normal breast tissues were analyzed (n=63). A significant positive correlation between the MCT-1 and p190B expression was identified (P-value 1.94 × 10⁻⁵). (f) A negative correlation between the MCT-1 and PTEN expression was identified in the PTEN-low tumors (n=63) (P-value 3.14 × 10²). The Pearson's correlation coefficient is used to measure the relationship between two indicated genes (df).

Similar articles

Cited by

References

    1. Cantley LC, Neel BG. New insights into tumor suppression: PTEN suppresses tumor formation by restraining the phosphoinositide 3-kinase/AKT pathway. Proc Natl Acad Sci USA. 1999;96:4240–4245. - PMC - PubMed
    1. Guigon CJ, Zhao L, Willingham MC, Cheng SY. PTEN deficiency accelerates tumour progression in a mouse model of thyroid cancer. Oncogene. 2009;28:509–517. - PMC - PubMed
    1. Lynch ED, Ostermeyer EA, Lee MK, Arena JF, Ji H, Dann J, et al. Inherited mutations in PTEN that are associated with breast cancer, Cowden disease, and juvenile polyposis. Am J Hum Genet. 1997;61:1254–1260. - PMC - PubMed
    1. Simpson L, Parsons R. PTEN: life as a tumor suppressor. Exp Cell Res. 2001;264:29–41. - PubMed
    1. Yin Y, Shen WH. PTEN: a new guardian of the genome. Oncogene. 2008;27:5443–5453. - PubMed

Publication types

Substances