. 2014 Aug;80(15):4745-56.
doi: 10.1128/AEM.00599-14.

Metabolic shift of Escherichia coli under salt stress in the presence of glycine betaine

Metabolic shift of Escherichia coli under salt stress in the presence of glycine betaine

A Metris et al. Appl Environ Microbiol. 2014 Aug.

Abstract

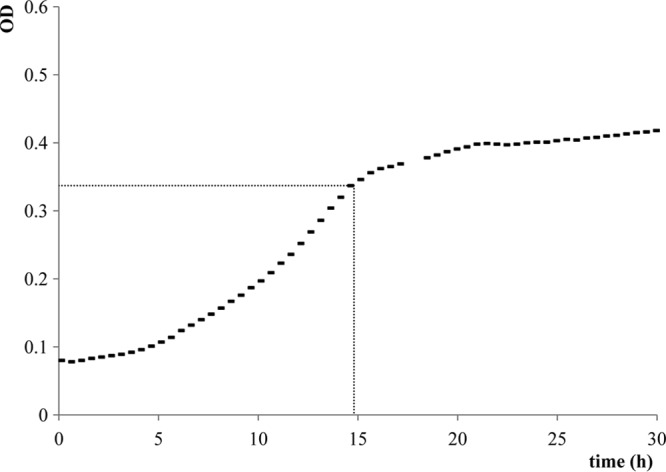
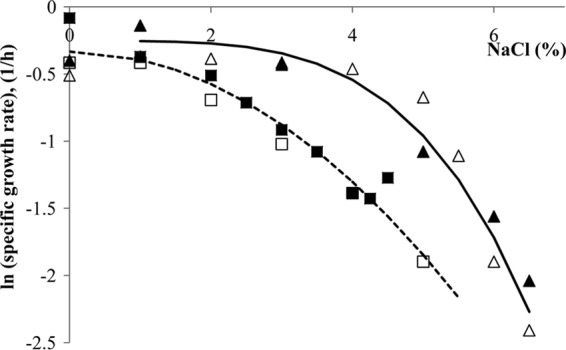
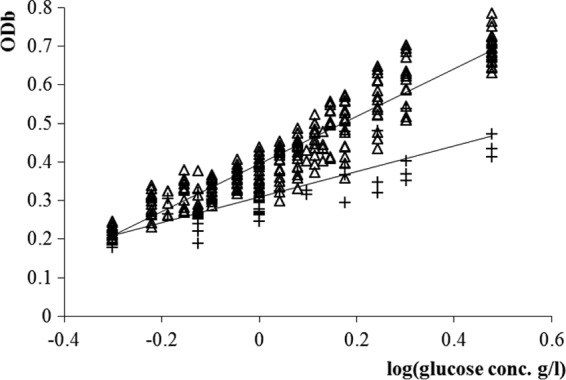
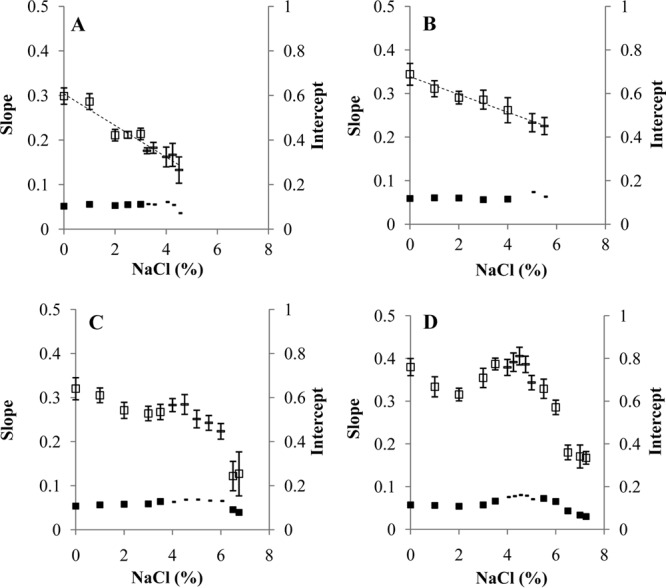
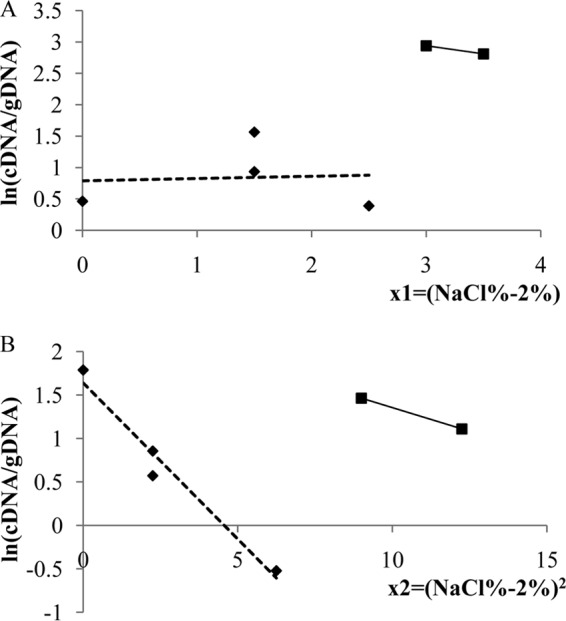
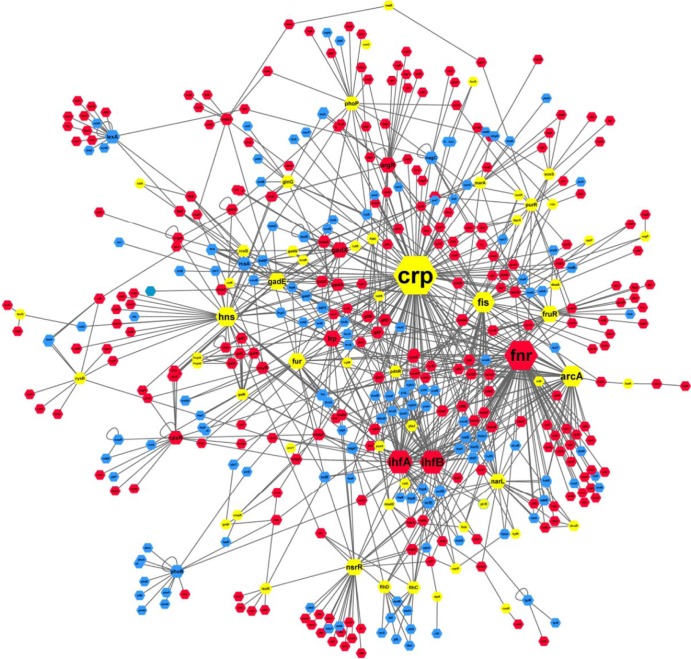
An important area of food safety focuses on bacterial survival and growth in unfavorable environments. In order to understand how bacteria adapt to stresses other than nutrient limitation in batch cultures, we need to develop mechanistic models of intracellular regulation and metabolism under stress. We studied the growth of Escherichia coli in minimal medium with added salt and different osmoprotectants. To characterize the metabolic efficiency with a robust parameter, we identified the optical density (OD) values at the inflection points of measured "OD versus time" growth curves and described them as a function of glucose concentration. We found that the metabolic efficiency parameter did not necessarily follow the trend of decreasing specific growth rate as the salt concentration increased. In the absence of osmoprotectant, or in the presence of proline, the metabolic efficiency decreased with increasing NaCl concentration. However, in the presence of choline or glycine betaine, it increased between 2 and 4.5% NaCl before declining at 5% NaCl and above. Microarray analysis of the transcriptional network and proteomics analysis with glycine betaine in the medium indicated that between 4.5 and 5% NaCl, the metabolism switched from aerobic to fermentative pathways and that the response to osmotic stress is similar to that for oxidative stress. We conclude that, although the growth rate appeared to decrease smoothly with increasing NaCl, the metabolic strategy of cells changed abruptly at a threshold concentration of NaCl.


Figures

FIG 1
FIG 1
“OD versus time” curve with 0.9 g/liter of glucose and 3% NaCl. No maximum OD can be defined as a parameter of the sigmoid curve, instead its inflection (break) point is considered, where the second derivative of the curve turns from positive to negative. It can be assumed there is a sudden change in the system at this point. On this plot, the time at the inflection is ca. 15 h, and the respective ODb value is ca. 0.34.
FIG 2
FIG 2
Specific growth rate decreases with increasing NaCl concentration and depends on the intracellular osmoprotectant. The osmoprotectants added to the medium were as follows: ◼, no osmoprotectant; ◻, proline; ▲, glycine betaine; △, choline. The logarithm of the specific growth rate with no osmoprotectant and proline in the medium was fitted by a linear function of the square of the NaCl concentration, while that of the specific growth rate with glycine betaine and choline in the medium was fitted by a linear function of the fourth power of the NaCl concentration.
FIG 3
FIG 3
For a given NaCl concentration, ODb measurements depend on the logarithm of glucose concentration in a linear manner. We used these linear relationships to compare the metabolic efficiency in different conditions. △, NaCl concentration ranging from 0% to 5.5%; +, NaCl >6% in minimal medium in the presence of glycine betaine; continuous lines represent the regression. We observed a significant decrease in metabolic efficiency when NaCl was >6%.
FIG 4
FIG 4
The effect of NaCl on metabolic efficiency is not always correlated to the growth rate. Metabolic efficiency [represented by the slope and intercept of BMc versus log(glucose)] as a function of the salt concentration and the osmoprotectant in the medium: (A) no osmoprotectant; (B) proline; (C) choline; (D) glycine betaine. The left-hand axis corresponds to the slope and its standard error (◻); the right hand axis is for the intercept (◼). A dash represents a linear trend estimation based on less than 10 data points.
FIG 5
FIG 5
Examples of significant changes in gene expression pattern when NaCl increased from 4.5% to 5%. (A) Relative expression of the osmotic stress gene osmC as a function of the shifted NaCl concentration; (B) relative expression of the ompF gene as a function of the square root of the shifted NaCl concentration. The lines represent linear regressions with a 2-regime model with a switch between 4.5 and 5% NaCl.
FIG 6
FIG 6
Transcriptional network affected by the change of regime. The nodes represent either genes or transcription factors, the edges interactions between them, based on RegulonDB. Red/blue nodes, up/downregulated when stress reaches a critical level; yellow nodes, transcription factors linked to genes that were significantly up- or downregulated but themselves not significantly affected.

Similar articles

Cited by

References

    1. Goel A, Wortel MT, Molenaar D, Teusink B. 2012. Metabolic shifts: a fitness perspective for microbial cell factories. Biotechnol. Lett. 34:2147–2160. 10.1007/s10529-012-1038-9 - DOI - PMC - PubMed
    1. Feist AM, Henry CS, Reed JL, Krummenacker M, Joyce AR, Karp PD, Broadbelt LJ, Hatzimanikatis V, Palsson BO. 2007. A genome-scale metabolic reconstruction for Escherichia coli K-12 MG1655 that accounts for 1260 ORFs and thermodynamic information. Mol. Syst. Biol. 3:121. 10.1038/msb4100155 - DOI - PMC - PubMed
    1. Schuetz R, Kuepfer L, Sauer U. 2007. Systematic evaluation of objective functions for predicting intracellular fluxes in Escherichia coli. Mol. Syst. Biol. 3:119. 10.1038/msb4100162 - DOI - PMC - PubMed
    1. Teusink B, Wiersma A, Molenaar D, Francke C, de Vos WM, Siezen RJ, Smid EJ. 2006. Analysis of growth of Lactobacillus plantarum WCFS1 on a complex medium using a genome-scale metabolic model. J. Biol. Chem. 281:40041–40048. 10.1074/jbc.M606263200 - DOI - PubMed
    1. Fischer E, Sauer U. 2003. A novel metabolic cycle catalyzes glucose oxidation and anaplerosis in hungry Escherichia coli. J. Biol. Chem. 278:46446–46451. 10.1074/jbc.M307968200 - DOI - PubMed

Publication types

MeSH terms

Associated data