. 2014 Sep;28(9):3930-41.
doi: 10.1096/fj.13-249318. Epub 2014 May 23.

MicroRNA-1 regulates chondrocyte phenotype by repressing histone deacetylase 4 during growth plate development

Affiliations

MicroRNA-1 regulates chondrocyte phenotype by repressing histone deacetylase 4 during growth plate development

Pengcui Li et al. FASEB J. 2014 Sep.

Abstract

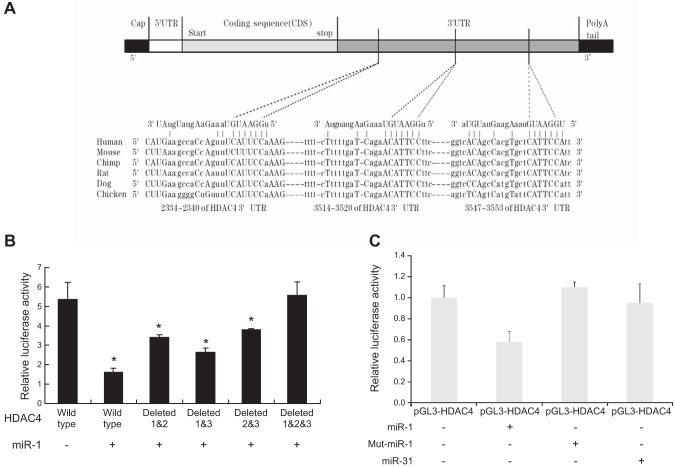
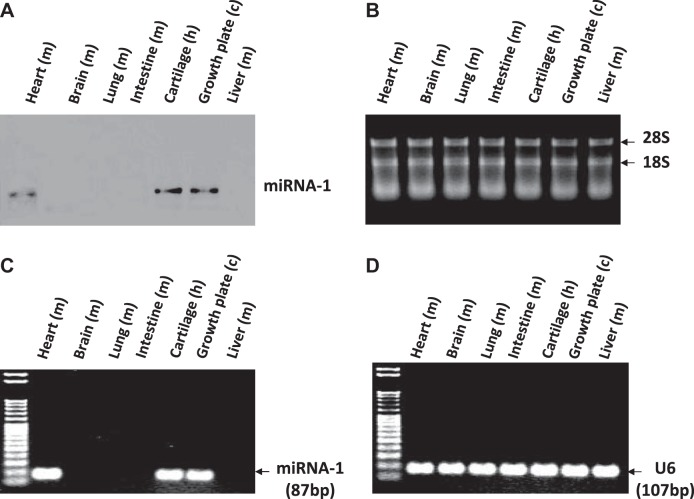
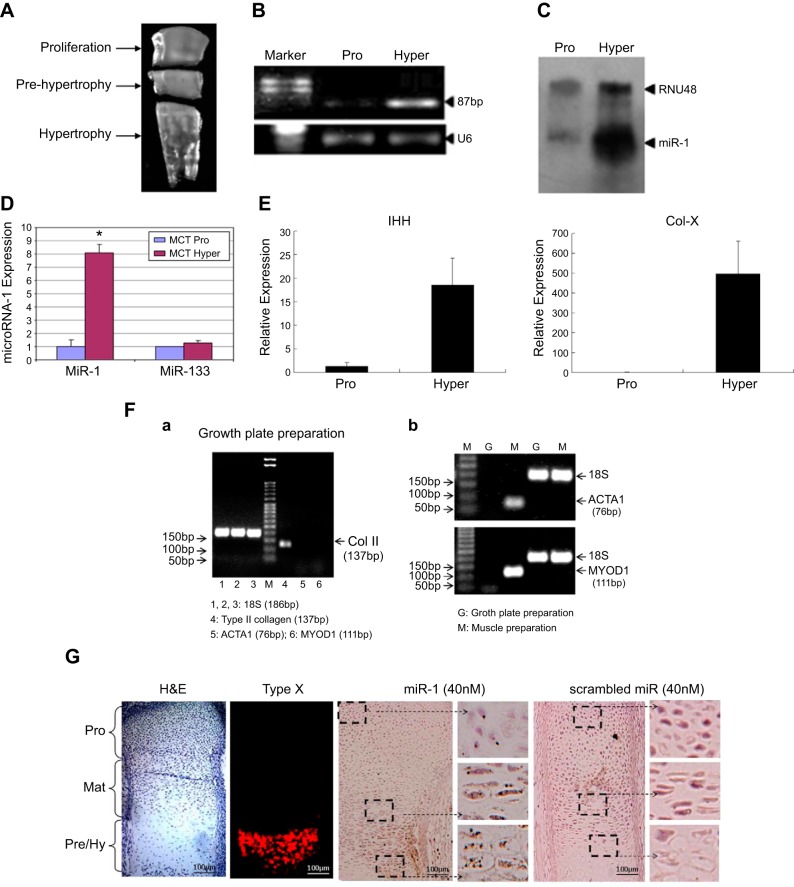
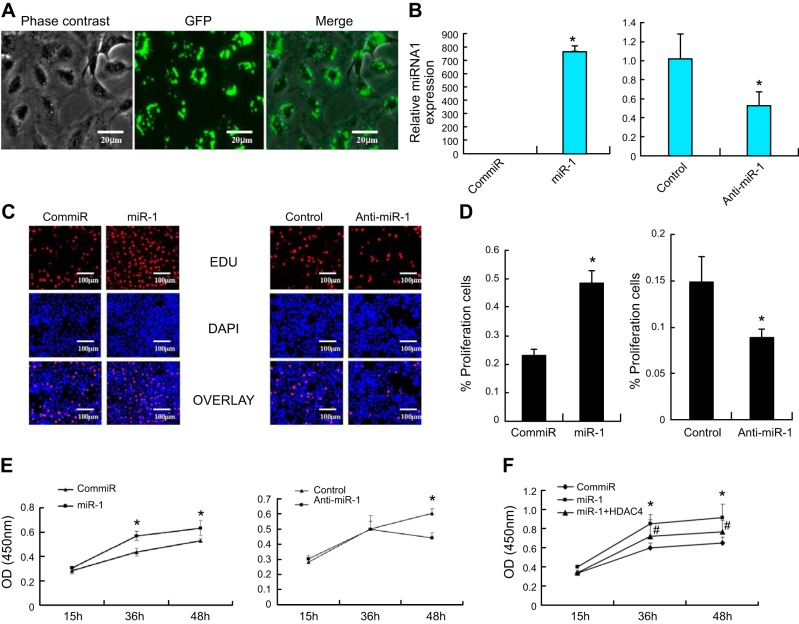
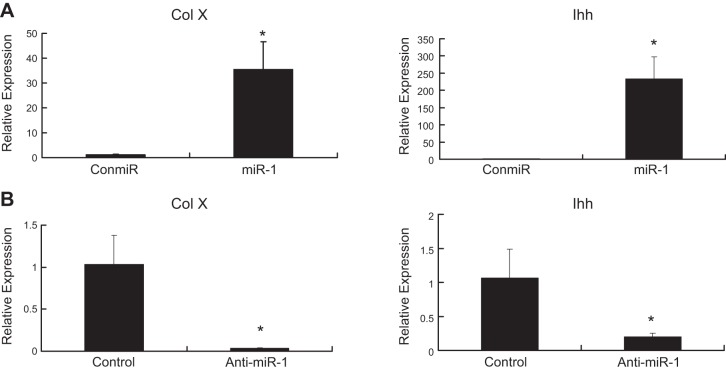
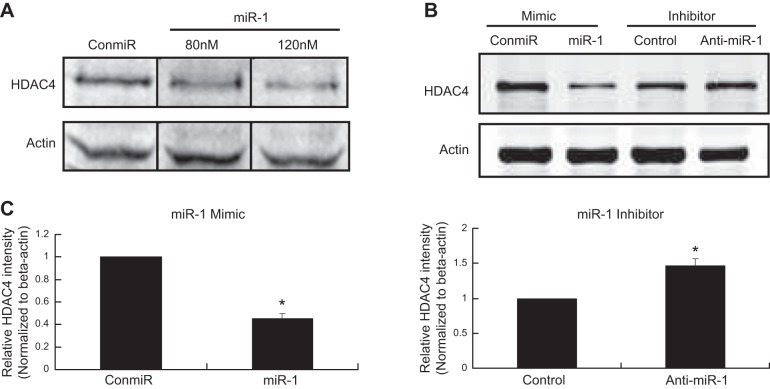
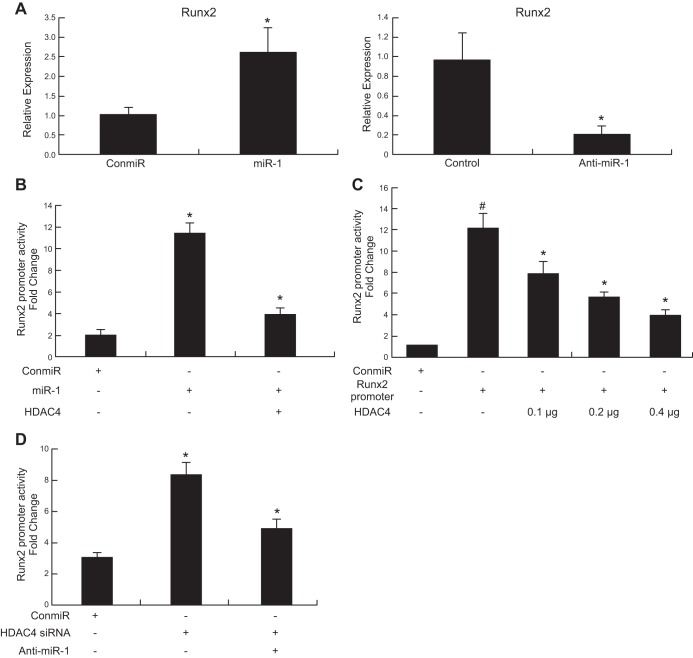
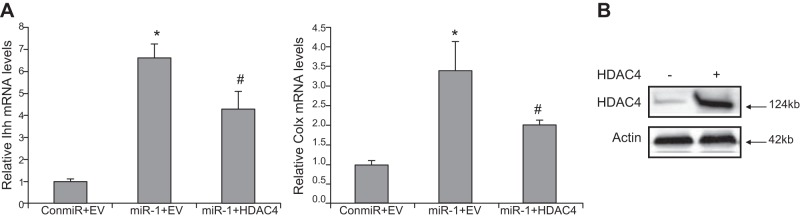
MicroRNAs (miRs) are noncoding RNAs (17-25 nt) that control translation and/or mRNA degradation. Using Northern blot analysis, we identified that miR-1 is specifically expressed in growth plate cartilage in addition to muscle tissue, but not in brain, intestine, liver, or lung. We obtained the first evidence that miR-1 is highly expressed in the hypertrophic zone of the growth plate, with an 8-fold increase compared with the proliferation zone; this location coincides with the Ihh and Col X expression regions in vivo. MiR-1 significantly induces chondrocyte proliferation and differentiation. We further identified histone deacetylase 4 (HDAC4) as a target of miR-1. HDAC4 negatively regulates chondrocyte hypertrophy by inhibiting Runx2, a critical transcription factor for chondrocyte hypertrophy. MiR-1 inhibits both endogenous HDAC4 protein by 2.2-fold and the activity of a reporter gene bearing the 3'-untranslated region (UTR) of HDAC4 by 3.3-fold. Conversely, knockdown of endogenous miR-1 relieves the repression of HDAC4. Deletion of the miR-1 binding site in HDAC4 3'-UTR or mutated miR-1 abolishes miR-1-mediated inhibition of the reporter gene activity. Overexpression of HDAC4 reverses miR-1 induction of chondrocyte differentiation markers Col X and Ihh. HDAC4 inhibits Runx2 promoter activity in a dosage-dependent manner. Thus, miR-1 plays an important role in the regulation of the chondrocyte phenotype during the growth plate development via direct targeting of HDAC4.

Keywords: HDAC4; Runx2; collagen X; differentiation.


Figures

Figure 6.
Figure 6.
Repression of HDAC4 3′-UTR by miR-1. A) Sequences of the miR-1 target sites in the 3′-UTR of HDAC4 in different species. MiR-1 is conserved in different mammalian species. The predicted seeding sites were shown in HDAC4 3′-UTR (position: 2334–2340, 3514–3520, 3547–3553). B) COS-1 cell was cotransfected with different deleted binding sites of HDAC4 3′-UTR plasmid and/or miR-1 mimic: 1) wild type containing 3 binding sites, 2) wild type+miR-1 (120 nM), 3) binding sites 1 and 2 deleted + miR-1 (120 nM), 4) binding sites 1 and 3 deleted + miR-1 (120 nM), 5) binding sites 2 and 3 deleted + miR-1 (120 nM), and 6) all three binding sites deleted + miR-1 (120 nM). Forty-eight hours after transfection, the cells were harvested for quantification of dual-luciferase activities. Data are the means of 3 independent experiments, with sd indicated. *P < 0.05, compared with HDAC4 wild type. C) COS-1 cell was cotransfected with pGL3-HDAC4 3′-UTR luciferase report and miR-1 or miR-31 or miR-1mut. Luciferase activity was determined 48 h after transfection. Data are the means of 3 independent experiments, with sd indicated. *P < 0.05.
Figure 1.
Figure 1.
Expression of miR-1 in different tissues. A) Northern blot detected miR-1 in mouse heart, human articular cartilage, and chicken growth plate from d 17 embryos, but not in mouse brain, lung, intestine, or liver. B) The stained gel of total RNA showed 28S/18S ladder as loading control. C) RT-PCR detected miR-1 in mouse heart, human articular cartilage, and chicken growth plate from d 17 embryos, but not in other tissues. D) U6 was used as a loading control.
Figure 2.
Figure 2.
MiR-1 is highly expressed in hypertrophic chondrocytes. A) Proliferative and hypertrophic zones were isolated from d 17 chicken tibia growth plates, and the middle part was discarded. B, C) Total RNA was isolated from the proliferative (pro) and hypertrophic (hyper) zones of tibia growth plate from d 17 chicken embryos. The expression levels of miR-1 were qualified by RT-PCR and Northern blot. U6 and RNU48 were used as internal control. D) The expression levels of miR-1 were quantified by real-time RT-PCR in the mouse proliferative and hypertrophic chondrocyte cell line (MCT cells). miR-133 in hypertrophic cells maintained a similar level of expression compared to proliferation chondrocytes. E) Real-time RT-PCR confirmed a higher expression of Col X and Ihh in the hypertrophic zone compared with the proliferative zone. Values represent the mean ± sd from 3 independent experiments. *P < 0.05. F) RT-PCR confirmed a high expression of Col 2 but not ACTA1 and MYOD1 (markers for skeletal muscle) was detected from the growth plate preparations. G) A high expression of miR-1 was detected in the prehypertrophic and hypertrophic zones compared with the proliferation zone by ISH.
Figure 3.
Figure 3.
MiR-1 stimulates chondrocyte proliferation. A) More than 88% of chondrocytes were transfected with miR-1, as determined by immunofluorescence microscopy 24 h after transfection in the primary chicken chondrocytes. B) Real-time RT-PCR result showed that overexpression of miR-1 (120 nM) increases the level of miR-1 while knockdown miR-1 by anti-miR-1 decreases its expression compared to control miRNA-1 in the primary chicken chondrocytes 24 h post-transfection. Values are presented as mean ± sd (n=3). *P < 0.05. C, D) MiR-1 stimulates chondrocyte proliferation. Primary chicken chondrocytes were transfected with a miR-1 mimic (miR-1) or negative control mimic (ConmiR), and miR-1 inhibitor (anti-miR-1) or a control miRNA inhibitor (control) at 120 nM, respectively. Forty-eight hours post-transfection, cell growth was measured by an EDU-based cell proliferation assay. Data are presented as means ± sd (n=5). *P < 0.05. E) Proliferation of chicken chondrocytes was also measured by a CCK-8-based cell proliferation assay. Values are means ± sd (n=5). *P < 0.05. F) miR-1 mimic increases cell proliferation, while cells were cotransfected with miR-1 mimic and HDAC4 has an opposite effect. Data are presented as means ± sd (n=3). *P < 0.05, compared to ConmiR. #P < 0.05, compared to miR-1.
Figure 4.
Figure 4.
MiR-1 induces chondrocyte differentiation. A) miR-1 increases the mRNA levels of Col X and Ihh, markers for chondrocyte differentiation. Primary chicken chondrocytes were transfected with a miR-1 mimic (miR-1) or control miRNA (ConmiR) at 120 nmol, respectively. The mRNA levels of Col X and Ihh were quantified by real-time RT-PCR 24 h post-transfection. Data are presented as mean ± sd (n=3) *P < 0.05. B) Inhibition of miR-1 down-regulates mRNA levels of Col X and Ihh. Primary chicken chondrocytes were transfected with a miR-1 inhibitor (anti-miR-1) or a control microRNA inhibitor (Control) at 120 nmol, respectively. The mRNA levels of Ihh and Col X were quantified by real-time RT-PCR 24 h post-transfection. Data are presented as means ± sd (n=3; 3 independent cell culture experiments). *P < 0.05. All transfections were performed in triplicate.
Figure 5.
Figure 5.
MiR-1 down-regulates HDAC4 protein in chondrocytes. A) MiR-1 down-regulates HDAC4 protein in dosage-dependent manner. Chondrocytes from d 17 embryos of chicken growth plate were transfected with a miR-1 mimic (miR-1) at 80 and 120 nmol or with a control miRNA (ConmiR) at 120 nmol. Western blot analysis was performed with HDAC4 antibody 48 h after transfection. B) Chicken growth plate chondrocytes from d 17 embryos were transfected with a miR-1 mimic (miR-1) or control microRNA (ConmiR), and a miR-1 inhibitor (anti-miR-1) or a control microRNA inhibitor (Control) at 120 nmol, respectively. Western blot analysis was performed with an antibody against HDAC4 48 h after transfection. miR-1 (120 nM) reduces the level of HDAC4, while antimiR-1 increases the level of HDAC4 compared to the control. C) Band intensities obtained from 3 individual Western blots were quantified using ImageJ software after normalize to β-actin to generate a bar graph of the relative difference in HDAC4 protein levels. Error bars represent ±1 sd of the mean. *P < 0.05.
Figure 7.
Figure 7.
MiR-1 increases Runx2 gene expression and Runx2 luciferase reporter activity. A) Chicken growth plate chondrocytes from d 17 embryos were transfected with a miR-1 mimic (miR-1) or a control miRNA (ConmiR), and a miR-1 inhibitor (anti-miR-1) or a control miRNA inhibitor (Control) at 120 nmol. Total RNA was extracted, and the mRNA level of Runx2 was quantified by real-time RT-PCR 24 h post-transfection. Data are the means of 3 independent experiments, with sd indicated. *P < 0.05, compared with control miR. B) Chondrocytes were transiently transfected with Runx2 promoter and expression vectors encoding HDAC4, as indicated in the presence or absence of control miRNA (ConmiR) or miR-1 mimic (miR-1). The cells were harvested for quantification of dual-luciferase activities 48 h after transfection. miR-1 increases Runx2 promoter activity while HDAC4 overcomes the Runx2 promoter activity induced by miR-1. Data are the means of 3 independent experiments, with sd indicated. *P < 0.05, compared with Con-miR; #P < 0.05, compared with miR-1 alone. C) HDAC4 inhibits Runx2 promoter activity in a dose-dependent manner. Data are the means of 3 independent cell culture experiments, with sd indicated. #P < 0.05, compared to control; *P < 0.05, compared to Runx 2 promoter alone. D) Knockdown HDAC4 by HDAC4 siRNA increases Runx2 promoter activity, while anti-miR-1 overcomes the Runx2 promoter activity induced by HDAC4 siRNA. Data are the means of 3 independent cell culture experiments, with sd indicated. *P < 0.05, compared to ConmiR; #P < 0.05, compared to HDAC4 siRNA alone.
Figure 8.
Figure 8.
HDAC4 inhibiting miR-1 induction of Ihh and Col X expression. A) Chicken growth plate chondrocytes from d 17 embryo were transfected with a control miRNA (ConmiR) or miR-1 or miR-1 plus HDAC4 expression vector. The mRNA levels of Ihh and Col X were quantified by real-time RT-PCR 24 h after transfection. Data are the means of 3 independent experiments, with sd indicated. *P < 0.05, compared with ConmiR. #P < 0.05, compared with miR-1. B) Overexpression of HDAC4 increased HDAC4 protein levels. Western blot analysis was performed with cell lysates collected 48 h post-transfection by an antibody against HDAC4.

Similar articles

Cited by

References

    1. Redfern A. D., Colley S. M., Beveridge D. J., Ikeda N., Epis M. R., Li X., Foulds C. E., Stuart L. M., Barker A., Russell V. J., Ramsay K., Kobelke S. J., Li X., Hatchell E. C., Payne C., Giles K. M., Messineo A., Gatignol A., Lanz R. B., O'Malley B. W., Leedman P. J. (2013) RNA-induced silencing complex (RISC) proteins PACT, TRBP, and Dicer are SRA binding nuclear receptor coregulators. Proc. Natl. Acad. Sci. U. S. A. 110, 6536–6541 - PMC - PubMed
    1. Valencia-Sanchez M. A., Liu J., Hannon G. J., Parker R. (2006) Control of translation and mRNA degradation by miRNAs and siRNAs. Genes Dev. 20, 515–524 - PubMed
    1. Bagga S., Bracht J., Hunter S., Massirer K., Holtz J., Eachus R., Pasquinelli A. E. (2005) Regulation by let-7 and lin-4 miRNAs results in target mRNA degradation. Cell 122, 553–563 - PubMed
    1. Eulalio A., Rehwinkel J., Stricker M., Huntzinger E., Yang S.-F., Doerks T., Dorner S., Bork P., Boutros M., Izaurralde E. (2007) Target-specific requirements for enhancers of decapping in miRNA-mediated gene silencing. Genes Dev. 21, 2558–2570 - PMC - PubMed
    1. Lee R. C., Ambros V. (2001) An extensive class of small RNAs in Caenorhabditis elegans. Science 294, 862–864 [See comment] - PubMed

Publication types

MeSH terms

LinkOut - more resources