. 2014 Jul;9(4):410.
doi: 10.1007/s12263-014-0410-x. Epub 2014 May 25.

Multivitamin restriction increases adiposity and disrupts glucose homeostasis in mice

Affiliations

Multivitamin restriction increases adiposity and disrupts glucose homeostasis in mice

Nisserine Ben Amara et al. Genes Nutr. 2014 Jul.

Abstract

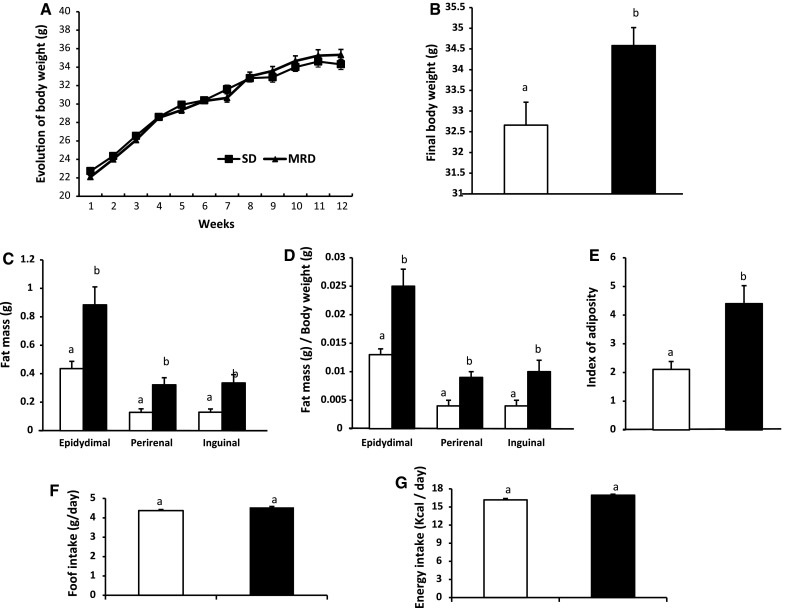
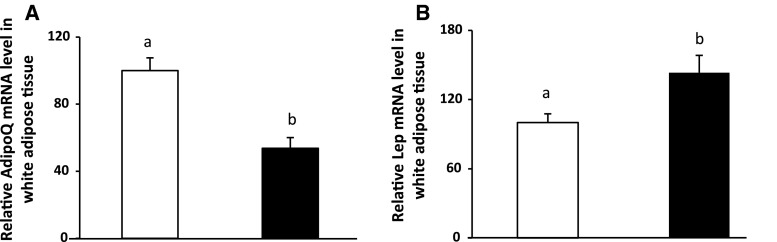
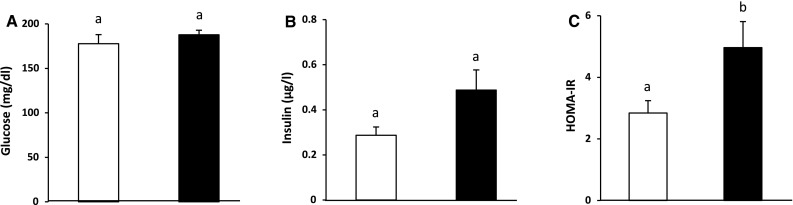
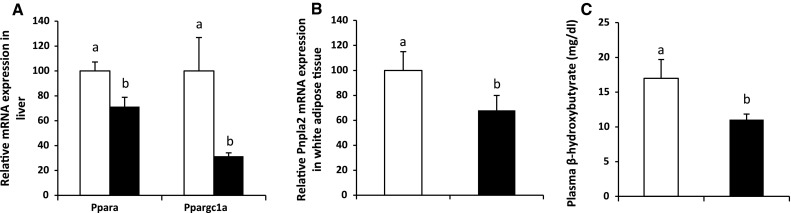
A strong association between obesity and low plasma concentrations of vitamins has been widely reported; however, the causality of this relationship is still not established. Our goal was to evaluate the impact of a multivitamin restriction diet (MRD) on body weight, adiposity and glucose homeostasis in mice. The mice were given a standard diet or a diet containing 50 % of the recommended vitamin intake (MRD) for 12 weeks. At the end of the experiment, total body weight was 6 % higher in MRD animals than in the control group, and the adiposity of the MRD animals more than doubled. The HOMA-IR index of the MRD animals was significantly increased. The adipose tissue of MRD animals had lower expression of mRNA encoding adiponectin and Pnpla2 (47 and 32 %, respectively) and 43 % higher leptin mRNA levels. In the liver, the mRNA levels of Pparα and Pgc1α were reduced (29 and 69 %, respectively) in MRD mice. Finally, the level of β-hydroxybutyrate, a ketonic body reflecting fatty acid oxidation, was decreased by 45 % in MRD mice. Our results suggest that MRD promotes adiposity, possibly by decreasing adipose tissue lipolysis and hepatic β-oxidation. These results could highlight a possible role of vitamin deficiency in the etiology of obesity and associated disorders.


Figures

Fig. 1
Fig. 1
Multivitamin restriction increases body weight and adiposity. a Body weight evolution was followed during the 12 weeks of treatment. b Before killing, animal weight was established. c At the time of killing, after 12 weeks of treatment, adipose tissues (epididymal, subcutaneous and peri-renal) were weighed for each animal (n = 10). d The fat mass is reported relative to the total body weight of the animal. e An adiposity index was calculated by calculating the ratio between total fat mass and body weight for the animal. f Mean food intake was determined together with energy intake. g White bars correspond to mice submitted to the standard diet (SD), and black bars correspond to mice submitted to the multivitamin-restricted diet. Values are presented as the mean ± SEM. Bars not sharing the same letter are significantly different, p < 0.05
Fig. 2
Fig. 2
Multivitamin restriction modifies AdipoQ and Lep expression in adipose tissue. a, b Gene expression in white adipose tissue is expressed relative to 18S ribosomal RNA levels in mice submitted to a standard diet (white bars) and multivitamin-restricted diet (black bars) for 12 weeks (n = 10). Values are presented as the mean ± SEM. Bars not sharing the same letter are significantly different, p < 0.05
Fig. 3
Fig. 3
Multivitamin restriction increases fasted insulinemia and HOMA-IR. a, b Insulin and glucose levels were measured after overnight fasting in the plasma of mice that received the standard diet (white bars) or multivitamin-restricted diet (black bars) for 12 weeks (n = 10). c The HOMA-IR index was calculated based on glycemia and insulinemia. Values are presented as the mean ± SEM. Bars not sharing the same letter are significantly different, p < 0.05
Fig. 4
Fig. 4
Multivitamin restriction decreases gene expression in the liver and white adipose tissue and β-hydroxybutyrate levels in plasma. Gene expression relative to 18S ribosomal RNA levels in the liver (a) and in white adipose tissue (b) of mice (n = 10) submitted to the standard diet (white bars) and multivitamin-restricted diet (black bars) for 12 weeks. c β-Hydroxybutyrate concentration in plasma of mice (n = 10) submitted to the standard diet (white bars) and multivitamin-restricted diet (black bars) for 12 weeks. Values are presented as the mean ± SEM. Bars not sharing the same letter are significantly different, p < 0.05

Similar articles

Cited by

References

    1. Aasheim ET, Hofso D, Hjelmesaeth J, Birkeland KI, Bohmer T. Vitamin status in morbidly obese patients: a cross-sectional study. Am J Clin Nutr. 2008;87(2):362–369. - PubMed
    1. Ahmadian M, Duncan RE, Varady KA, Frasson D, Hellerstein MK, Birkenfeld AL, Samuel VT, Shulman GI, Wang Y, Kang C, Sul HS. Adipose overexpression of desnutrin promotes fatty acid use and attenuates diet-induced obesity. Diabetes. 2009;58(4):855–866. doi: 10.2337/db08-1644. - DOI - PMC - PubMed
    1. Astrup A, Bugel S. Micronutrient deficiency in the aetiology of obesity. Int J Obes (Lond) 2010;34(6):947–948. doi: 10.1038/ijo.2010.81. - DOI - PubMed
    1. Berry DC, Noy N. All-trans-retinoic acid represses obesity and insulin resistance by activating both peroxisome proliferation-activated receptor beta/delta and retinoic acid receptor. Mol Cell Biol. 2009;29(12):3286–3296. doi: 10.1128/MCB.01742-08. - DOI - PMC - PubMed
    1. Bonet ML, Oliver J, Pico C, Felipe F, Ribot J, Cinti S, Palou A. Opposite effects of feeding a vitamin A-deficient diet and retinoic acid treatment on brown adipose tissue uncoupling protein 1 (UCP1), UCP2 and leptin expression. J Endocrinol. 2000;166(3):511–517. doi: 10.1677/joe.0.1660511. - DOI - PubMed

LinkOut - more resources