Bioenergetic analysis of ovarian cancer cell lines: profiling of histological subtypes and identification of a mitochondria-defective cell line
- PMID: 24858344
- PMCID: PMC4032324
- DOI: 10.1371/journal.pone.0098479
Bioenergetic analysis of ovarian cancer cell lines: profiling of histological subtypes and identification of a mitochondria-defective cell line
Abstract
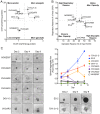
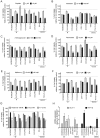
Epithelial ovarian cancer (EOC) is the most lethal of all gynecological cancers, and encompasses distinct histological subtypes that have specific genetic and tissues-of-origin differences. Ovarian clear cell carcinoma (OCCC) represents approximately 10% of cases and has been termed a stress responsive cancer. OCCC is characterized by increased expression of oxidative stress and glycolysis-related genes. In the present study, we hypothesized that bioenergetic profiling might uniquely distinguish OCCC from other EOC histological subtypes. Using an extracellular flux analyzer, OCCC lines (ES-2, TOV-21-G) were shown to be highly metabolically active, with high oxygen consumption rate (OCR) and high extracellular acidification rate (ECAR), indicative of enhanced mitochondrial oxidative phosphorylation and glycolytic rate, respectively. A high bioenergetics profile was associated with the cell lines' ability to form anchorage independent spheroids. Given their high glycolytic and mitochondrial activity, OCCC cells displayed strong sensitivity to 2-deoxy-D-glucose and Rotenone growth inhibition, although this chemosensitivity profile was not specific to only OCCC cells. Bioenergetic profiling also identified a non-OCCC cell line, OVCA420, to have severely compromised mitochondrial function, based on low OCR and a lack of stimulation of maximal respiration following application of the uncoupler FCCP. This was accompanied by mitochondrial morphology changes indicative of enhanced fission, increased expression of the mitochondrial fission protein Drp1, a loss of mitochondrial membrane potential and dependence on glycolysis. Importantly, this loss of mitochondrial function was accompanied by the inability of OVCA420 cells to cope with hypoxic stress, and a compromised ability to stabilize HIF-1α in response to 1% O2 hypoxia. This knowledge may be imperative for researchers planning to utilize this cell line for further studies of metabolism and hypoxia, and suggests that altered mitochondrial fission dynamics represents a phenotype of a subpopulation of EOCs.
Conflict of interest statement
Figures


Similar articles
-
Availability of the key metabolic substrates dictates the respiratory response of cancer cells to the mitochondrial uncoupling.Biochim Biophys Acta. 2014 Jan;1837(1):51-62. doi: 10.1016/j.bbabio.2013.07.008. Epub 2013 Jul 23. Biochim Biophys Acta. 2014. PMID: 23891695
-
Paclitaxel-resistance facilitates glycolytic metabolism via Hexokinase-2-regulated ABC and SLC transporter genes in ovarian clear cell carcinoma.Biomed Pharmacother. 2024 Nov;180:117452. doi: 10.1016/j.biopha.2024.117452. Epub 2024 Sep 28. Biomed Pharmacother. 2024. PMID: 39341074
-
Mitochondrial bioenergetics of metastatic breast cancer cells in response to dynamic changes in oxygen tension: effects of HIF-1α.PLoS One. 2013 Jun 28;8(6):e68348. doi: 10.1371/journal.pone.0068348. Print 2013. PLoS One. 2013. PMID: 23840849 Free PMC article.
-
The Warburg effect in tumor progression: mitochondrial oxidative metabolism as an anti-metastasis mechanism.Cancer Lett. 2015 Jan 28;356(2 Pt A):156-64. doi: 10.1016/j.canlet.2014.04.001. Epub 2014 Apr 13. Cancer Lett. 2015. PMID: 24732809 Free PMC article. Review.
-
Ovarian clear cell carcinoma meets metabolism; HNF-1β confers survival benefits through the Warburg effect and ROS reduction.Oncotarget. 2015 Oct 13;6(31):30704-14. doi: 10.18632/oncotarget.5228. Oncotarget. 2015. PMID: 26375553 Free PMC article. Review.
Cited by
-
Chemically Modified Dendritic Starch: A Novel Nanomaterial for siRNA Delivery.Bioconjug Chem. 2015 Aug 19;26(8):1766-74. doi: 10.1021/acs.bioconjchem.5b00313. Epub 2015 Aug 11. Bioconjug Chem. 2015. PMID: 26218732 Free PMC article.
-
Single-Cell Dissection of the Multiomic Landscape of High-Grade Serous Ovarian Cancer.Cancer Res. 2022 Nov 2;82(21):3903-3916. doi: 10.1158/0008-5472.CAN-21-3819. Cancer Res. 2022. PMID: 35969151 Free PMC article.
-
Drp1 splice variants regulate ovarian cancer mitochondrial dynamics and tumor progression.EMBO Rep. 2024 Oct;25(10):4281-4310. doi: 10.1038/s44319-024-00232-4. Epub 2024 Aug 27. EMBO Rep. 2024. PMID: 39191946 Free PMC article.
-
Navigating Metabolic Challenges in Ovarian Cancer: Insights and Innovations in Drug Repurposing.Cancer Med. 2025 Feb;14(4):e70681. doi: 10.1002/cam4.70681. Cancer Med. 2025. PMID: 39969135 Free PMC article. Review.
-
Mitochondrial Dysfunction Pathway Alterations Offer Potential Biomarkers and Therapeutic Targets for Ovarian Cancer.Oxid Med Cell Longev. 2022 Apr 20;2022:5634724. doi: 10.1155/2022/5634724. eCollection 2022. Oxid Med Cell Longev. 2022. PMID: 35498135 Free PMC article. Review.
References
Publication types
MeSH terms
Substances
Grants and funding
LinkOut - more resources
Full Text Sources
Other Literature Sources
Medical
Miscellaneous

