Comparative Study
. 2014 Aug 1;307(3):H405-17.
doi: 10.1152/ajpheart.00144.2014. Epub 2014 May 23.

Diverse forms of pulmonary hypertension remodel the arterial tree to a high shear phenotype

Affiliations
Comparative Study

Diverse forms of pulmonary hypertension remodel the arterial tree to a high shear phenotype

Roblee P Allen et al. Am J Physiol Heart Circ Physiol. .

Abstract

Pulmonary hypertension (PH) is associated with progressive changes in arterial network complexity. An allometric model is derived that integrates diameter branching complexity between pulmonary arterioles of generation n and the main pulmonary artery (MPA) via a power-law exponent (X) in dn = dMPA2(-n/X) and the arterial area ratio β = 2(1-2/X). Our hypothesis is that diverse forms of PH demonstrate early decrements in X independent of etiology and pathogenesis, which alters the arteriolar shear stress load from a low-shear stress (X > 2, β > 1) to a high-shear stress phenotype (X < 2, β < 1). Model assessment was accomplished by comparing theoretical predictions to retrospective morphometric and hemodynamic measurements made available from a total of 221 PH-free and PH subjects diagnosed with diverse forms (World Health Organization; WHO groups I-IV) of PH: mitral stenosis, congenital heart disease, chronic obstructive pulmonary lung disease, chronic thromboembolism, idiopathic pulmonary arterial hypertension (IPAH), familial (FPAH), collagen vascular disease, and methamphetamine exposure. X was calculated from pulmonary artery pressure (PPA), cardiac output (Q) and body weight (M), utilizing an allometric power-law prediction of X relative to a PH-free state. Comparisons of X between PAH-free and PAH subjects indicates a characteristic reduction in area that elevates arteriolar shear stress, which may contribute to mechanisms of endothelial dysfunction and injury before clinically defined thresholds of pulmonary vascular resistance and PH. We conclude that the evaluation of X may be of use in identifying reversible and irreversible phases of PH in the early course of the disease process.

Keywords: allometry; complexity; pulmonary hypertension.


Figures

Fig. 1.
Fig. 1.
Predictive model validation via forward-inverse modeling of diameter/length-power laws. By observation, pulmonary hypertension (PH) disease reduces diameter exponents and area ratios and also prunes their effective lengths, at the level of bifurcations, and as a population within in subtrees and the arterial tree as a whole (6, 14, 36). Thoma's schema of maladaptive morphometric changes in branching complexity via metabolic-hemodynamic steady states leads to a simple predictive and integrative diameter/length power-law model of PH disease progression on the basis of phenotypic changes in arterial branching complexity that is, in principle, identifiable and validated by forward (morphometric) and inverse (hemodynamic) power-law data models (3). The basic element of topological organization common to the power laws are bifurcations. As the sources of information about structure and function are disparate, forward and inverse models purposely utilize limited available information at the level of bifurcations within their respective approaches, to ultimately lead to a common integrated diameter power-law relationship (arterial tree). For example, the forward-morphometric model (see Ref. 16) represents an asymmetric nonuniform model morphometric tree of a PH-free and PH state when viewed at all levels of organization. However, although the morphometric distribution is nonuniform and contains more detailed information, it possesses an average value consistent with the slope of the diameter power law, which changes in a direction of area reduction for the entire arterial tree in the course of PH progression. Conversely, the inverse hemodynamic model is devoid of morphometric information entirely. It is alternatively formulated on the basis of diameter/length adaptations subject to a principle of least work rate. The premise of xd = xl delineates an energetic rate-favorable trajectory of maladaptation for both diameter and length pruning at the level of bifurcations, bifurcation distribution, and for the arterial tree as a whole that is coincident with Thoma's hypothesis of disease progression and the forward model. PAH, pulmonary arterial hypertension.
Fig. 2.
Fig. 2.
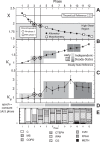
A–E: afterload responses during PH progression. Points in plots represent phases of progression corresponding to average values ± 95% CI. Statistically insignificant differences between adjacent phases are highlighted by shaded boxes. Statistically significant differences between phases are not shaded. A: hemodynamic- and morphometric-derived values of X demonstrate monotonic decrements during steady states of constant energy-rate delivery during PH progression independent of diagnosis, confirming Thoma's prediction in humans for PH disease that organ system pathology demonstrates evolving patterns of arterial network complexity. B: κd responses in PH, as the expected main pulmonary artery (MPA) diameter increases during PH progression relative to a reference state (Eqs. 16 and 17). This ratio reflects the MPA afterload adjustment of a hemodynamic-equivalent network that minimizes arterial power dissipation. C: κψ is the energy rate ratio of entrance to pulmonary circulation reflecting steady-state metabolic-hemodynamic conditions relative to a baseline PH-free state. D: statistical equivalent steady states of constant energy rate delivery designated by similar shades of gray that demonstrate statistically different decrements/stage, early, mid, and late. E: distribution of diagnosis for each stage of disease. C, control; MS, mitral valve disease; COPD, chronic obstructive pulmonary disease; CTEPH, chronic thromboembolic pulmonary hypertension; IPAH, idiopathic pulmonary hypertension; CG, congenital defects; CVD, collagen vascular disease; FPAH, familial PH; METH, methamphetamine PH.
Fig. 3.
Fig. 3.
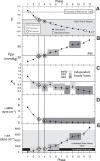
A–D: hemodynamic responses during PH progression. Shaded and unshaded boxes follow the same convention as Fig. 2. A: β decreases significantly with each stage in several stages before the emergence of clinically defined pressures (B) for PH (◇) and PAH (○). C: cardiac output demonstrates significant reductions early in progression along with variable short-term and longer-term steady states with changes in stage. D: attenuated shear stress in main pulmonary artery. E: amplified shear stress on generation of 19 arterioles. Statistical significant increases to thresholds consistent with endothelial dysfunction occur in first phase and hold a steady state up to phase 4, consistent with PAH diagnosis. Later phases demonstrate elevated levels consistent with endothelial and cellular injury. Statistical equivalent steady states are designated by similar shades of gray.
Fig. 4.
Fig. 4.
A–B: influence of Trepostinil and placebo on PH progression. A: covariance trends (Trepostinil, thick line; placebo, thin line) summarize PH progression over 16 wk as a function of baseline starting value of X and demonstrate statistical profiles between groups. Phase advancement (+Δphase/16wk, earmarks disease worsening, -Δphase/16wk, phase reversal). Placebo trend indicates that subjects with baseline values of X = 2.00 demonstrated the most rapid advancement in phase progression (3 phases) over the course of the 16-wk study. Placebo subjects starting the study at later phases (X = 1.75) did not significantly advance further. Unlike the placebo group, the Trepostinil-exposed subjects beginning with a X = 2.00 baseline phase did not change, but those with more advanced phases at the start of the study advanced only 1 phase by 16 wk. B: covariance trends were controlled for statistically similar intragroup variations that may have arisen from prior treatment, classified as either worse (increase in phase) or demonstrated improvement (decrease in phase). There was a significant difference between the combined group of demonstrating progression (worse) and responders (better), which was not affected by placebo or treatment (NS).

References

    1. Bennett SH, Eldridge M, Zaghi D, Zaghi S, Milstein J, Goetzman B. Form and function of fetal and neonatal pulmonary arterial bifurcations. Am J Physiol Heart Circ Physiol 279: H3047–H3057, 2000 - PubMed
    1. Bennett SH. Modeling methodology for vascular input impedance determination and interpretation. J Appl Physiol 75: 455–484, 1994 - PubMed
    1. Bennett SH, Goetzman BW, Milstein JM, Pannu JS. Role of arterial design on pulse wave reflection in a fractal pulmonary network. J Appl Physiol 80: 1033–1056, 1996 - PubMed
    1. Burrows K, Clark A, Tawhai M. Blood flow redistribution and ventilation-perfusion mismatch during embolic pulmonary arterial occlusion. Pulm Circ 1: 365–376, 2011 - PMC - PubMed
    1. Chan S, Loscalzo J. Pathogenic mechanisms of pulmonary hypertension. J Mol Cell Cardiol 44: 14–30, 2008 - PMC - PubMed

Publication types

LinkOut - more resources