. 2014 Jun;16(6):516-28.
doi: 10.1038/ncb2965. Epub 2014 May 25.

The ability of inner-cell-mass cells to self-renew as embryonic stem cells is acquired following epiblast specification

Affiliations

The ability of inner-cell-mass cells to self-renew as embryonic stem cells is acquired following epiblast specification

Thorsten Boroviak et al. Nat Cell Biol. 2014 Jun.

Abstract

The precise relationship of embryonic stem cells (ESCs) to cells in the mouse embryo remains controversial. We present transcriptional and functional data to identify the embryonic counterpart of ESCs. Marker profiling shows that ESCs are distinct from early inner cell mass (ICM) and closely resemble pre-implantation epiblast. A characteristic feature of mouse ESCs is propagation without ERK signalling. Single-cell culture reveals that cell-autonomous capacity to thrive when the ERK pathway is inhibited arises late during blastocyst development and is lost after implantation. The frequency of deriving clonal ESC lines suggests that all E4.5 epiblast cells can become ESCs. We further show that ICM cells from early blastocysts can progress to ERK independence if provided with a specific laminin substrate. These findings suggest that formation of the epiblast coincides with competence for ERK-independent self-renewal in vitro and consequent propagation as ESC lines.


Figures
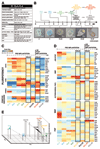
Figure 1
Figure 1. Gene expression in early mouse development
(A) Lineage markers and pathway-associated genes assayed by qRT-PCR array (downstream targets in italic). (B) Summary of the embryonic lineages profiled. Three embryos were analysed per developmental stage with the first shown in the figure. The embryonic lineages isolated are shown in pseudocolours, with the approximate numbers of cells for expression profiling underneath. (C) Lineage markers normalised to mean expression value. (D) Expression of Jak-Stat, Bmp, Activin-Nodal-Tgfb, Wnt and Fgf signalling pathway-associated genes with downstream targets in italics. (E) PCA of embryonic samples from E1.5-5.5 based on qRT-PCR arrays. All data points represent independent biological replicates. Triangles between data points are drawn based on the corresponding developmental stage.
Figure 2
Figure 2. Correlation of ESC gene expression to the early embryo
(A) Hierarchical clustering of ESC samples from 10, 20 and 30 cells cultured in 2i and 2i-LIF. (B) PCA of embryonic stages and ESC samples obtained from 2i and 2i-LIF cultures on gelatin. Two independent biological replicates, each containing 20 randomly picked cells of the 4 ESC lines indicated in the graph, for both 2i and 2i-LIF, were processed and profiled by qRT-PCR arrays. (C) Hierarchical clustering of the data set shown in B. The major cluster containing ESC samples in 2i and 2i-LIF is highlighted in orange. (D) PCA of embryonic stages, ESC samples cultured in serum-LIF on gelatin or feeders and EpiSC maintained on fibronectin. Two independent biological replicates, each containing 20 randomly-picked cells, were processed and profiled by qRT-PCR arrays for each experimental condition. (E) Hierarchical clustering of the data set shown in D. ESC samples clustering close to the E4.5 epiblast are highlighted in orange.
Figure 3
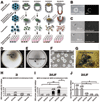
Figure 3. Functional analysis of embryonic cells by single-cell ESC derivation
(A) Schematic outline of the single-cell ESC derivation assay in a fully defined system using embryos from Pdgfra::GFP× F1 crosses. (B) Image of an isolated ICM after immunosurgery of an E4.5 embryo with Pdgfra::GFP expression in PrE. (C) Dissociated single presumptive epiblast cell (upper panel) and a presumptive PrE cell (lower panel). (D-G) ESC derivation process: an isolated embryonic cell is plated into an individual well (D), grows to an ESC colony within 7 days (E) and is expanded into an ESC line (F) with high chimeric contribution (G). Representative images in B-G, more than 20 replicates. (H-I) Single-cell ESC derivation efficiency in 2i (H) and 2i-LIF (I). Efficiency is displayed as the percentage of ESC-colony positive wells per embryo (ESC-col. pos. wells (%)/embryo) after 7 days. The total efficiency is further subdivided into ESC colonies arising from truly individual cells (ESC-col (single-cell)) and ESC arising from small groups, usually between 2-5 cells (ESC-col (small group of cells)). *=P<0.05, **=P<0.01 as determined by one-way ANOVA with subsequent Tukey HSD testing. The graphs show the mean and S.E.M. for the percentage of ESC colony-containing wells per embryo resulting from the analysis of n=’e’ embryos (with at least 3 wells analysed per embryo for each time point of embryonic development shown on the X axis, ‘w’ represents the total number of wells analysed per time point). Embryos were obtained from at least 3 individual litters on at least 3 different days. (J) Percentage of wells containing at least one surviving cell by morphology after 7 days per embryo in 2i-LIF; e=number of embryos analysed, w=number of wells analysed, *=P<0.05 as determined by One-way ANOVA with subsequent Tukey HSD testing. The graph shows the mean and S.E.M. for the percentage of surviving cell-containing wells per embryo resulting from the analysis of n=’e’ embryos (with at least 3 wells analysed per embryo for each time point of embryonic development shown on the X axis, ‘w’ represents the total number of wells analysed per time point). Embryos were obtained from at least 3 individual litters on at least 3 different days.
Figure 4
Figure 4. Maturation in the absence of MEK inhibition allows individual ICM cell acquisition of naïve pluripotency
(A) Embryos obtained after uterine flush at E3.5. For “stringent early ICM cells” expanding blastocyst stages with more than 50% cavity volume were excluded. Scale bar = 200µm. (B) Single-cell ESC derivation efficiency in percentage of ESC-colony positive wells per embryo (ESC-col. pos. wells (%)/embryo) of stringent early E3.5 ICM cells. For the 24h maturation step, single-cells were cultured for the first day in the medium condition indicated and on the second day an equal amount of 2i-LIF was added. Subsequently the cultures were maintained in 2i-LIF. *=P<0.05 as determined by Student’s two tailed t-test. The graph shows the mean and S.E.M. for the percentage of ESC colony-containing wells per embryo resulting from the analysis of n=’e’ embryos (with at least 4 wells analysed per embryo for each experimental condition shown on the X axis, ‘w’ represents the total number of wells analysed per experimental condition). Embryos were obtained from at least 3 individual litters on two different days. (C) Chimeric mouse obtained from injecting cells of a day 6 ESC colony into a host blastocyst. The ESC colony was derived from a single, stringent early E3.5 ICM cell including a 24h maturation step in CHIR+LIF. (D) Surviving cells by morphology after 7 days in percentage of wells per embryo, as described in (B). Error bars are S.E.M. calculated from the percentage of wells containing surviving cells per embryo resulting from the analysis of n=’e’ embryos (with at least 4 wells analysed per embryo for each experimental condition shown on the X axis, ‘w’ represents the total number of wells analysed per experimental condition). (E) ESC colony derived from an individual stringent early E3.5 ICM cell after 24h CHIR+LIF incubation. (F) Vacuolated, surviving cell which did not develop into an ESC colony. Representative images in E and F, more than 5 replicates. (G) Schematic of an E4.5 embryo and hierarchical clustering of an ESC colony obtained including a 24h maturation step in CHIR+LIF, 10 vacuolated cells obtained including a 24h maturation step in CHIR+LIF and 10 vacuolated cells obtained in 2i-LIF cultures only from stringent early E3.5 ICM cells, three E4.5 epiblast, three E4.5 PrE and one E4.5 trophectoderm sample.
Figure 5
Figure 5. Components of the embryonic extracellular matrix allow ESC derivation in the presence of PD03 from individual early ICM cells
(A) Immunofluorescence staining of blastocysts cultured in vitro from the zygote in the presence of either DMSO or 5µM PD03. Representative images, more than 3 replicates. (B) RNA levels in RPM (mapped reads per million base pairs sequenced) for two early blastocysts (insets, scale bar=50µm) of major extracellular matrix genes. B’ represents the percentage of RNA levels of Fn1 and Lama5, Lamb1, Lamc1 over the remaining extracellular matrix genes displayed in B. (C) Single-cell ESC derivation efficiency in 2i-LIF on Fn-Lam511. Efficiency is displayed as the percentage of ESC-colony positive wells per embryo (ESC-col. pos. wells(%)/embryo) after 7 days. The total efficiency is further subdivided into ESC colonies arising from truly individual cells (ESC-col (single-cell)) and ESC arising from small groups, usually between 2-5 cells (ESC-col (small group of cells)). **=P<0.01 as determined by One-way ANOVA with subsequent Tukey HSD testing. The graph shows the mean and S.E.M. for the percentage of ESC colony-containing wells per embryo resulting from the analysis of n=’e’ embryos (with at least 4 wells analysed per embryo for each time point of embryonic development shown on the X axis, ‘w’ represents the total number of wells analysed per time point). Embryos were obtained from at least 3 individual litters on at least 3 different days. (D) Percentage of embryos giving rise to at least one ESC colony in 2i-LIF on Fn-Lam511. The numbers of embryos yielding at least one ESC colony per total number of embryos analysed are indicated. (E) Single-cell ESC derivation efficiencies of stringent early ICM cells in 2i-LIF on the substrates indicated, as described in (C). The graph shows the mean and S.E.M. for the percentage of ESC colony-containing wells per embryo resulting from the analysis of n=’e’ embryos (with at least 4 wells analysed per embryo for each experimental condition shown on the X axis, ‘w’ represents the total number of wells analysed per experimental condition). (F) Immunofluorescence staining of a E3.5 blastocyst for Fn, Lama5 and Oct4. Representative images, more than 3 replicates.
Figure 6
Figure 6. Maximising the number of clonal ESC lines derived from the preimplantation epiblast
(A) Alkaline phosphatase staining of ESC colonies after single-cell ESC derivation in 2i-LIF on Fn-Lam511 at day 7. An E4.5 ICM was trypsinised and single as well as small groups of cells were evenly distributed with a mouth pipette. Representative images, more than 10 replicates. (B) Representative images of day 2, 4 and 6 after single-cell ESC derivation as described in A. (C) Total number of ESC colonies per E4.5 embryo at day 7 on the substrates indicated; e=number of embryos analysed, *=P<0.05 as determined by One-way ANOVA with subsequent Tukey HSD testing. Error bars are S.D. calculated from the number of ESC colonies per embryo. Embryos were obtained from at least 2 individual litters on at least 3 different days. (D) Germline transmission of a clonal ESC line derived on Fn-Lam511. (E) Total number of ESC colonies per embryo after culture from the 8-cell stage for three days in the presence of activators or inhibitors of FGF signalling; ‘n’ values are expressed as ‘e’=number of embryos analysed, **=P<0.01, *=P<0.05 as determined by One-way ANOVA with subsequent Tukey HSD testing. Error bars are S.D. calculated from the number of ESC colonies per embryo. Embryos were obtained from at least 2 individual litters on at least 3 different days. (F) Correlation plot of ESC colonies shown in E with the number of Nanog-positive epiblast cells reported for the embryo culture conditions indicated. Error bars are S.D. as described in (E). The corresponding references are: bFGF, DMSO, PD17 and PD03 and PD03+PD17 .
Figure 7
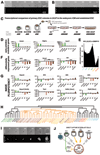
Figure 7. ESC colonies are directly captured in a transcriptional state closest to the E4.5 epiblast
(A-B) Time-lapse of ESC derivation using the Pdgfra::GFP reporter line in 2i-LIF on Fn-Lam511 at E4.5.Following immunosurgery the ICM was rendered into a single-cell suspension by repetitive trypsinisation, and cells were deposited into individual wells. Clonal ESC colonies arose exclusively from Pdgfra::GFP negative cells (A), but not Pdgfra::GFP positive cells (B). (C) Schematic representation of embryonic stages and sample acquisition for gene expression analysis during ESC derivation. Primary ESC colonies were derived by manual plating of dissociated E4.5 ICMs on Fn-Lam511 in 2i-LIF. For each biological replicate, one colony was manually picked, trypsinised and 20 randomly-selected cells were used for cDNA preamplification and transcriptional analysis by 96 gene RT-qPCR at days 2, 4 and 6. (D,F,G) Direct comparison of RNA levels in embryonic samples E3.5-ICM, E4.0-ICM and E4.5-EPI (epiblast), ESC derivation samples day 2-6 and established ESC in 2i-LIF (average of the 4 lines analysed in this study:E14, RG, FL4 and FL11). Expression levels are shown relative to the preimplantation epiblast (E4.5-EPI) on a logarithmic scale for (D) PrE markers, (F) significantly downregulated genes between ESC and E4.5 epiblast, ***=P<0.001 as determined by Student’s two tailed t-test corrected for multiple testing using the Benjamini- Hochberg procedure, and (G) naïve pluripotency markers. Error bars are S.D. between biological replicates. The number of independent biological replicates is indicated in C. (E) Graph showing the total number of significantly differentially (P<0.05) expressed genes of ESC compared to the indicated embryonic stages. (H) Unbiased hierarchical clustering of primary ESC colonies at derivation day 2, 4 and 6 in 2i-LIF on Fn-Lam511, ESC derived from 129 (E14,RG) and Pdgfra::GFP-F1 background (FL4,FL11) in 2i and 2i-LIF and embryonic samples from E1.5-5.5. (I) Time-lapse of single-cell ESC derivation on Fn-Lam511 in 2i-LIF at E4.5 using a destabilised Rex1-GFP reporter. (J) Model where individual preimplantation epiblast cells can be directly captured in an ESC state in vitro. Both states are naïve pluripotent, single-cell culture-permissive and closely related in their transcriptional program. Early ICM cells do not give rise to clonal ESC colonies directly, but can be rescued by either a 24h maturation step without FGF signalling inhibition or provision of Fn-Lam511, which mimics the embryonic extracellular matrix.

Comment in

References

    1. Nichols J, et al. Formation of pluripotent stem cells in the mammalian embryo depends on the POU transcription factor Oct4. Cell. 1998;95:379–391. - PubMed
    1. Chambers I, et al. Functional expression cloning of Nanog, a pluripotency sustaining factor in embryonic stem cells. Cell. 2003;113:643–655. - PubMed
    1. Kurimoto K, et al. An improved single-cell cDNA amplification method for efficient high-density oligonucleotide microarray analysis. Nucleic Acids Res. 2006;34:e42. - PMC - PubMed
    1. Guo G, et al. Resolution of cell fate decisions revealed by single-cell gene expression analysis from zygote to blastocyst. Dev Cell. 2010;18:675–685. - PubMed
    1. Avilion AA, et al. Multipotent cell lineages in early mouse development depend on SOX2 function. Genes Dev. 2003;17:126–140. - PMC - PubMed

Publication types

MeSH terms