. 2014 Aug;31(8):1956-78.
doi: 10.1093/molbev/msu173. Epub 2014 May 24.

An experimentally determined evolutionary model dramatically improves phylogenetic fit

Affiliations

An experimentally determined evolutionary model dramatically improves phylogenetic fit

Jesse D Bloom. Mol Biol Evol. 2014 Aug.

Abstract

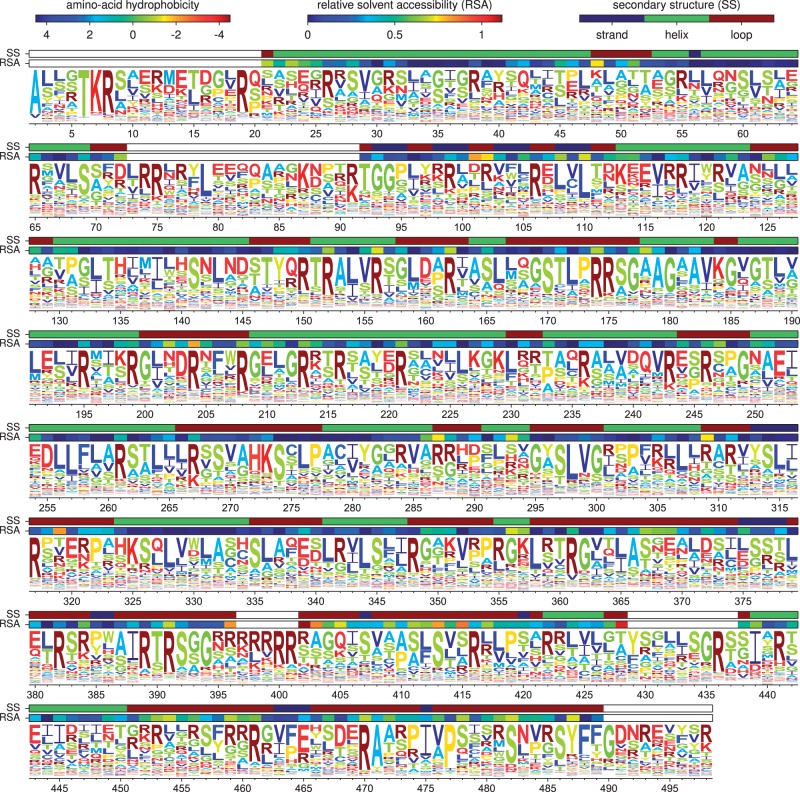
All modern approaches to molecular phylogenetics require a quantitative model for how genes evolve. Unfortunately, existing evolutionary models do not realistically represent the site-heterogeneous selection that governs actual sequence change. Attempts to remedy this problem have involved augmenting these models with a burgeoning number of free parameters. Here, I demonstrate an alternative: Experimental determination of a parameter-free evolutionary model via mutagenesis, functional selection, and deep sequencing. Using this strategy, I create an evolutionary model for influenza nucleoprotein that describes the gene phylogeny far better than existing models with dozens or even hundreds of free parameters. Emerging high-throughput experimental strategies such as the one employed here provide fundamentally new information that has the potential to transform the sensitivity of phylogenetic and genetic analyses.

Keywords: codon model; deep mutational scanning; influenza; nucleoprotein; phylogenetics; substitution model.


Figures

F<sc>ig</sc>. 1.
Fig. 1.
The codon-mutant libraries as assessed by Sanger sequencing 30 individual clones. (A) The clones have an average of 2.7 codon mutations and 0.1 indels per full-length NP coding sequence, with the number of mutated codons per gene following an approximately a Poisson distribution. (B) The number of nucleotide changes per codon mutation is roughly as expected if each codon is randomly mutated to any of the other 63 codons, with a slight elevation in single-nucleotide mutations. (C) The mutant codons have a uniform base composition. (D) Mutations occur uniformly along the primary sequence. (E) In clones with multiple mutations, there is no tendency for mutations to cluster. Shown is the actual distribution of pairwise distances between mutations in all multiply mutated clones compared with the distribution generated by 1,000 simulations where mutations are placed randomly along the primary sequence of each multiple-mutant clone. The data and code for this figure are available at https://github.com/jbloom/SangerMutantLibraryAnalysis/tree/v0.21 (last accessed May 31, 2014).
F<sc>ig</sc>. 2.
Fig. 2.
Design of the deep mutational scanning experiment. The sequenced samples are in yellow. Blue text indicates sources of mutation and selection; red text indicates sources of errors. The comparison of interest is between the mutation frequencies in the mutDNA and mutvirus samples, because changes in frequencies between these samples represent the action of selection. However, because some of the experimental techniques have the potential to introduce errors, the other samples are also sequenced to quantify these unintended sources of error. Each of the two experimental replicates (replicates A and B) involved independently repeating the entire viral rescue, viral passaging, and sequencing process for each of the four plasmid mutant libraries (WT-1, WT-2, N334H-1, and N334H-2).
F<sc>ig</sc>. 3.
Fig. 3.
Per-codon mutation frequencies for each library (WT-1, WT-2, N334H-1, and N334H-2) in (A) replicate A or (B) replicate B. The samples are named as in figure 2. Errors due to Illumina sequencing (DNA sample), reverse transcription (RNA sample), and viral replication (virus-p1 and virus-p2 samples) are rare and are mostly single-nucleotide changes. The codon-mutant libraries (mutDNA) contain a high frequency of single- and multinucleotide changes as expected from Sanger sequencing (rightmost bars of this plot and fig. 1; note that Sanger sequencing is not subject to Illumina sequencing errors that affect all other samples). Mutations are reduced in mutvirus samples relative to mutDNA plasmids used to create these mutant viruses, with most of the reduction in stop-codon and nonsynonymous mutations—as expected if deleterious mutations are purged by purifying selection. Details of the analysis used to generate these figures are at http://jbloom.github.io/mapmuts/example_2013Analysis_Influenza_NP_Aichi68.html (last accessed May 31, 2014).
F<sc>ig</sc>. 4.
Fig. 4.
The completeness with which mutations were sampled in the mutant plasmids and viruses, as assessed by the counts for each multinucleotide codon mutation in the combined libraries of (A) replicate A or (B) replicate B. Restricting these plots to multinucleotide codon mutations avoids confounding effects from sequencing errors, which typically generate single-nucleotide codon mutations. Very few multinucleotide codon mutations are observed more than once in the unmutagenized controls (DNA, RNA, virus-p1, and virus-p2). Nearly all multinucleotide codon mutations are observed many times in the mutant plasmid libraries (mutDNA). About half the multinucleotide codon mutations are found at least five times in the mutant viruses (mutvirus-p1 and mutvirus-p2), indicating that at least half the possible mutations were incorporated into a virus. However, this is only a lower bound, because deleterious mutations will be absent from the mutant viruses due to purifying selection. If the analysis is restricted to synonymous multinucleotide codon mutations (which are less likely to be deleterious), then over 75% of the possible mutations were incorporated into a virus. This is still only a lower bound, because even synonymous mutations are sometimes strongly deleterious to influenza (Marsh et al. 2008). The completeness with which amino acid mutations are sampled is higher due to the redundancy of the genetic code. Note that replicate A is superior to replicate B in terms of the completeness with which the mutations are sampled by the mutant viruses. Details of the analysis used to generate these figures are at http://jbloom.github.io/mapmuts/example_2013Analysis_Influenza_NP_Aichi68.html (last accessed May 31, 2014).
F<sc>ig</sc>. 5.
Fig. 5.
Amino acid preferences. (A) and (B) Preferences inferred from passages 1 and 2 are similar within each replicate, indicating that most selection occurs during initial viral creation and passage and that technical variation is small. (C) Preferences from the two independent replicates are also correlated but less perfectly. The increased variation is presumably due to stochasticity during the independent viral creation from plasmids for each replicate. (D) Preferences for all sites in NP (the N-terminal Met was not mutagenized) inferred from passage 1 of the combined replicates. Letters’ heights are proportional to the preference for that amino acid and are colored by hydrophobicity. RSA and secondary structure are overlaid for residues in crystal structure. Correlation plots show Pearson’s R and P value. Numerical data for (D) are in supplementary file S1, Supplementary Material online. The preferences are consistent with existing knowledge about mutations to NP (tables 4 and 5). The computer code used to generate this figure is at http://jbloom.github.io/mapmuts/example_2013Analysis_Influenza_NP_Aichi68.html (last accessed May 31, 2014).
F<sc>ig</sc>. 6.
Fig. 6.
The expected frequencies of the amino acids at evolutionary equilibrium using the experimentally determined evolutionary model from passage 1 of the combined replicates and equation (3) for the fixation probabilities. Note that these expected frequencies are slightly different than the amino acid preferences in figure 5D due to the structure of the genetic code. For instance, when arginine and lysine have equal preferences at a site, arginine will tend to have a higher evolutionary equilibrium frequency because it is encoded by more codons. The numerical data are in supplementary file S2, Supplementary Material online. The computer code used to generate this plot is at http://jbloom.github.io/phyloExpCM/example_2013Analysis_Influenza_NP_Human_1918_Descended.html (last accessed May 31, 2014).
F<sc>ig</sc>. 7.
Fig. 7.
Phylogenetic tree of NPs from human influenza descended from a close relative of the 1918 virus. Black: H1N1 from 1918 lineage; green: seasonal H1N1; red: H2N2; blue: H3N2. Maximum-likelihood trees constructed using codonPhyML (Gil et al. 2013) with (A) the GY94 substitution model or (B) the KOSI07+F substitution model. Up to three NP sequences per year from each subtype were used to build the tree. The A/Aichi/2/1968 NP that was the subject of this experiment was not one of the NP sequences randomly subsampled for the tree, so its name is indicated close to a nearly identical sequence that is shown in the tree. The computer code used to generate this tree is at http://jbloom.github.io/phyloExpCM/example_2013Analysis_Influenza_NP_Human_1918_Descended.html (last accessed May 31, 2014).

References

    1. Araya CL, Fowler DM. Deep mutational scanning: assessing protein function on a massive scale. Trends Biotechnol. 2011;29:435–442. - PMC - PubMed
    1. Ashenberg O, Gong LI, Bloom JD. Mutational effects on stability are largely conserved during protein evolution. Proc Natl Acad Sci U S A. 2013;110:21071–21076. - PMC - PubMed
    1. Bao Y, Bolotov P, Dernovoy D, Kiryutin B, Zaslavsky L, Tatusova T, Ostell J, Lipman D. The influenza virus resource at the National Center for Biotechnology Information. J Virol. 2008;82:596–601. - PMC - PubMed
    1. Bershtein S, Segal M, Bekerman R, Tokuriki N, Tawfik DS. Robustness-epistasis link shapes the fitness landscape of a randomly drifting protein. Nature. 2006;444:929–932. - PubMed
    1. Bloom JD, Gong LI, Baltimore D. Permissive secondary mutations enable the evolution of influenza oseltamivir resistance. Science. 2010;328:1272–1275. - PMC - PubMed

Publication types