Role of glucocorticoid-induced leucine zipper (GILZ) in bone acquisition
- PMID: 24860090
- PMCID: PMC4094049
- DOI: 10.1074/jbc.M113.535237
Role of glucocorticoid-induced leucine zipper (GILZ) in bone acquisition
Abstract
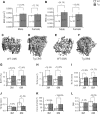
Glucocorticoids (GCs) have both anabolic and catabolic effects on bone. However, no GC anabolic effect mediator has been identified to date. Here we show that targeted expression of glucocorticoid-induced leucine zipper (GILZ), a GC anti-inflammatory effect mediator, enhances bone acquisition in mice. Transgenic mice, in which the expression of GILZ is under the control of a 3.6-kb rat type I collagen promoter, exhibited a high bone mass phenotype with significantly increased bone formation rate and osteoblast numbers. The increased osteoblast activity correlates with enhanced osteogenic differentiation and decreased adipogenic differentiation of bone marrow stromal cell cultures in vitro. In line with these changes, the mRNA levels of key osteogenic regulators (Runx2 and Osx) increased, and the level of adipogenic regulator peroxisome proliferator-activated receptor (PPAR) γ2 decreased significantly. We also found that GILZ physically interacts with C/EBPs and disrupts C/EBP-mediated PPARγ gene transcription. In conclusion, our results showed that GILZ is capable of increasing bone acquisition in vivo, and this action is mediated via a mechanism involving the inhibition of PPARγ gene transcription and shifting of bone marrow MSC/progenitor cell lineage commitment in favor of the osteoblast pathway.
Keywords: Arthritis; Glucocorticoid; Inflammation; Osteoblast; Osteoporosis.
© 2014 by The American Society for Biochemistry and Molecular Biology, Inc.
Figures


Similar articles
-
Regulation of mesenchymal stem cell osteogenic differentiation by glucocorticoid-induced leucine zipper (GILZ).J Biol Chem. 2008 Feb 22;283(8):4723-9. doi: 10.1074/jbc.M704147200. Epub 2007 Dec 14. J Biol Chem. 2008. PMID: 18084007
-
Glucocorticoid-induced leucine zipper (GILZ) antagonizes TNF-α inhibition of mesenchymal stem cell osteogenic differentiation.PLoS One. 2012;7(3):e31717. doi: 10.1371/journal.pone.0031717. Epub 2012 Mar 2. PLoS One. 2012. PMID: 22396737 Free PMC article.
-
Salvianolic acid B prevents bone loss in prednisone-treated rats through stimulation of osteogenesis and bone marrow angiogenesis.PLoS One. 2012;7(4):e34647. doi: 10.1371/journal.pone.0034647. Epub 2012 Apr 6. PLoS One. 2012. PMID: 22493705 Free PMC article.
-
PPARγ and Wnt Signaling in Adipogenic and Osteogenic Differentiation of Mesenchymal Stem Cells.Curr Stem Cell Res Ther. 2016;11(3):216-25. doi: 10.2174/1574888x10666150519093429. Curr Stem Cell Res Ther. 2016. PMID: 25986621 Review.
-
Molecular Mechanisms of PPAR-γ Governing MSC Osteogenic and Adipogenic Differentiation.Curr Stem Cell Res Ther. 2016;11(3):255-64. doi: 10.2174/1574888x10666150531173309. Curr Stem Cell Res Ther. 2016. PMID: 26027680 Review.
Cited by
-
Crosstalk between bone marrow-derived mesenchymal stem cells and regulatory T cells through a glucocorticoid-induced leucine zipper/developmental endothelial locus-1-dependent mechanism.FASEB J. 2015 Sep;29(9):3954-63. doi: 10.1096/fj.15-273664. Epub 2015 Jun 2. FASEB J. 2015. PMID: 26038125 Free PMC article.
-
Could GILZ Be the Answer to Glucocorticoid Toxicity in Lupus?Front Immunol. 2019 Jul 17;10:1684. doi: 10.3389/fimmu.2019.01684. eCollection 2019. Front Immunol. 2019. PMID: 31379872 Free PMC article. Review.
-
Deletion of PPARγ in Mesenchymal Lineage Cells Protects Against Aging-Induced Cortical Bone Loss in Mice.J Gerontol A Biol Sci Med Sci. 2020 Apr 17;75(5):826-834. doi: 10.1093/gerona/glaa049. J Gerontol A Biol Sci Med Sci. 2020. PMID: 32060555 Free PMC article.
-
GILZ as a Mediator of the Anti-Inflammatory Effects of Glucocorticoids.Front Endocrinol (Lausanne). 2015 Nov 9;6:170. doi: 10.3389/fendo.2015.00170. eCollection 2015. Front Endocrinol (Lausanne). 2015. PMID: 26617572 Free PMC article. Review.
-
Human nonunion tissues display differential gene expression in comparison to physiological fracture callus.Bone. 2024 Jun;183:117091. doi: 10.1016/j.bone.2024.117091. Epub 2024 Apr 2. Bone. 2024. PMID: 38570121 Free PMC article.
References
-
- Nishimura J., Ikuyama S. (2000) Glucocorticoid-induced osteoporosis: pathogenesis and management. J. Bone Miner. Metab. 18, 350–352 - PubMed
-
- Clowes J. A., Peel N., Eastell R. (2001) Glucocorticoid-induced osteoporosis. Curr. Opin. Rheumatol. 13, 326–332 - PubMed
-
- Soule S. (1999) Addison's disease in Africa: a teaching hospital experience. Clin. Endocrinol. (Oxf.) 50, 115–120 - PubMed
-
- Valero M. A., Leon M., Ruiz Valdepeñas M. P., Larrodera L., Lopez M. B., Papapietro K., Jara A., Hawkins F. (1994) Bone density and turnover in Addison's disease: effect of glucocorticoid treatment. Bone Miner. 26, 9–17 - PubMed
-
- Sher L. B., Woitge H. W., Adams D. J., Gronowicz G. A., Krozowski Z., Harrison J. R., Kream B. E. (2004) Transgenic expression of 11β-hydroxysteroid dehydrogenase type 2 in osteoblasts reveals an anabolic role for endogenous glucocorticoids in bone. Endocrinology 145, 922–929 - PubMed
Publication types
MeSH terms
Substances
Grants and funding
LinkOut - more resources
Full Text Sources
Other Literature Sources
Molecular Biology Databases
Miscellaneous

