

Increasing water use efficiency along the C3 to C4 evolutionary pathway: a stomatal optimization perspective
- PMID: 24860185
- PMCID: PMC4085968
- DOI: 10.1093/jxb/eru205
Increasing water use efficiency along the C3 to C4 evolutionary pathway: a stomatal optimization perspective
Abstract
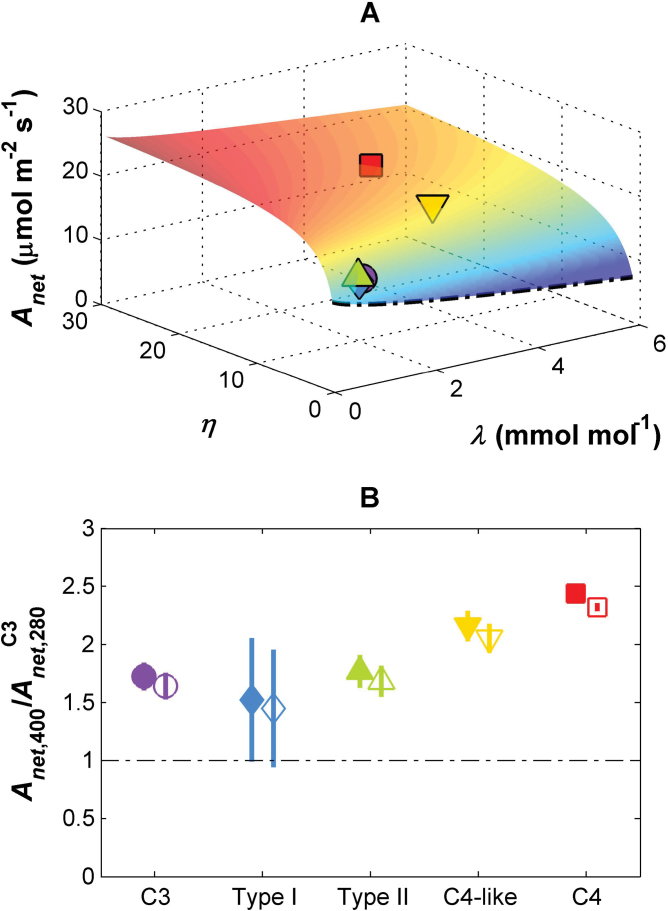
C4 photosynthesis evolved independently numerous times, probably in response to declining atmospheric CO2 concentrations, but also to high temperatures and aridity, which enhance water losses through transpiration. Here, the environmental factors controlling stomatal behaviour of leaf-level carbon and water exchange were examined across the evolutionary continuum from C3 to C4 photosynthesis at current (400 μmol mol(-1)) and low (280 μmol mol(-1)) atmospheric CO2 conditions. To this aim, a stomatal optimization model was further developed to describe the evolutionary continuum from C3 to C4 species within a unified framework. Data on C3, three categories of C3-C4 intermediates, and C4 Flaveria species were used to parameterize the stomatal model, including parameters for the marginal water use efficiency and the efficiency of the CO2-concentrating mechanism (or C4 pump); these two parameters are interpreted as traits reflecting the stomatal and photosynthetic adjustments during the C3 to C4 transformation. Neither the marginal water use efficiency nor the C4 pump strength changed significantly from C3 to early C3-C4 intermediate stages, but both traits significantly increased between early C3-C4 intermediates and the C4-like intermediates with an operational C4 cycle. At low CO2, net photosynthetic rates showed continuous increases from a C3 state, across the intermediates and towards C4 photosynthesis, but only C4-like intermediates and C4 species (with an operational C4 cycle) had higher water use efficiencies than C3 Flaveria. The results demonstrate that both the marginal water use efficiency and the C4 pump strength increase in C4 Flaveria to improve their photosynthesis and water use efficiency compared with C3 species. These findings emphasize that the advantage of the early intermediate stages is predominantly carbon based, not water related.
Keywords: C3 photosynthesis; C3–C4 intermediates; leaf gas exchange; photosynthetic model; stomatal conductance; water use efficiency..
© The Author 2014. Published by Oxford University Press on behalf of the Society for Experimental Biology.
Figures


Similar articles
-
The evolution of stomatal traits along the trajectory toward C4 photosynthesis.Plant Physiol. 2022 Aug 29;190(1):441-458. doi: 10.1093/plphys/kiac252. Plant Physiol. 2022. PMID: 35652758 Free PMC article.
-
C2 photosynthesis generates about 3-fold elevated leaf CO2 levels in the C3-C4 intermediate species Flaveria pubescens.J Exp Bot. 2014 Jul;65(13):3649-56. doi: 10.1093/jxb/eru239. Epub 2014 Jun 10. J Exp Bot. 2014. PMID: 24916069 Free PMC article.
-
Effects of low atmospheric CO2 and elevated temperature during growth on the gas exchange responses of C3, C3-C4 intermediate, and C4 species from three evolutionary lineages of C4 photosynthesis.Oecologia. 2012 Jun;169(2):341-52. doi: 10.1007/s00442-011-2201-z. Epub 2011 Dec 3. Oecologia. 2012. PMID: 22139428
-
Photosynthesis research on yellowtops: macroevolution in progress.Theory Biosci. 2007 Apr;125(2):81-92. doi: 10.1016/j.thbio.2006.06.001. Epub 2006 Jul 18. Theory Biosci. 2007. PMID: 17412289 Review.
-
A scheme for C4 evolution derived from a comparative analysis of the closely related C3, C3-C4 intermediate, C4-like, and C4 species in the genus Flaveria.Plant Mol Biol. 2022 Nov;110(4-5):445-454. doi: 10.1007/s11103-022-01246-z. Epub 2022 Feb 4. Plant Mol Biol. 2022. PMID: 35119574 Review.
Cited by
-
The evolution of stomatal traits along the trajectory toward C4 photosynthesis.Plant Physiol. 2022 Aug 29;190(1):441-458. doi: 10.1093/plphys/kiac252. Plant Physiol. 2022. PMID: 35652758 Free PMC article.
-
Multiscale Metabolic Modeling of C4 Plants: Connecting Nonlinear Genome-Scale Models to Leaf-Scale Metabolism in Developing Maize Leaves.PLoS One. 2016 Mar 18;11(3):e0151722. doi: 10.1371/journal.pone.0151722. eCollection 2016. PLoS One. 2016. PMID: 26990967 Free PMC article.
-
The carbon isotopic signature of C4 crops and its applicability in breeding for climate resilience.Theor Appl Genet. 2021 Jun;134(6):1663-1675. doi: 10.1007/s00122-020-03761-3. Epub 2021 Feb 11. Theor Appl Genet. 2021. PMID: 33575820 Free PMC article. Review.
-
Comparison of Transcriptional Response of C3 and C4 Plants to Drought Stress Using Meta-Analysis and Systems Biology Approach.Front Plant Sci. 2021 Jul 1;12:668736. doi: 10.3389/fpls.2021.668736. eCollection 2021. Front Plant Sci. 2021. PMID: 34276729 Free PMC article.
-
Dual mechanisms regulate ecosystem stability under decade-long warming and hay harvest.Nat Commun. 2016 Jun 15;7:11973. doi: 10.1038/ncomms11973. Nat Commun. 2016. PMID: 27302085 Free PMC article.
References
-
- Busch FA, Sage TL, Cousins AB, Sage RF. 2013. C3 plants enhance rates of photosynthesis by reassimilating photorespired and respired CO2 . Plant, Cell and Environment 36, 200–212 - PubMed
-
- Campbell GS, Norman JM. 1998. An introduction to environmental biophysics, 2nd edn Berlin: Springer
-
- Campbell CD, Sage RF, Kocacinar F, Way DA. 2005. Estimation of the whole-plant CO2 compensation point of tobacco (Nicotiana tabacum L.). Global Change Biology 11, 1956–1967
-
- Cheng L, Fuchigami LH, Breen PJ. 2001. The relationship between photosystem II efficiency and quantum yield for CO2 assimilation is not affected by nitrogen content in apple leaves. Journal of Experimental Botany 52, 1865–1872 - PubMed
-
- Christin PA, Osborne CP, Sage RF, Arakaki M, Edwards EJ. 2011. C4 eudicots are not younger than C4 monocots. Journal of Experimental Botany 62, 3171–3181 - PubMed
Publication types
MeSH terms
Substances
LinkOut - more resources
Full Text Sources
Other Literature Sources
Miscellaneous
