. 2014 Jul 1;193(1):139-49.
doi: 10.4049/jimmunol.1303284. Epub 2014 May 23.

Astrocytic TGF-β signaling limits inflammation and reduces neuronal damage during central nervous system Toxoplasma infection

Affiliations

Astrocytic TGF-β signaling limits inflammation and reduces neuronal damage during central nervous system Toxoplasma infection

Egle Cekanaviciute et al. J Immunol. .

Abstract

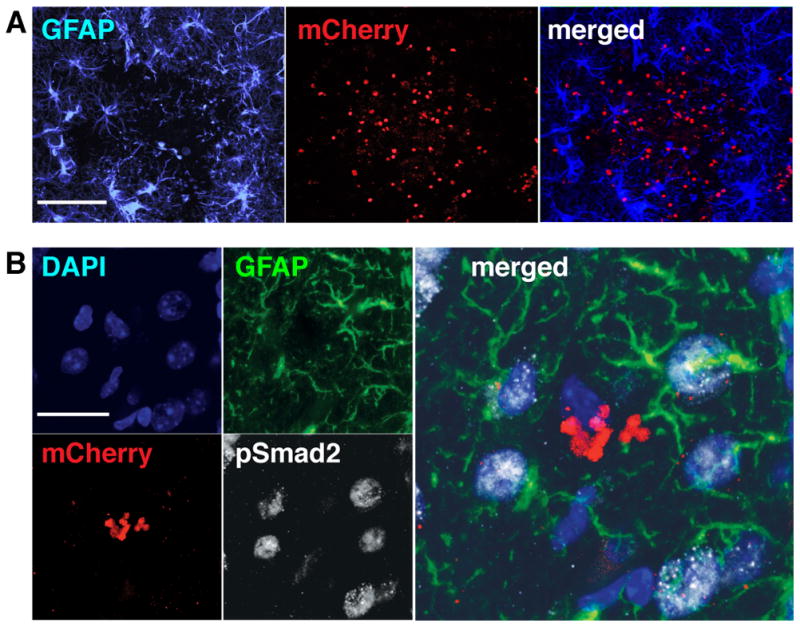
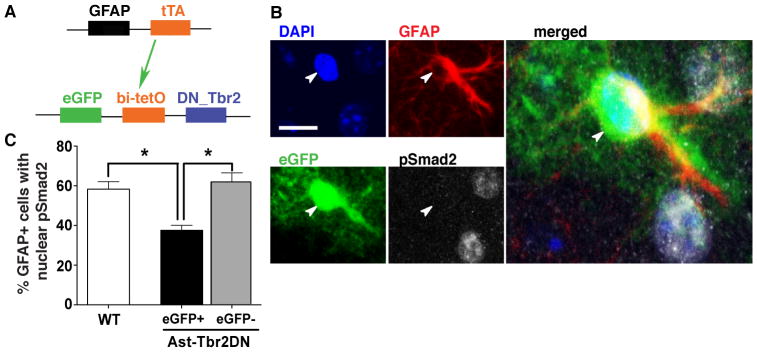
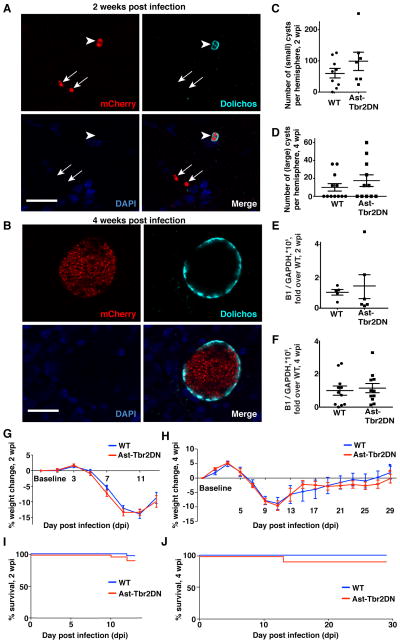
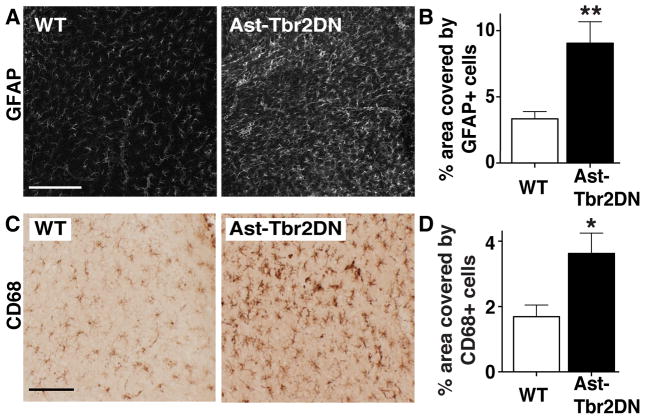
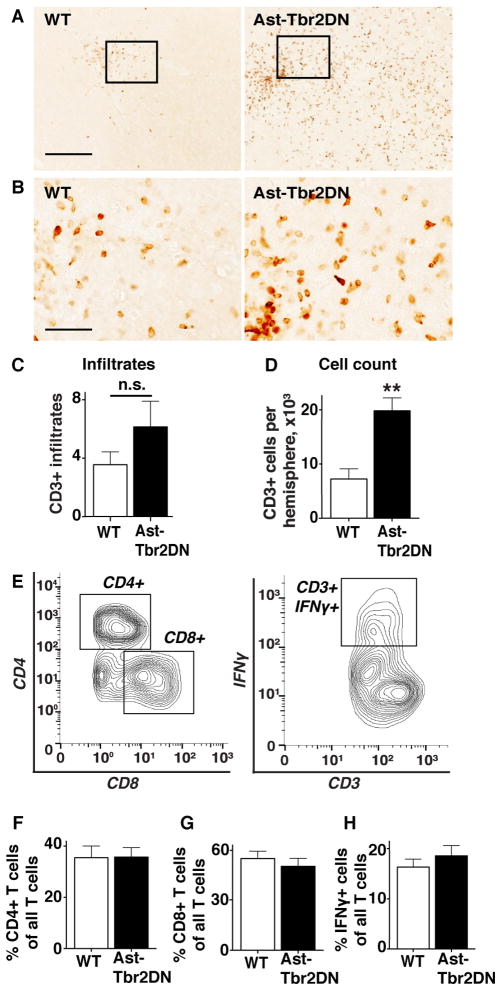
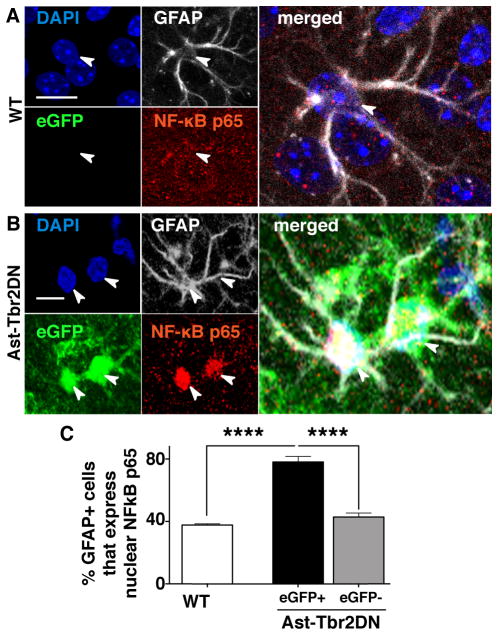
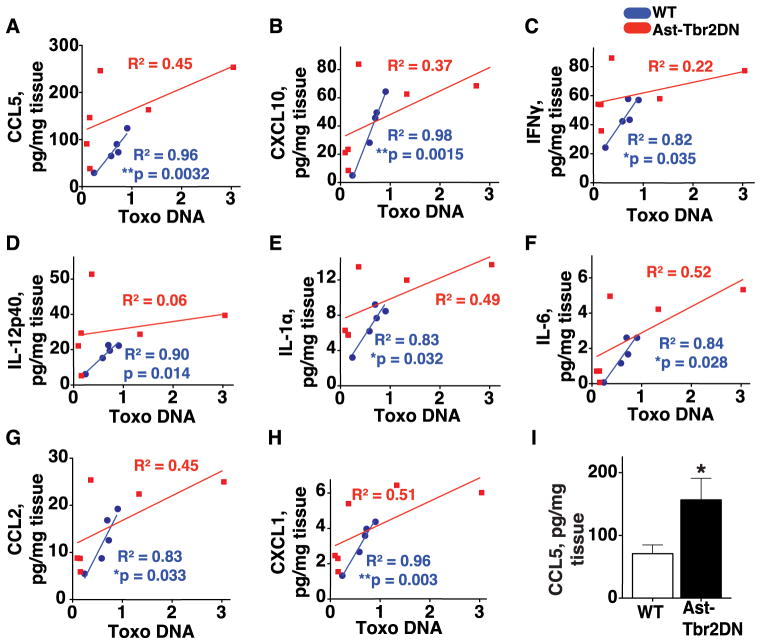
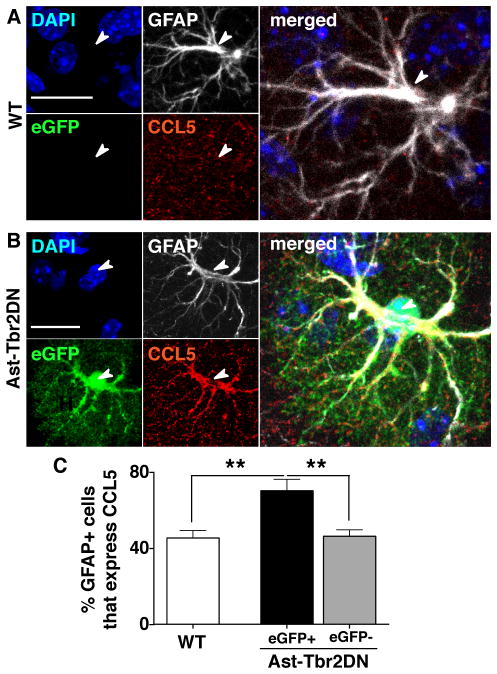
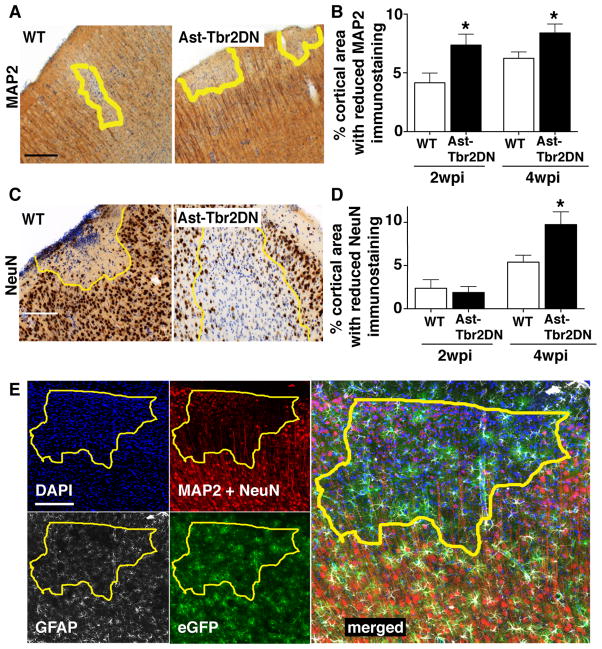
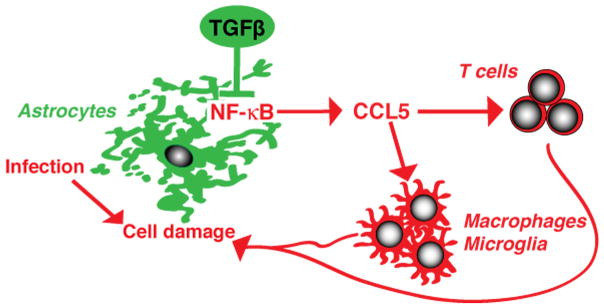
The balance between controlling infection and limiting inflammation is particularly precarious in the brain because of its unique vulnerability to the toxic effects of inflammation. Astrocytes have been implicated as key regulators of neuroinflammation in CNS infections, including infection with Toxoplasma gondii, a protozoan parasite that naturally establishes a chronic CNS infection in mice and humans. In CNS toxoplasmosis, astrocytes are critical to controlling parasite growth. They secrete proinflammatory cytokines and physically encircle parasites. However, the molecular mechanisms used by astrocytes to limit neuroinflammation during toxoplasmic encephalitis have not yet been identified. TGF-β signaling in astrocytes is of particular interest because TGF-β is universally upregulated during CNS infection and serves master regulatory and primarily anti-inflammatory functions. We report in this study that TGF-β signaling is activated in astrocytes during toxoplasmic encephalitis and that inhibition of astrocytic TGF-β signaling increases immune cell infiltration, uncouples proinflammatory cytokine and chemokine production from CNS parasite burden, and increases neuronal injury. Remarkably, we show that the effects of inhibiting astrocytic TGF-β signaling are independent of parasite burden and the ability of GFAP(+) astrocytes to physically encircle parasites.


Conflict of interest statement

Conflict of Interest: the authors declare no competing financial interests.

Figures

Figure 1
Figure 1. TGFβ signaling is activated in brain cells, including astrocytes during CNS toxoplasmosis
Brain sections from wildtype mice infected with mCherry-expressing Toxoplasma were stained as indicated and then examined by confocal microscopy. A. Representative images showing astrocytes that immunostain for GFAP+ (left panel, blue), mCherry+ parasites (middle panel, red), and the merged image (right panel). Scale bar, 200 μm. B. Representative images of pSmad2 and GFAP co-immunostaining in areas surrounding mCherry+ Toxoplasma infiltrates. Panels: DAPI-stained nuclei (upper left panel, blue), GFAP+ astrocytes (upper right panel, green), mCherry+ parasites (lower left panel, red), pSmad2 staining (lower right panel, white), and merge of all 4 channels (right panel). Arrowheads highlight nuclei associated with the GFAP+ astrocytes seen in these images. Scale bar, 20 μm.
Figure 2
Figure 2. During Toxoplasma infection TGFβ signaling is inhibited specifically in eGFP+ astrocytes in Ast-Tbr2DN mice
A. Schematic representation of the double-transgenic Astrocytic Tbr2 Dominant Negative mouse (Ast-Tbr2DN) line. The first transgene encodes the tetracycline transactivator protein (tTA), driven by a GFAP promoter. tTA binds the bidirectional bi-tetO promoter on the second transgene to stimulate expression of both eGFP and a dominant negative mutant type II TGFβ receptor which cannot initiate downstream signaling. B. Representative images of 2 wpi Ast-Tbr2DN brain section, stained as indicated. Arrowhead denotes the nucleus of the GFAP+/eGFP+ cell. Scale bar, 20 μm. Large image: Enlargement of merged image (all 4 channels). C. Percentage of GFAP+ cells in wildtype or Ast-Tbr2DN brain sections that showed nuclear pSmad2 expression at 2 wpi, as assessed by confocal microscopy. Note that in Ast-Tbr2DN mice the GFAP+ cells are subdivided into GFAP+/eGFP+ and GFAP+/eGFP cells. N=4 mice per genotype, 100 GFAP+ cells per mouse. Bars, mean ± SEM. *P<0.05, Kruskal-Wallis test with Dunn’s correction for multiple comparisons.
Figure 3
Figure 3. Inhibiting astrocytic TGFβ signaling does not affect Toxoplasma parasite burden in the brain, weight loss, or mortality
A–F. Toxoplama burden in the brain during acute (2wpi) and chronic (4wpi) infection. A, B. Representative images of brain cysts at 2 wpi and 4wpi. Panels: mCherry signal from parasites (upper left), Dolichos biflorus agglutinin (upper right) which stains the cyst wall, DAPI (lower left) and merge (lower right). Arrowheads point to cysts. Arrows point to free tachyzoites (2 wpi). No free tachyzoites were seen in 4 wpi brain sections. Scale bars, 20 μm. C, D. mCherry+ Dolichos+ Toxoplasma cysts were counted at 2wpi and 4wpi. Bars, mean ± SEM. N=7–9 mice per genotype at 2 wpi, 11–12 mice per genotype at 4 wpi. E, F. At 2 and 4 wpi brain homogenates were used to isolate Toxoplasma and mouse genomic DNA for quantitative real-time PCR for the Toxoplasma specific gene B1 and loading control GAPDH for quantification of Toxoplasma genomic DNA. Bars, mean ± SEM. N=6 mice per genotype at 2 wpi, 11 mice per genotype 4 wpi. G, H. Weight loss in Ast-Tbr2DN mice and wildtype controls. Bars, mean ± SEM. G. Combined data from three independent experiments, N=19–21 mice per genotype. H. N=11–12 mice per genotype. I, J. Mortality in Ast-Tbr2DN mice and wildtype controls. Mantel-Cox (log-rank) test to compare mortality between genotypes. I. Combined data from five independent experiments, N=34 mice per genotype. (J) N=12 mice per genotype.
Figure 4
Figure 4. Lack of astrocytic TGFβ signaling increases the reactive astrogliosis and microglial/macrophage infiltration to acute Toxoplasma infection
Brain sections from 2 wpi wildtype (WT) or Ast-Tbr2DN mice were stained as indicated and examined by light microscopy. For (B) and (D) quantification was done by stereology. A, B. Representative images (A) and quantification (B) of cortical area covered by GFAP+ reactive astrocytes in Ast-Tbr2DN and wildtype mice. C, D. Representative images (C) and quantification (D) of cortical area covered by CD68+ activated microglia and infiltrating macrophages in Ast-Tbr2DN and wildtype mice. Scale bar, 200 μm. N=7–9 mice per genotype, 2 images per mouse (B) and 5 images per mouse (D) 480 μm apart. Bars, mean ± SEM. *P<0.05, **P<0.01, Student’s t test.
Figure 5
Figure 5. Lack of astrocytic TGFβ signaling exacerbates the T cell response to acute Toxoplasma infection
Brain sections from 2 wpi wildtype (WT) or Ast-Tbr2DN mice were stained for CD3, examined by light microscopy and quantified using stereology. A. Representative images of CD3+ cells in the cortex of Ast-Tbr2DN and wildtype mice. Scale bar, 200 μm. B. Enlargement of boxed area of A. Scale bar, 50 μm. C. Numbers of discrete CD3+ cortical infiltrates in Ast-Tbr2DN and wildtype mice as quantified by 2 observers using light microscopy. N = 7–9 mice per genotype D. Stereology was used to quantify the total counts of CD3+ cells in cortex of Ast-Tbr2DN and wildtype mice. N=5 sections per mouse 480 μm apart, 7–9 mice per genotype. E–H. At 2 wpi, T cell lymphocytes were isolated from Ast-Tbr2DN and wildtype (WT) mice and analyzed by flow cytometery for the percentage of CD4+, CD8+ and CD3+IFNγ+ cells E. A representative analysis of the CD3+ cells isolated from the brain homogenate of a single mouse. F–H. Quantification of % CD3+ cell populations that are CD4+ (F) and CD8+ (G) in Ast-Tbr2DN and wildtype mice. H. Quantification of % CD3+ cell population that are IFNγ+ in Ast-Tbr2DN mice and wildtype controls. N=6 mice per genotype. Bars, mean ± SEM. **P<0.01, Student’s t test.
Figure 6
Figure 6. Lack of astrocytic TGFβ signaling increases NF-κB pathway activation in eGFP+ astrocytes
A., B. Representative images of 2 wpi wildtype (WT) (A) and Ast-Tbr2DN (B) brain sections stained as indicated. Arrowheads denote the nuclei of the associated GFAP+ cells. C. Quantification of % of GFAP+ astrocytes that immunostain for nuclear NF-κB p65 in wildtype and Ast-Tbr2DN mice. Note that in Ast-Tbr2DN mice the GFAP+ cells are subdivided into GFAP+/eGFP+ and GFAP+/eGFP cells. Scale bars, 20μm. N=6 mice per genotype. Bars, mean ± SEM. ****P<0.0001, 1-way ANOVA with Bonferroni correction for multiple comparisons.
Figure 7
Figure 7. Inhibition of astrocytic TGFβ signaling leads to loss of correlation of Th1 cytokine and chemokine levels to acute CNS Toxoplasma burden
At 2 wpi, brain homogenates from Ast-Tbr2DN and wildtype (WT) mice were used to quantify multiple cytokines and chemokines via multiplex cytokine assay and Toxoplasma burden (measured as B1 gene DNA, normalized to GADPH control gene DNA and expressed as fold over wildtype mean) via quantitative-PCR. A–H. Linear regressions of the Toxoplasma burden plotted against the levels of T cell chemokines CCL5 (A) and CXCL10 (B); Th1 cytokines IFNγ(C), IL-12p40 (D), IL-1a (E) and IL-6 (F); and myeloid cell chemoattractants CCL2 (G) and CXCL1 (H). Blue circles, wildtype mice. Red squares, Ast-Tbr2DN mice. There is a statistically significant linear correlation between Toxoplasma load and Th1 cytokines and chemokines in wildtype controls (blue line), but it is lost in Ast-Tbr2DN mice (red line). I, Mean CCL5 levels were approximately twice normal in Ast-Tbr2DN mouse brains. N=6 mice per genotype. Bars, mean ± SEM. *P<0.05, Student’s t test.
Figure 8
Figure 8. Ast-Tbr2DN mice exhibit increased immunostaining for CCL5 expression in eGFP+ astrocytes
A., B. Representative images 2 wpi from wildtype (WT) (A) and Ast-Tbr2DN (B) brain sections stained as indicated. Arrowheads denote the nuclei of the associated GFAP+ cells. C. Quantification of % of GFAP+ astrocytes that immunostain for CCL5 in wildtype controls and Ast-Tbr2DN mice. Note that in Ast-Tbr2DN mice the GFAP+ cells are subdivided into GFAP+/eGFP+ and GFAP+/eGFP cells. Scale bars, 20μm. N=6 mice per genotype. Bars, mean ± SEM. **P<0.01, 1-way ANOVA with Bonferroni correction for multiple comparisons.
Figure 9
Figure 9. Inhibiting astrocytic TGFβ signaling increases neuronal damage during Toxoplasma infection
2 and 4 wpi Ast-Tbr2DN and wildtype (WT) brain sections were stained as indicated and examined by light microscopy. A, C. Representative images of loss of MAP2 (A) or NeuN (C) staining in Ast-Tbr2DN or WT brain sections at 4 wpi. Yellow line represents area observed to have loss of stain. B., D. Quantification of the percentage of cortical areas denoted to have loss of MAP2 (B) or NeuN (D) staining in Ast-Tbr2DN or WT mice. E. Representative images of eGFP+/GFAP+ astrocytes in areas of neuronal damage in an Ast-Tbr2DN mouse 4wpi. Panels: DAPI-stained nuclei (upper left panel, blue), neuronal markers, which are composed of MAP2+ dendrites together with NeuN+ neuronal nuclei(upper right panel, red), GFAP+ astrocytes (lower left panel, white), eGFP+ transgenic astrocytes (lower right panel, green), and merge of all 4 channels (right panel). Yellow line represents area observed to have loss of neuronal marker immunostaining. Scale bars, 200 μm. N=5 images per mouse, 6 mice per genotype 2 wpi, 11–12 mice per genotype 4 wpi. Bars, mean ± SEM. *P<0.05, Student’s t test to compare with wildtype at same time point. In uninfected mice, there are no differences in gross neuroanatomical structures between Ast-Tbr2DN and wildtype littermates.
Figure 10
Figure 10
Proposed model of the functions of endogenous astrocytic TGFβ signaling during CNS Toxoplasma infection.

Similar articles

Cited by

References

    1. Farina C, Aloisi F, Meinl E. Astrocytes are active players in cerebral innate immunity. Trends Immunol. 2007;28:138–145. - PubMed
    1. Ransohoff RM, Engelhardt B. The anatomical and cellular basis of immune surveillance in the central nervous system. Nat Rev Immunol. 2012;12:623–635. - PubMed
    1. Carpentier PA, Begolka WS, Olson JK, Elhofy A, Karpus WJ, Miller SD. Differential activation of astrocytes by innate and adaptive immune stimuli. Glia. 2005;49:360–374. - PubMed
    1. Wanner IB, Anderson MA, Song B, Levine J, Fernandez A, Gray-Thompson Z, Ao Y, Sofroniew MV. Glial Scar Borders Are Formed by Newly Proliferated, Elongated Astrocytes That Interact to Corral Inflammatory and Fibrotic Cells via STAT3-Dependent Mechanisms after Spinal Cord Injury. J Neurosci. 2013;33:12870–12886. - PMC - PubMed
    1. Bush TG, Puvanachandra N, Horner CH, Polito A, Ostenfeld T, Svendsen CN, Mucke L, Johnson MH, Sofroniew MV. Leukocyte infiltration, neuronal degeneration, and neurite outgrowth after ablation of scar-forming, reactive astrocytes in adult transgenic mice. Neuron. 1999;23:297–308. - PubMed

Publication types

MeSH terms

Substances

LinkOut - more resources