Predicting Intra-Urban Variation in Air Pollution Concentrations with Complex Spatio-Temporal Dependencies
- PMID: 24860253
- PMCID: PMC4029437
- DOI: 10.1002/env.1014
Predicting Intra-Urban Variation in Air Pollution Concentrations with Complex Spatio-Temporal Dependencies
Abstract
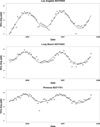
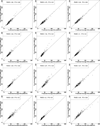
We describe a methodology for assigning individual estimates of long-term average air pollution concentrations that accounts for a complex spatio-temporal correlation structure and can accommodate spatio-temporally misaligned observations. This methodology has been developed as part of the Multi-Ethnic Study of Atherosclerosis and Air Pollution (MESA Air), a prospective cohort study funded by the U.S. EPA to investigate the relationship between chronic exposure to air pollution and cardiovascular disease. Our hierarchical model decomposes the space-time field into a "mean" that includes dependence on covariates and spatially varying seasonal and long-term trends and a "residual" that accounts for spatially correlated deviations from the mean model. The model accommodates complex spatio-temporal patterns by characterizing the temporal trend at each location as a linear combination of empirically derived temporal basis functions, and embedding the spatial fields of coefficients for the basis functions in separate linear regression models with spatially correlated residuals (universal kriging). This approach allows us to implement a scalable single-stage estimation procedure that easily accommodates a significant number of missing observations at some monitoring locations. We apply the model to predict long-term average concentrations of oxides of nitrogen (NOx) from 2005-2007 in the Los Angeles area, based on data from 18 EPA Air Quality System regulatory monitors. The cross-validated R2 is 0.67. The MESA Air study is also collecting additional concentration data as part of a supplementary monitoring campaign. We describe the sampling plan and demonstrate in a simulation study that the additional data will contribute to improved predictions of long-term average concentrations.
Keywords: Air Pollution; Exposure Assessment; Hierarchical Modeling; Maximum Likelihood; Spatio-Temporal Modeling; Universal Kriging.
Figures


References
-
- Banerjee S, Carlin BP, Gelfand AE. Hierarchical Modeling and Analysis for Spatial Data. Chapman and Hall: CRC; 2004.
-
- Basu R, Woodruff TJ, Parker JD, Saulnier L, Schoendorf KC. Particulate air pollution and mortality: Findings from 20 U.S. cities. New England Journal of Medicine. 2000;343(24):1742–1749. - PubMed
-
- Brauer M, Hoek G, van Vliet P, Meliefste K, Fischer P, Gehring U, Heinrich J, Cyrys J, Bellander T, Lewne M, Brunekreef B. Estimating long-term average particulate air pollution concentrations: Application of traffic indicators and geographic information systems. Epidemiology. 2003;14(2):228–239. - PubMed
-
- Byrd RH, Lu P, Nocedal J, Zhu C. A limited memory algorithm for bound constrained optimization. SIAM Journal on Scientific Computing. 1995;16:1190–1208.
-
- Cohen MA, Adar SD, Allen RW, Avol E, Curl CL, Gould T, Hardie D, Ho A, Kinney P, Larson TV, Sampson PD, Sheppard L, Stukovsky KD, Swan SS, Liu L-JS, Kaufman JD. Approach to estimating participant pollutant exposures in the Multi-Ethnic Study of Atherosclerosis and Air Pollution (MESA Air) Environmental Science and Technology. 2009 In Press. - PMC - PubMed
Grants and funding
LinkOut - more resources
Full Text Sources
Research Materials
