. 2014 May 13:8:124.
doi: 10.3389/fncel.2014.00124. eCollection 2014.

Mitochondrial dysfunction induced by frataxin deficiency is associated with cellular senescence and abnormal calcium metabolism

Affiliations

Mitochondrial dysfunction induced by frataxin deficiency is associated with cellular senescence and abnormal calcium metabolism

Arantxa Bolinches-Amorós et al. Front Cell Neurosci. .

Abstract

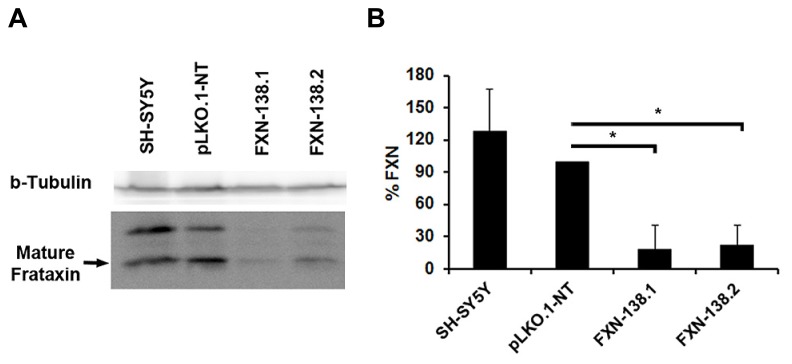
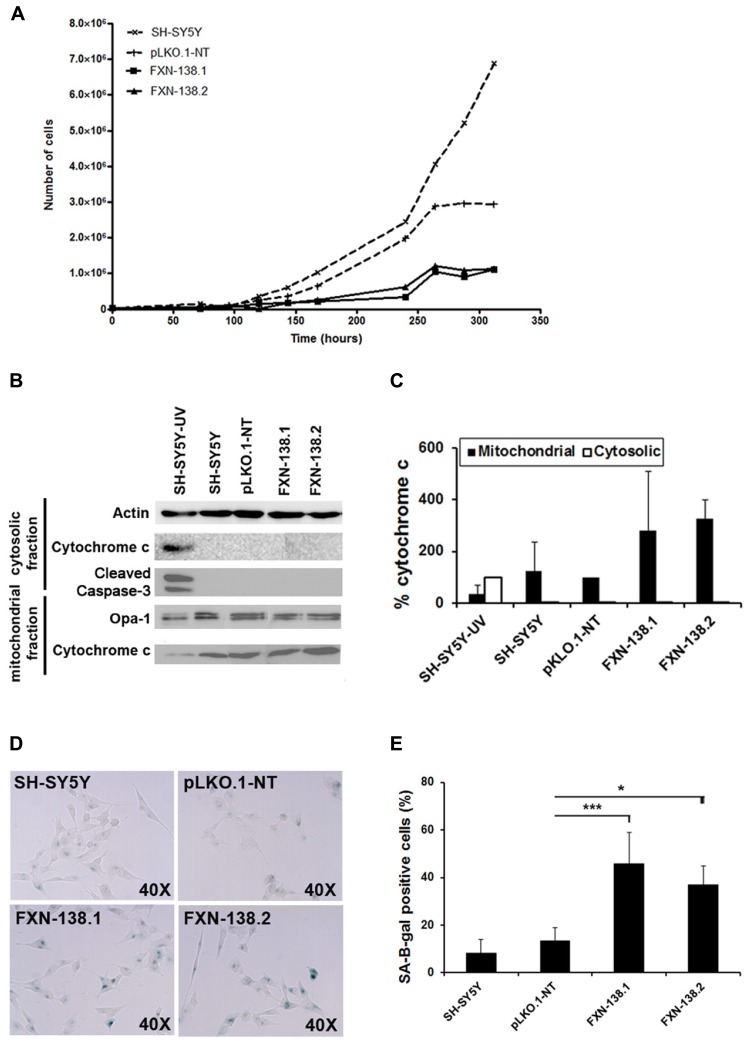
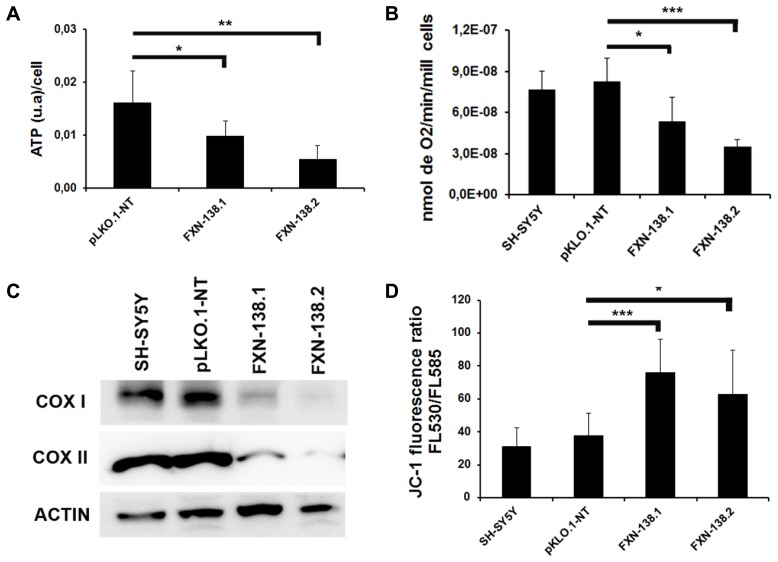
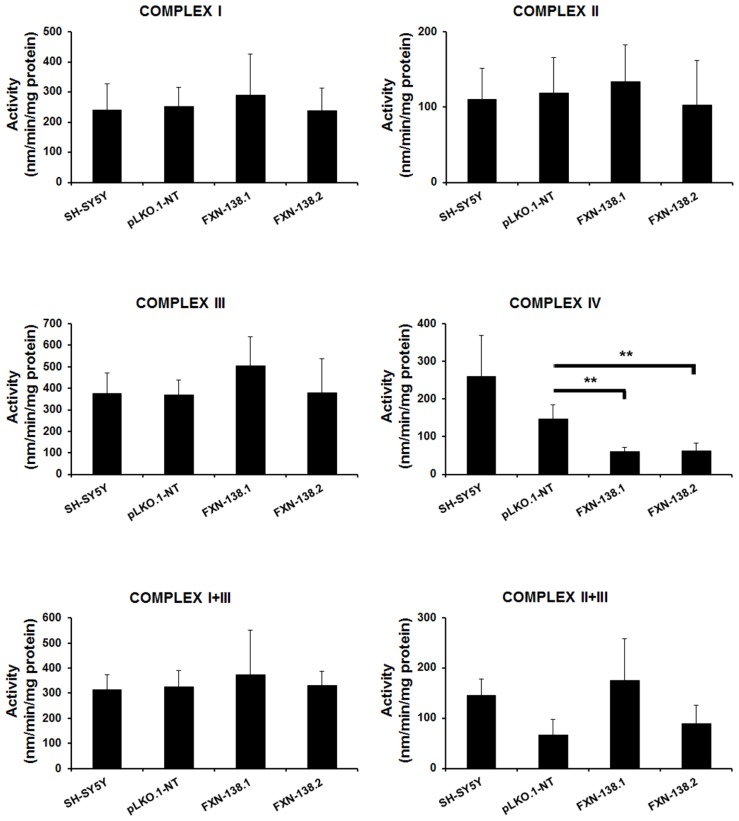
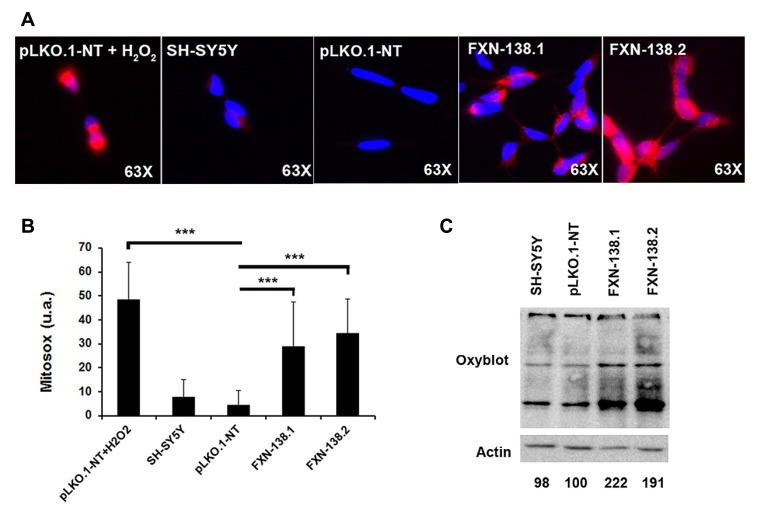
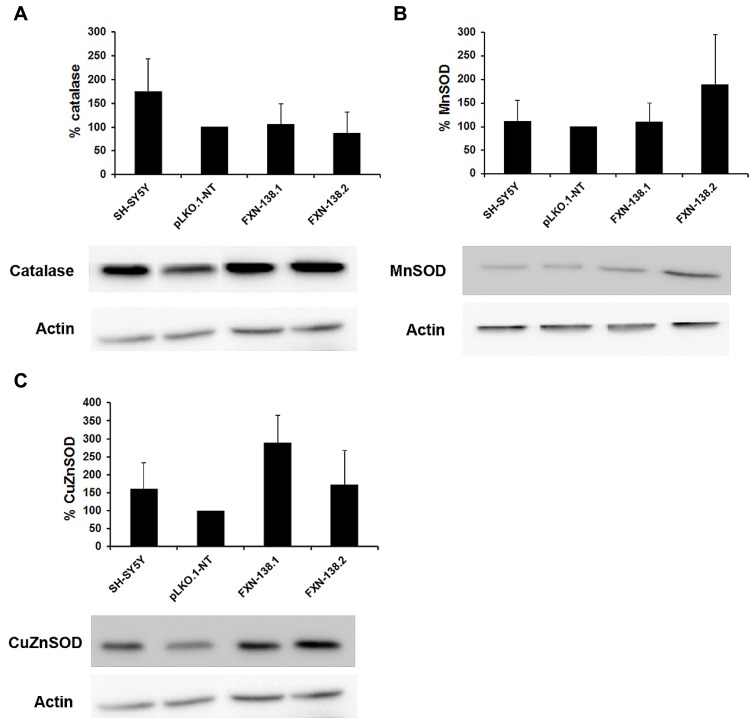
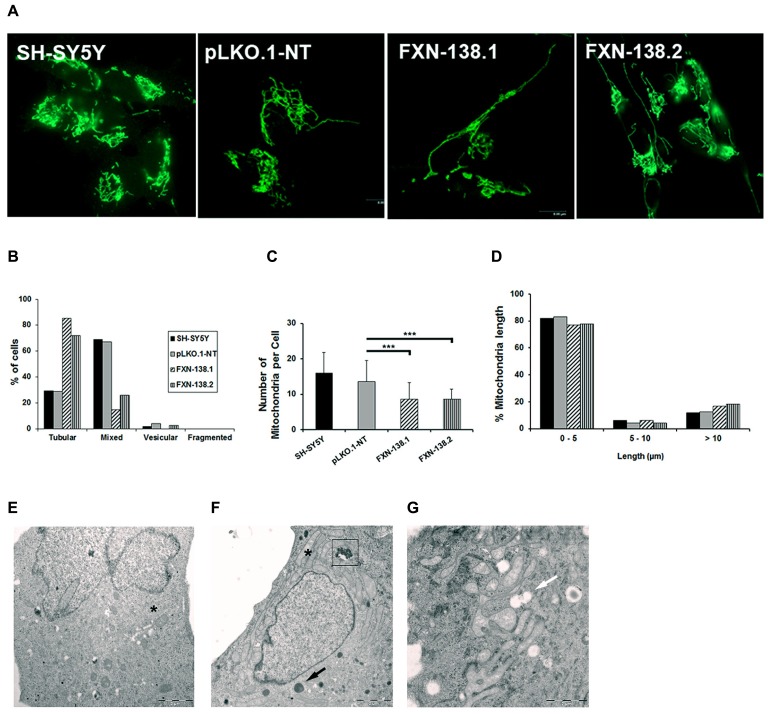
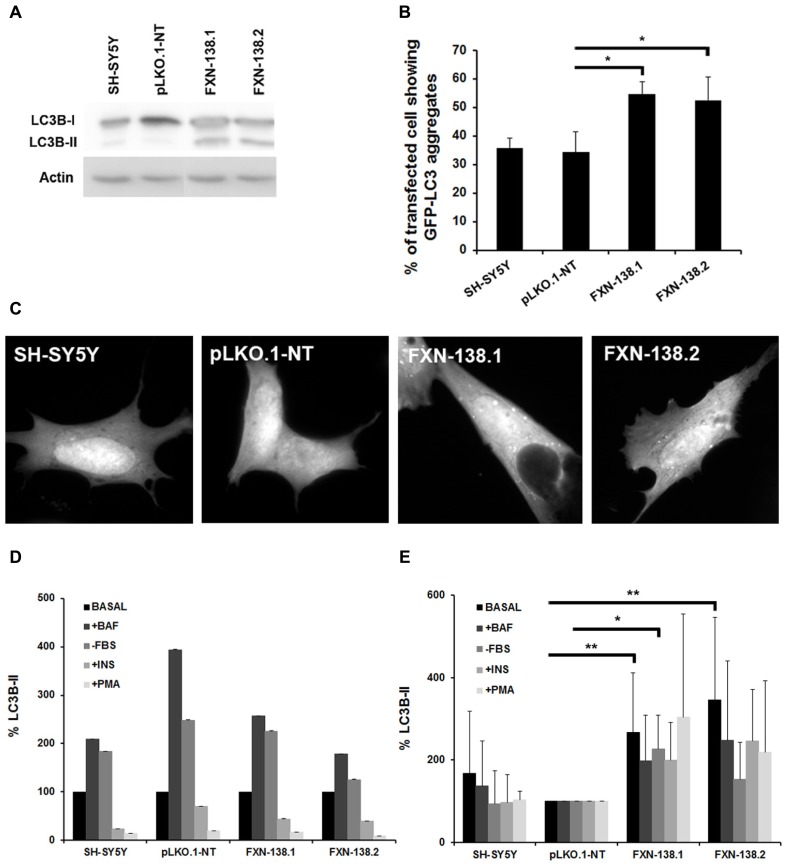
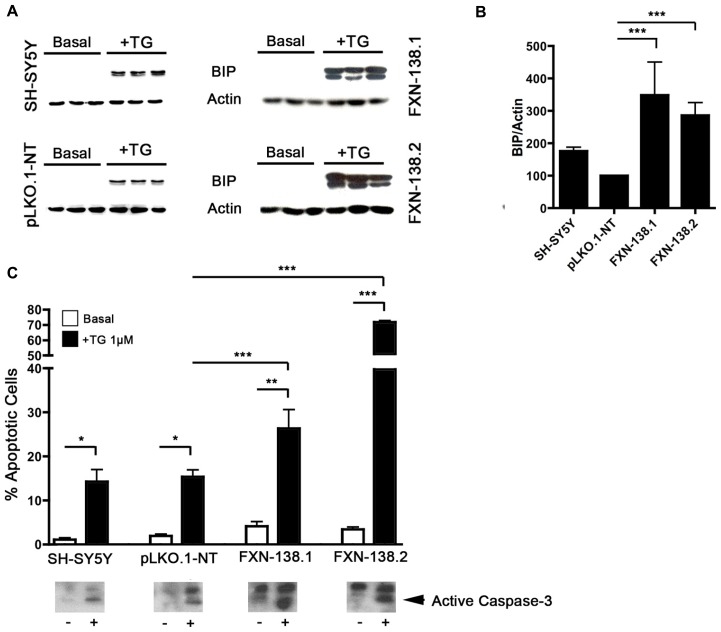
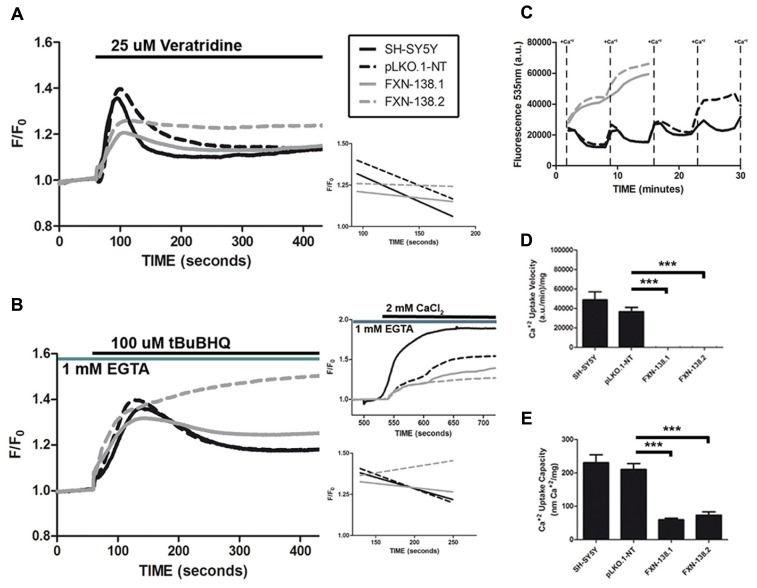
Friedreich ataxia is considered a neurodegenerative disorder involving both the peripheral and central nervous systems. Dorsal root ganglia (DRG) are the major target tissue structures. This neuropathy is caused by mutations in the FXN gene that encodes frataxin. Here, we investigated the mitochondrial and cell consequences of frataxin depletion in a cellular model based on frataxin silencing in SH-SY5Y human neuroblastoma cells, a cell line that has been used widely as in vitro models for studies on neurological diseases. We showed that the reduction of frataxin induced mitochondrial dysfunction due to a bioenergetic deficit and abnormal Ca(2+) homeostasis in the mitochondria that were associated with oxidative and endoplasmic reticulum stresses. The depletion of frataxin did not cause cell death but increased autophagy, which may have a cytoprotective effect against cellular insults such as oxidative stress. Frataxin silencing provoked slow cell growth associated with cellular senescence, as demonstrated by increased SA-βgal activity and cell cycle arrest at the G1 phase. We postulate that cellular senescence might be related to a hypoplastic defect in the DRG during neurodevelopment, as suggested by necropsy studies.

Keywords: ER-stress; Friedreich ataxia; autophagy; calcium metabolism; cellular senescence; frataxin; mitochondrial dysfunction.


Figures

FIGURE 1
FIGURE 1
Depletion of frataxin by siRNA. SH-SY5Y cells were transfected with the vector pLKO-FXN. Two SH-SY5Y stable clones exhibiting the most efficient silencing were selected, FXN-138.1 and FXN-138.2. (A) Cell lysates were analyzed by SDS-PAGE and immunoblotting for frataxin (bottom panel; upper and lower bands correspond to intermediate and mature forms of frataxin, respectively). Beta-tubulin was used as a loading control (top panel). (B) Bands corresponding to mature frataxin were quantified and final values are expressed as a percentage of the pLKO.1-NT value. Student’s t-test, FXN-138.1 p = 0.025, FXN-138.2 p=0.019 versus pLKO.1-NT. *p ≤ 0.05.
FIGURE 2
FIGURE 2
Increased cellular senescence response in FXN-deficient clones. (A) Growth curves of SH-SY5Y (wild-type), pLKO.1-NT, FXN-138.1, and FXN-138.2 cells. The cells were trypsinized and counted every 24 h for 13 successive days. Data are expressed as the mean of three experiments. (B) Western blot analysis of extracts from cells after 6 days of culture from untreated wild-type (WT) SH-SY5Y, pLKO.1-NT, FXN-138.1, and FXN-138.2 cells and WT SH-SY5Y cells exposed to radiation (apoptotic control), using cleaved caspase-3 antibody and cytochrome c antibody. Only the apoptotic control showed caspase-3 activation. All clones retained cytochrome c in the mitochondria, which is consistent with a non-apoptotic state, while the apoptotic control showed cytochrome c release into the cytosol. (C) A quantitative Western blot assay was developed to measure total cytochrome c in the mitochondria and cytosol. Data from cytosolic cytochrome c are expressed as percentage relative to apoptotic control, whereas data from mitochondrial cytochrome c are expressed as percentage relative to pLKO.1-NT control. (D) The clones indicated in the pictures were subjected to in situ SA-β-gal staining (blue) and examined by bright field microscopy. (E) The figure represents the expression level of the lysosomal enzyme β-galactosidase in all lines. The columns and bar show the mean and standard deviation of no fewer than 1300 cells from at least three experiments. Student’s t-test, FXN-138.1 p = 0.001, FXN-138.2 p = 0.02 versus pLKO.1-NT. *p ≤ 0.05; ***p ≤ 0.001.
FIGURE 3
FIGURE 3
Alterations in mitochondrial bioenergetics in frataxin-deficient cells. (A) ATP synthesis was measured in all the clones and was reduced in frataxin-deficient cells. Error bars indicate the standard deviation (SD) of at least three independent assays. Student’s t-test, FXN-138.1 p = 0.034, FXN-138.2 p = 0.003 versus pLKO.1-NT. (B) Oxygen consumption was assessed using a Clark-type oxygen electrode. Oxygen consumption was lower in clones deficient in frataxin. Student’s t-test, FXN-138.1 p = 0.035, FXN-138.2 p = 0.00004 versus pLKO.1-NT. (C) Western blot analysis of Complex IV of mitochondrial extracts from all the cells confirmed less COX1 and COX2 protein in frataxin-deficient clones, which correlated with results of Complex IV activity. Results are representative of at least three experiments with similar results. (D) Quantification of mitochondrial membrane potential in SH-SY5Y clones analyzed by FACS. Shown in this figure is the ratio of green/red fluorescence for the different clones. We observed depolarization of membrane potential in FXN-deficient clones. Student’s t-test, FXN-138.1 p = 0.001, FXN-138.2 p = 0.050 versus pLKO.1-NT. The columns and bar show the mean and SD of at least three experiments. *p ≤ 0.05; **p ≤ 0.01; ***p ≤ 0.001.
FIGURE 4
FIGURE 4
Enzymatic activity analysis of the ETC in SH-SY5Y clones. Wild-type SH-SY5Y, pLKO.1-NT, FXN-138.1, and FXN-138.2 cells were grown for 1 month. Mitochondria were isolated and used to determine the enzymatic activity of Complex I, II, III, IV, I+II, and I+III of the respiratory chain. Error bars indicate the standard deviation of at least three independent measurements (Student’s t-test, FXN-138.1 p = 0.0063, FXN-138.2 p = 0.002 versus pLKO.1-NT. **p ≤ 0.01).
FIGURE 5
FIGURE 5
Detection of protein oxidation and superoxide abundance. (A) Detection of superoxide in live cells of SH-SY5Y clones using MitoSoxTM Red superoxide indicator. Representative images of MitoSOX stained cells fromSH-SY5Y, pLKO.1-NT, FXN-138.1, and FXN-138.2. pLKO.1-NT was treated with or without H2O2. (B) Quantitative analysis of MitoSOX red fluorescence intensity. Fluorescence level is presented relative to cell area in every clone. Student’s t-test, FXN-138.1 p = 1.8 × 10⁻⁷, FXN-138.2 p = 6 × 10-14 versus pLKO.1-NT. (C) OxyblotTM assay on wild-type SH-SY5Y, pLKO.1-NT, FXN-138.1, and FXN-138.2 cells. Carbonylated proteins were quantified for each lane using Fujifilm’s Multi-Gauge Software. To allow for loading variation, values were normalized to the actin control. Final values are expressed as a percentage of pLKO.1-NT value and shown below each lane. It can be seen that FXN-138.1 and FXN-138.2 cells showed a marked increase in carbonylated proteins, demonstrating direct evidence of cellular oxidative stress. ***p ≤ 0.001.
FIGURE 6
FIGURE 6
Analysis of antioxidant enzymes. Western blots analyses of antioxidant enzymes were carried out. Once normalized the intensities, the protein levels of antioxidant enzymes are expressed as percentages versus control pLKO.1-NT: (A) catalase, (B) MnSOD, and (C) CuZnSOD. The columns and bar represent the mean and standard deviation of at least three experiments.
FIGURE 7
FIGURE 7
Quantification of mitochondrial dynamic process in SH-SY5Y clones. (A) Representative mitochondrial network shows increased fusion morphology in frataxin-deficient cells. (B) Quantification of four different mitochondrial architectures within the cell: tubular, mixed (tubular and vesicular), vesicular, and fragmented. (C) Average number of mitochondria per cell in all the clones. Error bars indicate the standard deviation. Student’s t-test, FXN-138.1 p = 0.00006, FXN-138.2 p = 0.00004 versus pLKO.1-NT. (D) Mitochondrial length distribution in all the clones. We observed fewer mitochondria but higher mitochondrial length in frataxin-deficient cells than in control. Electron microscopy images of pLKO.1-NT control (E) and clone FXN-138.1 (F,G) show normal and long tubular mitochondria, respectively (*). Clone FXN-138.1 (G) apparently shows increased mitochondrial fusion morphology. Frataxin-deficient cells appeared to have higher lysosomal content (black arrow), with residual bodies (boxed) and vacuoles (white arrow). ***p ≤ 0.001.
FIGURE 8
FIGURE 8
Effects of frataxin deficiency on the autophagy process. (A) Western blotting using anti-microtubule chain 3 (LC3) antibody. We detected LC3-I conversion and LC3-II turnover. The figure shows an increase level of LC3-II in FXN-deficient cells. Results are representative of five experiments. Proteins were quantified for each lane using Fujifilm’s Multi-Gauge Software. To allow for loading variation, values were normalized to the actin control. (C) Cells were transfected with EGFP-LC3 and, after culturing for an additional 24 h in complete medium, were examined by confocal fluorescence microscopy. Frataxin depletion increased GFP-LC3 puncta in SH-SY5Y cells, while puncta were not found in GFP control cells. (B) The percentage of cells showing GFP-LC3 aggregates was quantified. Data are means ± standard deviations from three independent experiments. At least 300 cells were analyzed for each. Student’s t-test, FXN-138.1 p = 0.021, FXN-138.2 p = 0.043 versus pLKO.1-NT. (D) The autophagyc response was assessed by culturing cells in different conditions: with 0.1 μM bafilomycin A1, in the absence of serum, with 100 nM insulin, or with 1 μM PMA. LC3-II quantification showed no alteration of autophagyc flux in any clone when compared versus itself in the basal condition. (E) FXN-deficient cells presented elevated levels of the autophagy marker in every condition with respect to control cells (pLKO.1-NT). Baseline condition (Basal), plus bafilomycin (+BAF), without fetal bovine serum (-FBS), plus insulin (+INS), plus phorbol 12-myristate 13-acetate (+PMA). Student’s t-test was applied for statistics. Both FXN-138.1 (p = 0.003) and FXN-138.2 (p = 0.002) shown statistical differences in basal condition versus pLKO.1-NT. After FBS starvation only the FXN-138.1 clone (p = 0.013) shown statistical differences. *p ≤ 0.05; **p ≤ 0.01.
FIGURE 9
FIGURE 9
FXN depletion results in increased endoplasmic reticulum (ER) stress. (A) Western blot analysis of ER stress marker BIP in control and FXN-deficient cells in three independent samples. (B) Normalized intensities expressed as a percentage of the BIP intensity shown in (A). Actin was used as a loading control. The columns and bar show the mean and standard deviation. Student’s t-test, FXN-138.1 p = 0.008, FXN-138.2 p = 0.023 versus pLKO.1-NT. (C) Quantification of apoptotic cells by flow cytometry. Untreated cells (white bars) and cells treated with thapsigargin (TG, black) were fixed and stained with propidium iodine. The subG1 population was quantified at least in three independent experiments. Bars show mean ± standard deviation. Student’s t-test was applied for statistics. Every cell types were compared between basal condition and with TG: SH-SY5Y p = 0.16, pLKO.1-NT p = 0.042, FXN-138.1 p = 0.032, FXN-138.2 p = 0.001. Comparison after TG treatment between pLKO.1-NT and FXN-138.1 p = 0.050, and FXN-138.2 p = 0.00004. The activation of caspase-3 was tested by western blot (lower panel) using specific antibody in resting conditions (-) and TG-treated cells (+). *p ≤ 0.05; **p ≤ 0.01; ***p ≤ 0.001.
FIGURE 10
FIGURE 10
Calcium homeostasis in frataxin-depleted SH-SY5Y cells. (A) Changes in fura-2 [Ca2+]cyt fluorescence intensity after addition of 25 μM veratridine. The recovery slopes for each clone after calcium entry (right, lower panel) show the difference in behavior for calcium buffering between control and frataxin-depleted clones. Traces represent means of no fewer than 100 cells from at least five experiments. (B) Changes in fura-2 [Ca2+]cyt fluorescence intensity after addition of 100 μM tBuBHQ in Ca2+-free medium. The recovery slopes for each clone after emptying of calcium from the endoplasmic reticulum (right, lower panel) show the different behavior for calcium buffering between control and frataxin-depleted clones. The activation of SOCE with the addition of 2 mM Ca2+ to cells treated with 100 μM tBuBHQ in Ca2+-free medium is altered in frataxin-depleted cells (right, upper panel) as the activation of the process is lower than in the control cells. Traces represent means of no fewer than 100 cells from at least three experiments. (C) Changes in Calcium Green-5N fluorescence in digitonin-permeabilized cells after the addition of pulses of 4 nmol of Ca2+. Traces represent means of at least four experiments for each clone. The Ca2+ uptake velocity [(D); Student’s t-test, FXN-138.1 p = 0.0004, FXN-138.2 p = 0.0004 versus pLKO.1-NT] and capacity [(E) ;Student’s t-test, FXN-138.1 p = 0.0002, FXN-138.2 p = 0.0002 versus pLKO.1-NT] rates were calculated from the uptake slopes in (C). ***p ≤ 0.001.

References

    1. Adamec J., Rusnak F., Owen W. G., Naylor S., Benson L. M., Gacy A. M., et al. (2000). Iron-dependent self-assembly of recombinant yeast frataxin: implications for Friedreich ataxia. Am. J. Hum. Genet. 67 549–562 10.1086/303056 - DOI - PMC - PubMed
    1. Al-Mahdawi S., Pinto R. M., Varshney D., Lawrence L., Lowrie M. B., Hughes S., et al. (2006). GAA repeat expansion mutation mouse models of Friedreich ataxia exhibit oxidative stress leading to progressive neuronal and cardiac pathology. Genomics 88 580–590 10.1016/j.ygeno.2006.06.015 - DOI - PMC - PubMed
    1. Babcock M., De Silva D., Oaks R., Davis-Kaplan S., Jiralerspong S., Montermini L., et al. (1997). Regulation of mitochondrial iron accumulation by Yfh1p, a putative homolog of frataxin. Science 276 1709–1712 10.1126/science.276.5319.1709 - DOI - PubMed
    1. Bradley J. L., Blake J. C., Chamberlain S., Thomas P. K., Cooper J. M., Schapira A. H. (2000). Clinical, biochemical and molecular genetic correlations in Friedreich’s ataxia. Hum. Mol. Genet. 9 275–282 10.1093/hmg/9.2.275 - DOI - PubMed
    1. Cali T., Ottolini D., Brini M. (2012). Mitochondrial Ca(2+) and neurodegeneration. Cell Calcium 52 73–85 10.1016/j.ceca.2012.04.015 - DOI - PMC - PubMed