

The evolutionary neuroscience of musical beat perception: the Action Simulation for Auditory Prediction (ASAP) hypothesis
- PMID: 24860439
- PMCID: PMC4026735
- DOI: 10.3389/fnsys.2014.00057
The evolutionary neuroscience of musical beat perception: the Action Simulation for Auditory Prediction (ASAP) hypothesis
Abstract
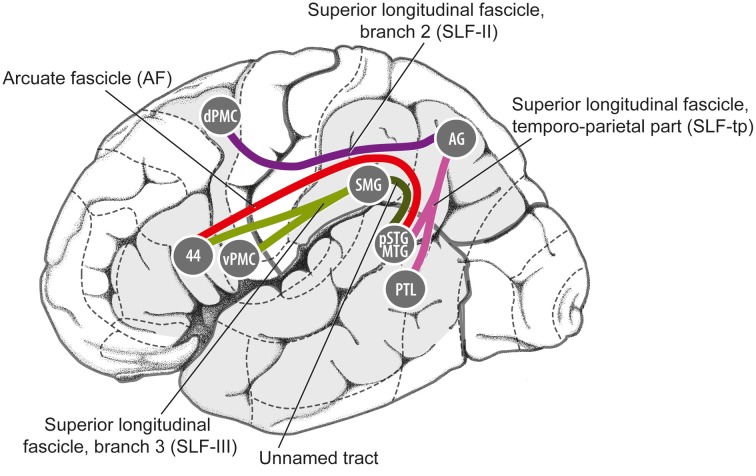
a perceived periodic pulse that structures the perception of musical rhythm and which serves as a framework for synchronized movement to music. What are the neural mechanisms of musical beat perception, and how did they evolve? One view, which dates back to Darwin and implicitly informs some current models of beat perception, is that the relevant neural mechanisms are relatively general and are widespread among animal species. On the basis of recent neural and cross-species data on musical beat processing, this paper argues for a different view. Here we argue that beat perception is a complex brain function involving temporally-precise communication between auditory regions and motor planning regions of the cortex (even in the absence of overt movement). More specifically, we propose that simulation of periodic movement in motor planning regions provides a neural signal that helps the auditory system predict the timing of upcoming beats. This "action simulation for auditory prediction" (ASAP) hypothesis leads to testable predictions. We further suggest that ASAP relies on dorsal auditory pathway connections between auditory regions and motor planning regions via the parietal cortex, and suggest that these connections may be stronger in humans than in non-human primates due to the evolution of vocal learning in our lineage. This suggestion motivates cross-species research to determine which species are capable of human-like beat perception, i.e., beat perception that involves accurate temporal prediction of beat times across a fairly broad range of tempi.
Keywords: brain; comparative psychology; evolution; music cognition; rhythm perception.
Figures
Similar articles
-
The Role of Posterior Parietal Cortex in Beat-based Timing Perception: A Continuous Theta Burst Stimulation Study.J Cogn Neurosci. 2018 May;30(5):634-643. doi: 10.1162/jocn_a_01237. Epub 2018 Jan 18. J Cogn Neurosci. 2018. PMID: 29346017
-
Motor and Predictive Processes in Auditory Beat and Rhythm Perception.Front Hum Neurosci. 2020 Sep 11;14:578546. doi: 10.3389/fnhum.2020.578546. eCollection 2020. Front Hum Neurosci. 2020. PMID: 33061902 Free PMC article. Review.
-
Vocal learning as a preadaptation for the evolution of human beat perception and synchronization.Philos Trans R Soc Lond B Biol Sci. 2021 Oct 11;376(1835):20200326. doi: 10.1098/rstb.2020.0326. Epub 2021 Aug 23. Philos Trans R Soc Lond B Biol Sci. 2021. PMID: 34420384 Free PMC article.
-
Beat-based dancing to music has evolutionary foundations in advanced vocal learning.BMC Neurosci. 2024 Nov 6;25(1):65. doi: 10.1186/s12868-024-00843-6. BMC Neurosci. 2024. PMID: 39506663 Free PMC article. Review.
-
Experimental evidence for synchronization to a musical beat in a nonhuman animal.Curr Biol. 2009 May 26;19(10):827-30. doi: 10.1016/j.cub.2009.03.038. Epub 2009 Apr 30. Curr Biol. 2009. PMID: 19409790
Cited by
-
Resonance and beat perception of ballroom dancers: An EEG study.PLoS One. 2024 Oct 21;19(10):e0312302. doi: 10.1371/journal.pone.0312302. eCollection 2024. PLoS One. 2024. PMID: 39432504 Free PMC article.
-
Entrained neuronal activity to periodic visual stimuli in the primate striatum compared with the cerebellum.Elife. 2019 Sep 6;8:e48702. doi: 10.7554/eLife.48702. Elife. 2019. PMID: 31490120 Free PMC article.
-
Trajectory formation during sensorimotor synchronization and syncopation to auditory and visual metronomes.Exp Brain Res. 2018 Nov;236(11):2847-2856. doi: 10.1007/s00221-018-5343-y. Epub 2018 Jul 26. Exp Brain Res. 2018. PMID: 30051262
-
Intrinsic Rhythmicity Predicts Synchronization-Continuation Entrainment Performance.Sci Rep. 2018 Aug 6;8(1):11782. doi: 10.1038/s41598-018-29267-z. Sci Rep. 2018. PMID: 30082734 Free PMC article. Clinical Trial.
-
Auditory cortical representation of music favours the perceived beat.R Soc Open Sci. 2020 Mar 25;7(3):191194. doi: 10.1098/rsos.191194. eCollection 2020 Mar. R Soc Open Sci. 2020. PMID: 32269783 Free PMC article.
References
-
- Brown S., Jordania J. (2013). Universals in the world's musics. Psychol. Music 41, 229–248 10.1177/0305735611425896 - DOI
LinkOut - more resources
Full Text Sources
Other Literature Sources