

The compensatory dynamic of inter-hemispheric interactions in visuospatial attention revealed using rTMS and fMRI
- PMID: 24860462
- PMCID: PMC4029023
- DOI: 10.3389/fnhum.2014.00226
The compensatory dynamic of inter-hemispheric interactions in visuospatial attention revealed using rTMS and fMRI
Abstract
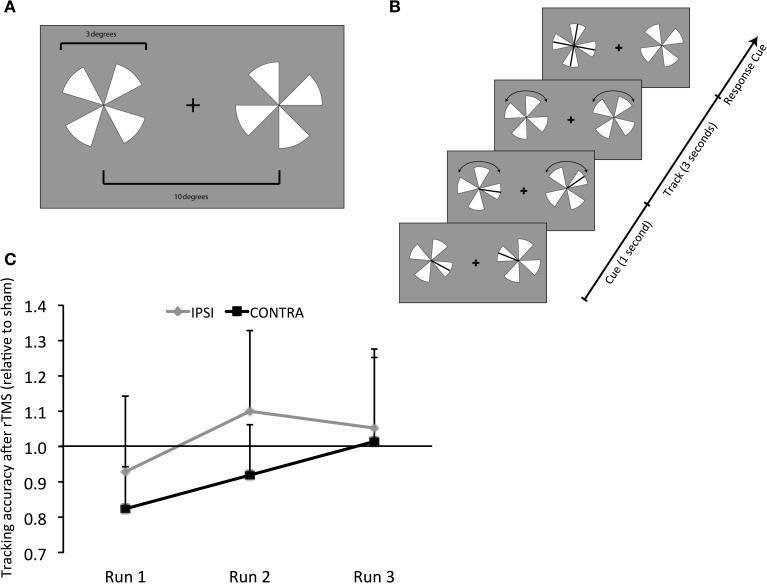
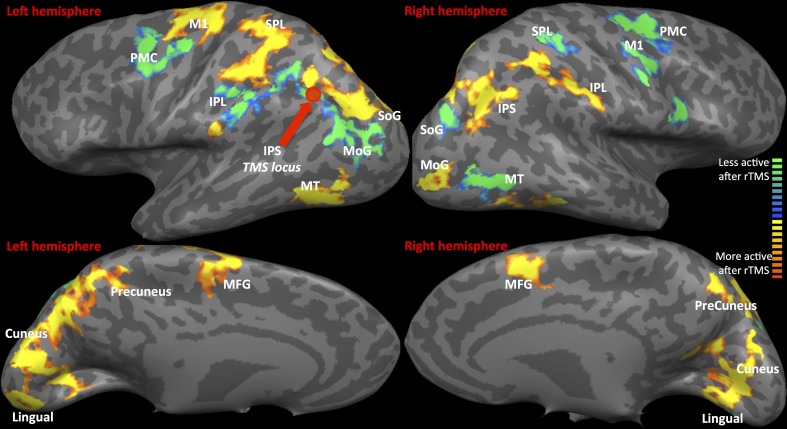
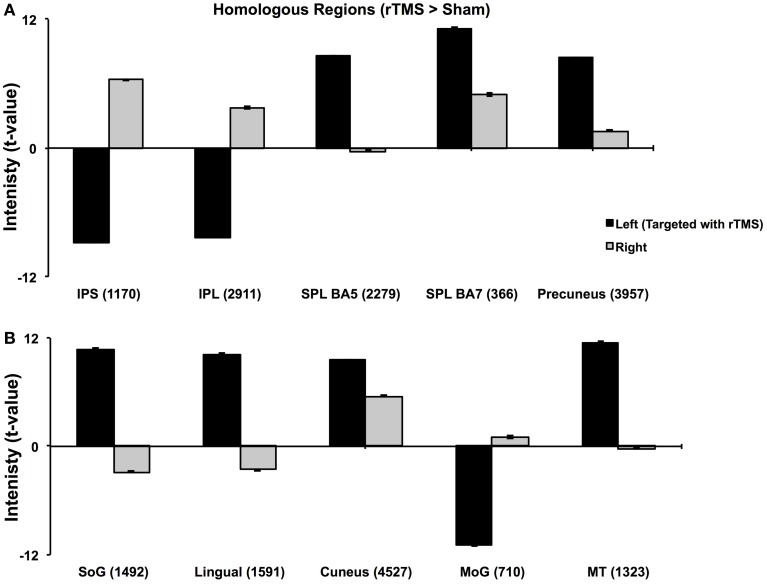
A balance of mutual tonic inhibition between bi-hemispheric posterior parietal cortices is believed to play an important role in bilateral visual attention. However, experimental support for this notion has been mainly drawn from clinical models of unilateral damage. We have previously shown that low-frequency repetitive TMS (rTMS) over the intraparietal sulcus (IPS) generates a contralateral attentional deficit in bilateral visual tracking. Here, we used functional magnetic resonance imaging (fMRI) to study whether rTMS temporarily disrupts the inter-hemispheric balance between bilateral IPS in visual attention. Following application of 1 Hz rTMS over the left IPS, subjects performed a bilateral visual tracking task while their brain activity was recorded using fMRI. Behaviorally, tracking accuracy was reduced immediately following rTMS. Areas ventro-lateral to left IPS, including inferior parietal lobule (IPL), lateral IPS (LIPS), and middle occipital gyrus (MoG), showed decreased activity following rTMS, while dorsomedial areas, such as Superior Parietal Lobule (SPL), Superior occipital gyrus (SoG), and lingual gyrus, as well as middle temporal areas (MT+), showed higher activity. The brain activity of the homologues of these regions in the un-stimulated, right hemisphere was reversed. Interestingly, the evolution of network-wide activation related to attentional behavior following rTMS showed that activation of most occipital synergists adaptively compensated for contralateral and ipsilateral decrement after rTMS, while activation of parietal synergists, and SoG remained competing. This pattern of ipsilateral and contralateral activations empirically supports the hypothesized loss of inter-hemispheric balance that underlies clinical manifestation of visual attentional extinction.
Keywords: TMS; fMRI; inter-hemispheric interaction; visual extinction; visuospatial attention.
Figures
Similar articles
-
Local Immediate versus Long-Range Delayed Changes in Functional Connectivity Following rTMS on the Visual Attention Network.Brain Stimul. 2017 Mar-Apr;10(2):263-269. doi: 10.1016/j.brs.2016.10.009. Epub 2016 Oct 19. Brain Stimul. 2017. PMID: 27838275 Free PMC article.
-
Contralesional rTMS relieves visual extinction in chronic stroke.Neuropsychologia. 2014 Sep;62:269-76. doi: 10.1016/j.neuropsychologia.2014.07.026. Epub 2014 Aug 1. Neuropsychologia. 2014. PMID: 25090926
-
The Neuroanatomical Basis for Posterior Superior Parietal Lobule Control Lateralization of Visuospatial Attention.Front Neuroanat. 2016 Mar 24;10:32. doi: 10.3389/fnana.2016.00032. eCollection 2016. Front Neuroanat. 2016. PMID: 27047351 Free PMC article.
-
Disrupted hemispheric connectivity specialization in patients with major depressive disorder: Evidence from the REST-meta-MDD Project.J Affect Disord. 2021 Apr 1;284:217-228. doi: 10.1016/j.jad.2021.02.030. Epub 2021 Feb 12. J Affect Disord. 2021. PMID: 33609956
-
Neural activity during attentional conflict predicts reduction in tinnitus perception following rTMS.Brain Stimul. 2017 Sep-Oct;10(5):934-943. doi: 10.1016/j.brs.2017.05.009. Epub 2017 Jun 2. Brain Stimul. 2017. PMID: 28629874 Free PMC article. Clinical Trial.
Cited by
-
Local Immediate versus Long-Range Delayed Changes in Functional Connectivity Following rTMS on the Visual Attention Network.Brain Stimul. 2017 Mar-Apr;10(2):263-269. doi: 10.1016/j.brs.2016.10.009. Epub 2016 Oct 19. Brain Stimul. 2017. PMID: 27838275 Free PMC article.
-
Attention network modulation via tRNS correlates with attention gain.Elife. 2021 Nov 26;10:e63782. doi: 10.7554/eLife.63782. Elife. 2021. PMID: 34826292 Free PMC article.
-
Long-latency interhemispheric interactions between motor-related areas and the primary motor cortex: a dual site TMS study.Sci Rep. 2017 Nov 2;7(1):14936. doi: 10.1038/s41598-017-13708-2. Sci Rep. 2017. PMID: 29097700 Free PMC article.
-
Excitatory TMS modulates memory representations.Cogn Neurosci. 2018 Jul-Oct;9(3-4):151-166. doi: 10.1080/17588928.2018.1512482. Epub 2018 Sep 5. Cogn Neurosci. 2018. PMID: 30124357 Free PMC article.
-
Individual differences in local functional brain connectivity affect TMS effects on behavior.Sci Rep. 2020 Jun 26;10(1):10422. doi: 10.1038/s41598-020-67162-8. Sci Rep. 2020. PMID: 32591568 Free PMC article.
References
Grants and funding
LinkOut - more resources
Full Text Sources
Other Literature Sources