. 2013 Jul 18;3(3):575-591.
doi: 10.3390/metabo3030575. eCollection 2013 Sep.

Combining Hydrophilic Interaction Chromatography (HILIC) and Isotope Tagging for Off-Line LC-NMR Applications in Metabolite Analysis

Affiliations

Combining Hydrophilic Interaction Chromatography (HILIC) and Isotope Tagging for Off-Line LC-NMR Applications in Metabolite Analysis

Emmanuel Appiah-Amponsah et al. Metabolites. .

Abstract

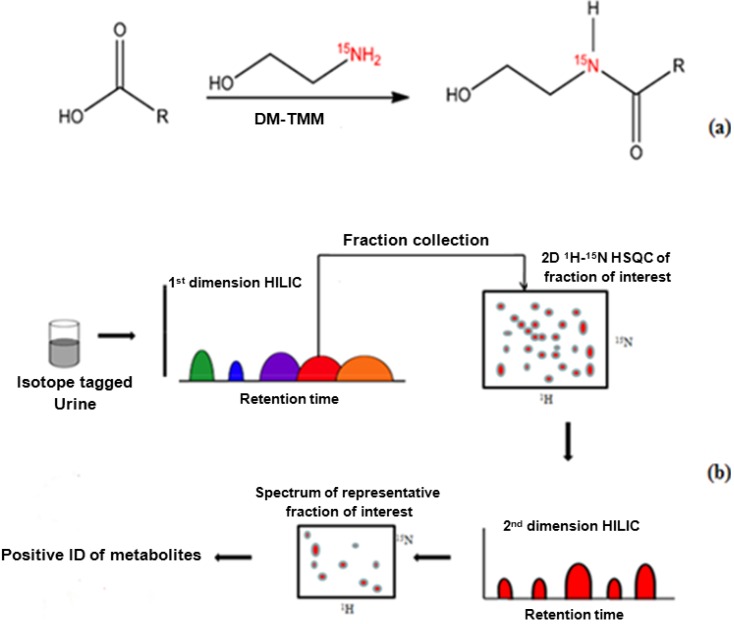
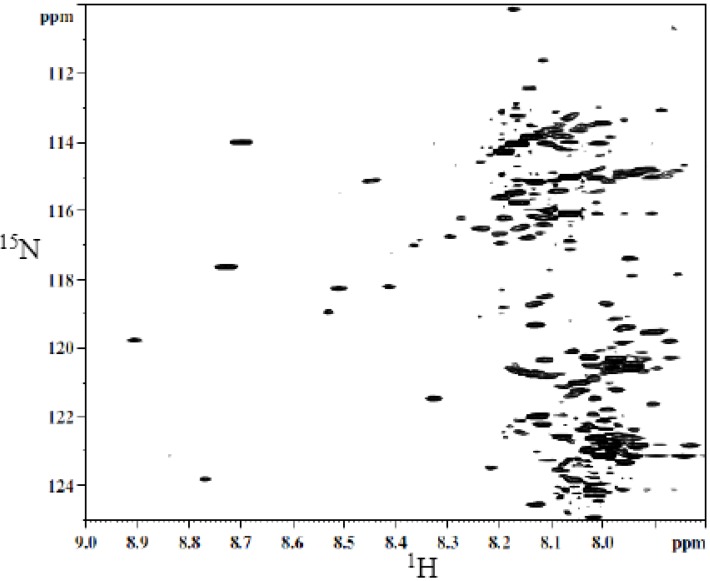
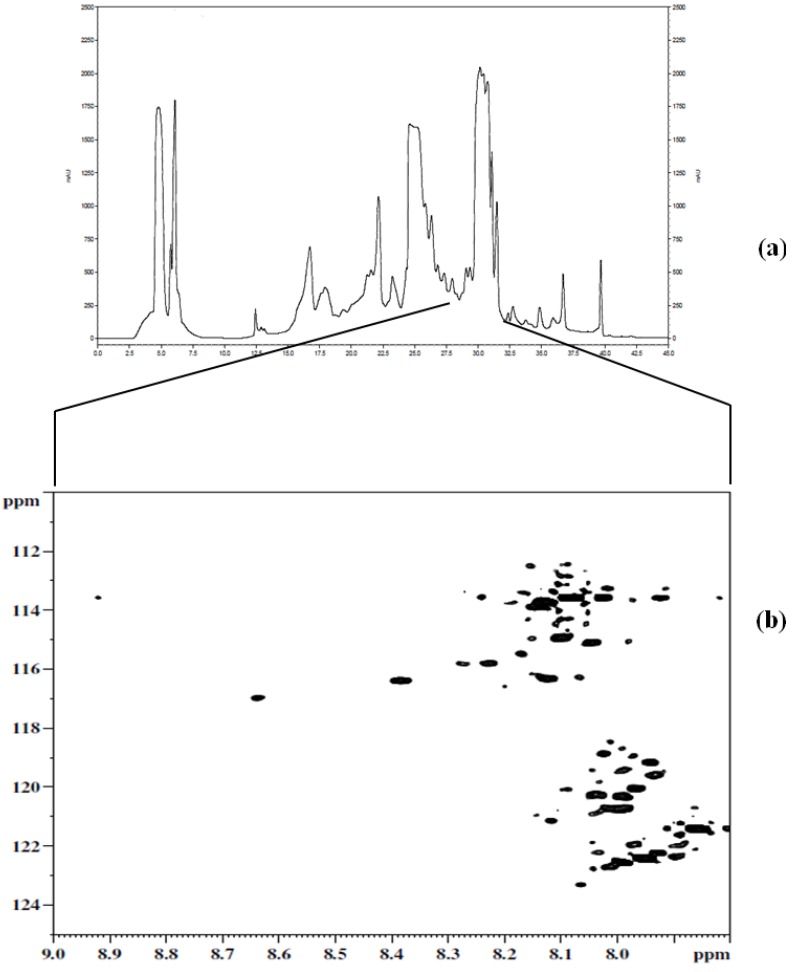
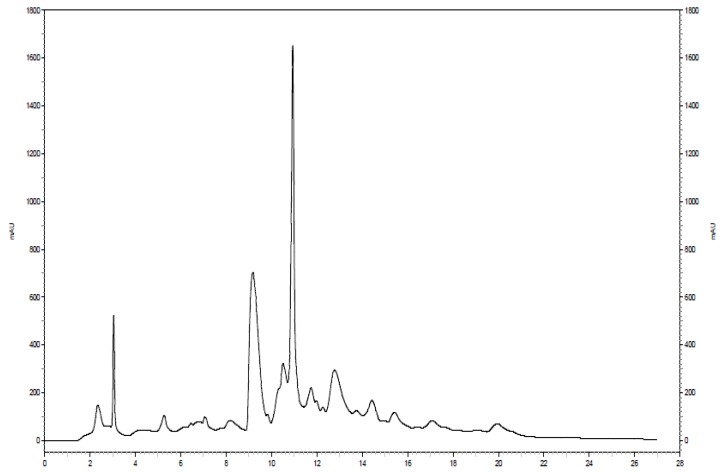
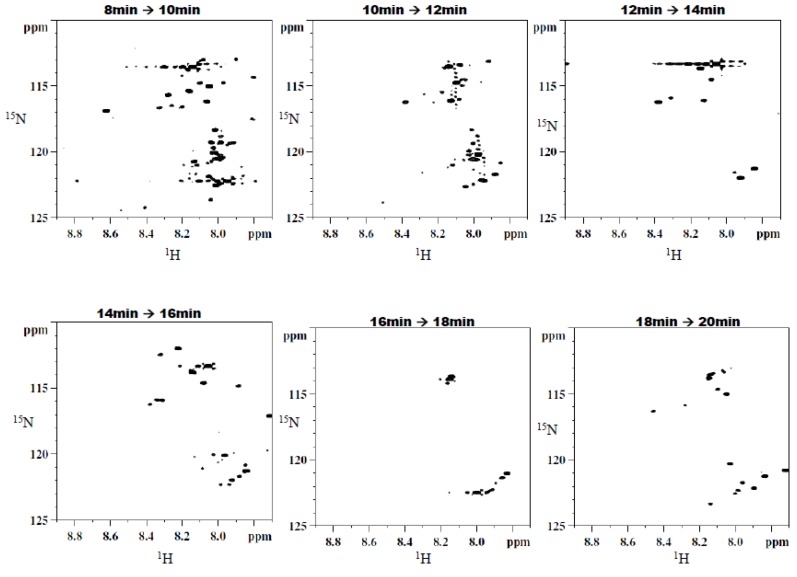
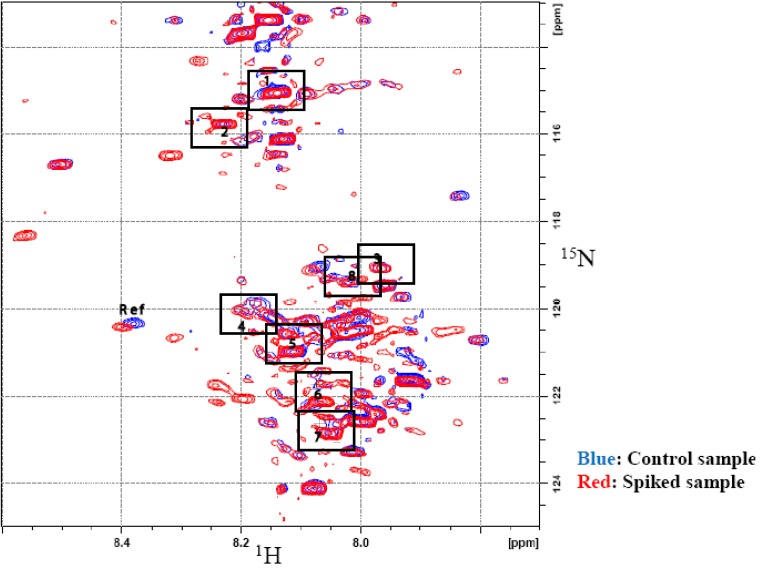
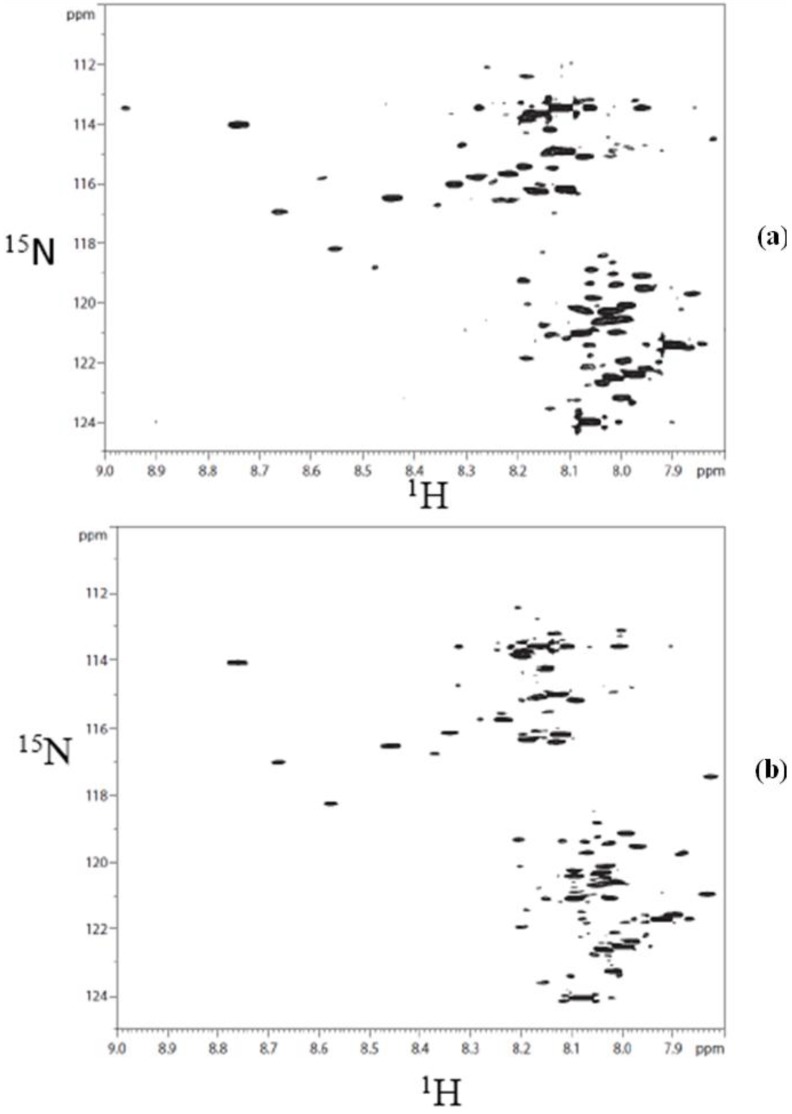
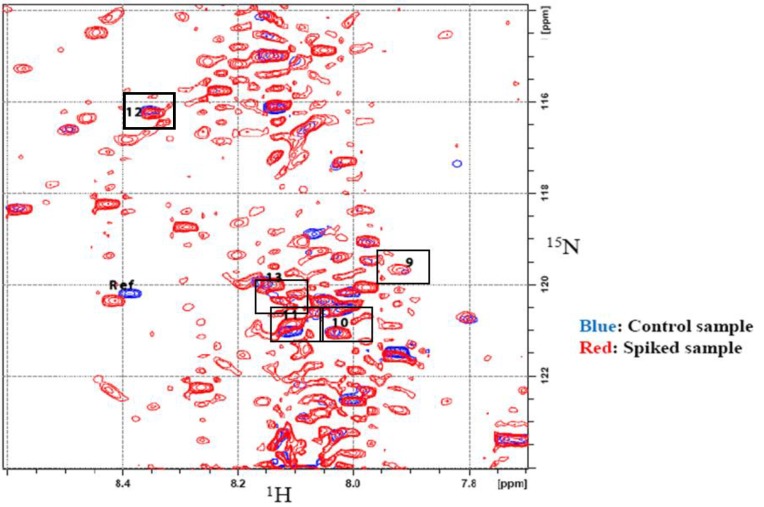
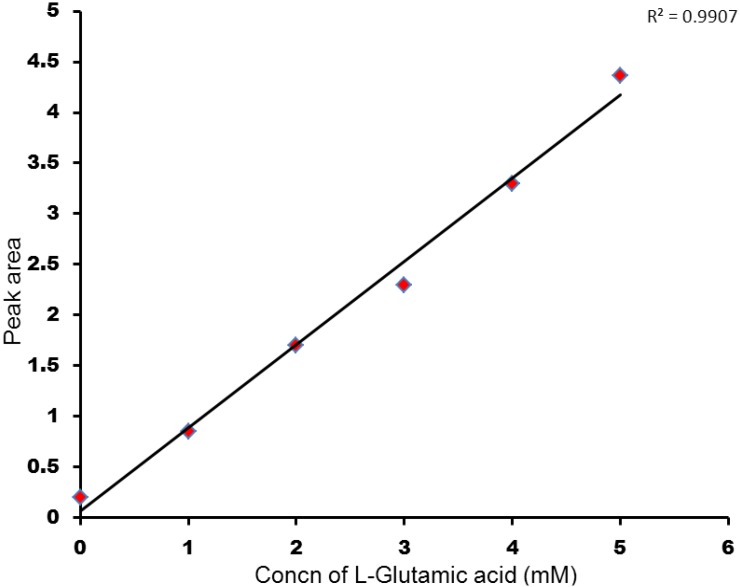
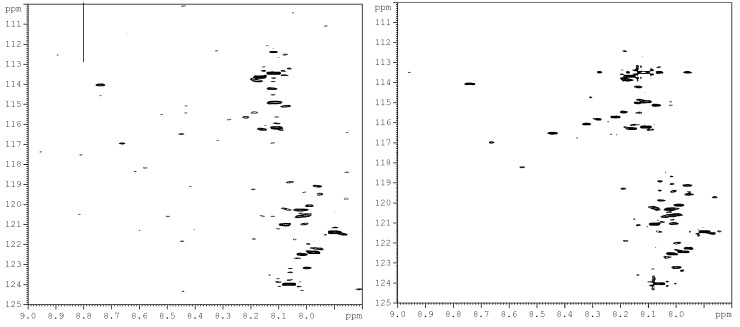
The complementary use of liquid chromatography (LC) and nuclear magnetic resonance (NMR) has shown high utility in a variety of fields. While the significant benefit of spectral simplification can be achieved for the analysis of complex samples, other limitations remain. For example, (1)H LC-NMR suffers from pH dependent chemical shift variations, especially during urine analysis, owing to the high physiological variation of urine pH. Additionally, large solvent signals from the mobile phase in LC can obscure lower intensity signals and severely limit the number of metabolites detected. These limitations, along with sample dilution, hinder the ability to make reliable chemical shift assignments. Recently, stable isotopic labeling has been used to detect quantitatively specific classes of metabolites of interest in biofluids. Here we present a strategy that explores the combined use of two-dimensional hydrophilic interaction chromatography (HILIC) and isotope tagged NMR for the unambiguous identification of carboxyl containing metabolites present in human urine. The ability to separate structurally related compounds chromatographically, in off-line mode, followed by detection using (1)H-(15)N 2D HSQC (two-dimensional heteronuclear single quantum coherence) spectroscopy, resulted in the assignment of low concentration carboxyl-containing metabolites from a library of isotope labeled compounds. The quantitative nature of this strategy is also demonstrated.

Keywords: 15N isotope tagging; HILIC; NMR; metabolite profiling; metabolomics; urine.


Figures

Figure 1
Figure 1
(a) 15N-ethanolamine derivatization procedure used for isotope tagging of urine metabolites [40]; (b) Schematic diagram of the experimental procedure for the two-dimensional LC-2D NMR method.
Figure 2
Figure 2
Typical 2D 1H-15N HSQC spectrum of human urine after isotope tagging using 15N-ethanolamine.
Figure 3
Figure 3
(a) Chromatogram of the first dimension separation of 15N-ethanolamine derivatized urine; (b) 2D 1H-15N HSQC spectrum of region of interest (i.e., 27 min to about 32 min) from the first dimension separation.
Figure 4
Figure 4
Chromatogram of the second dimension separation of a fraction of interest from the 15N-ethanolamine derivatized urine sample.
Figure 5
Figure 5
Typical 2D 1H-15N HSQC spectra of fractions resulting from the second dimension separation showing a significant simplification of the spectral data.
Figure 6
Figure 6
2D 1H-15N HSQC spectra of control urine (Blue) and urine spiked with several metabolites of interest (Red). Chemical shifts of the spiked compounds are indicated with boxes and are referenced to the metabolite information appearing in Table 1.
Figure S1
Figure S1
(a) 2D 1H-15N HSQC spectrum of derivatized urine collected after passing through TSK gel amide80 column; (b) 2D 1H-15N HSQC spectrum of urine taken directly after derivatization.
Figure S2
Figure S2
2D 1H-15N HSQC spectra of control urine (Blue) and urine spiked with several metabolites of interest (Red). Chemical shifts of the spiked compounds are indicated with boxes and are referenced to the metabolite information appearing in Table 1.
Figure S3
Figure S3
Calibration curve for varying concentrations of 15N isotope labeled L-glutamic acid spiked human urine.
Figure S4
Figure S4
Typical 2D 1H-15N HSQC spectra of the same fractions as shown in Figure 3b, collected for two isotope tagged urine samples in the first dimension separation. Very similar spectral peak patterns were observed for the same fractions with minor differences arising from the altered metabolic content between the samples.

References

    1. Nicholson J.K., Wilson I.D. High resolution proton magnetic resonance spectroscopy of biological fluids. Prog. NMR Spectrosc. 1989;21:449–501. doi: 10.1016/0079-6565(89)80008-1. - DOI
    1. Nicholson J.K., Lindon J.C., Holmes E. “Metabonomics”: understanding the metabolic responses of living systems to pathophysiological stimuli via multivariate statistical analysis of biological NMR spectroscopic data. Xenobiotica. 1999;29:1181–1189. doi: 10.1080/004982599238047. - DOI - PubMed
    1. Fiehn O., Kopka J., Dörmann P., Altmann T., Trethewey R.N., Willmitzer L. Metabolite profiling for plant functional genomics. Nat. Biotechnol. 2000;18:1157–1161. doi: 10.1038/81137. - DOI - PubMed
    1. De Graaf R.K., Behar K.L. Quantitative 1H NMR spectroscopy of blood plasma metabolites. Anal. Chem. 2003;75:2100–2104. doi: 10.1021/ac020782+. - DOI - PubMed
    1. Serkova N.J., Niemann C.U. Pattern recognition and biomarker validation using quantitative 1H-NMR-based metabolomics. Expert. Rev. Mol. Diagn. 2006;6:717–731. doi: 10.1586/14737159.6.5.717. - DOI - PubMed

LinkOut - more resources