. 2014 Aug;109(8):1338-52.
doi: 10.1111/add.12570. Epub 2014 May 27.

Spatial differences and temporal changes in illicit drug use in Europe quantified by wastewater analysis

Affiliations
Free PMC article

Spatial differences and temporal changes in illicit drug use in Europe quantified by wastewater analysis

Christoph Ort et al. Addiction. 2014 Aug.
Free PMC article

Abstract

Aims: To perform wastewater analyses to assess spatial differences and temporal changes of illicit drug use in a large European population.

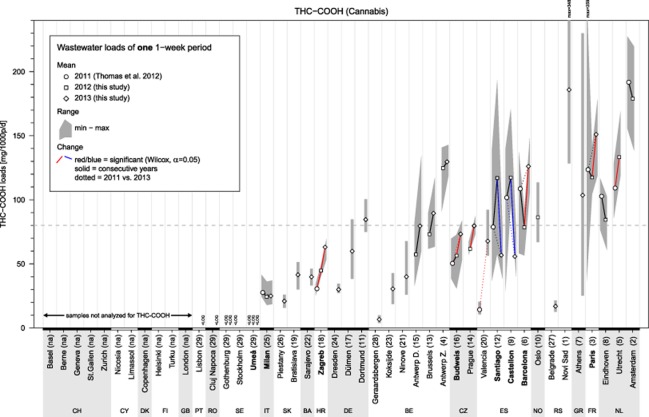
Design: Analyses of raw wastewater over a 1-week period in 2012 and 2013.

Setting and participants: Catchment areas of wastewater treatment plants (WWTPs) across Europe, as follows: 2012: 25 WWTPs in 11 countries (23 cities, total population 11.50 million); 2013: 47 WWTPs in 21 countries (42 cities, total population 24.74 million).

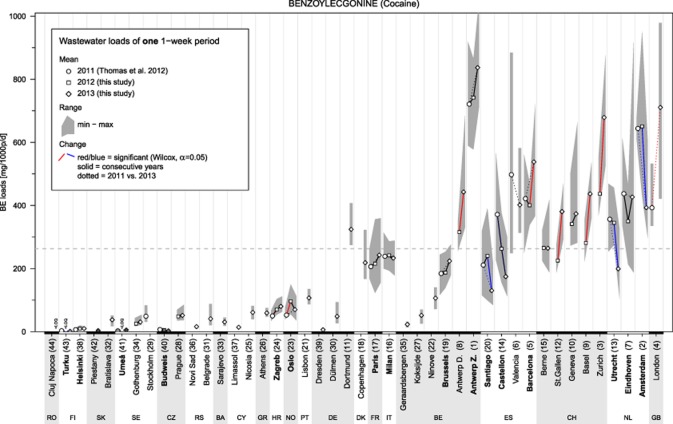
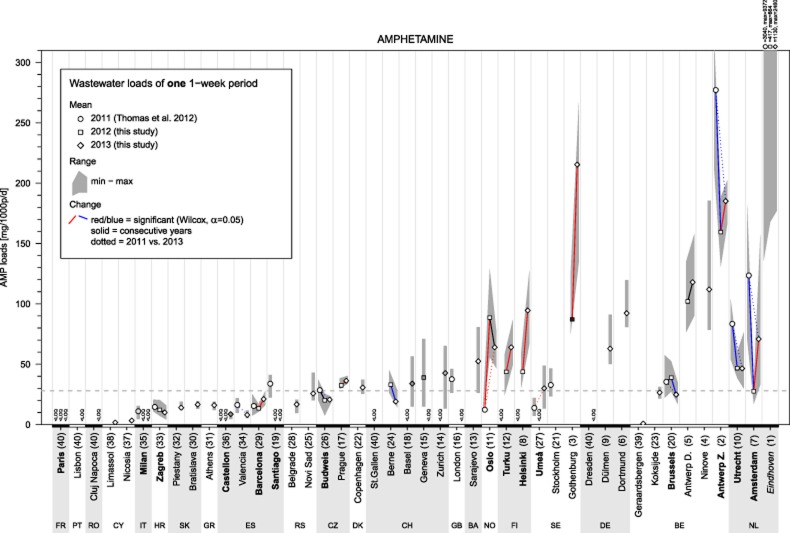
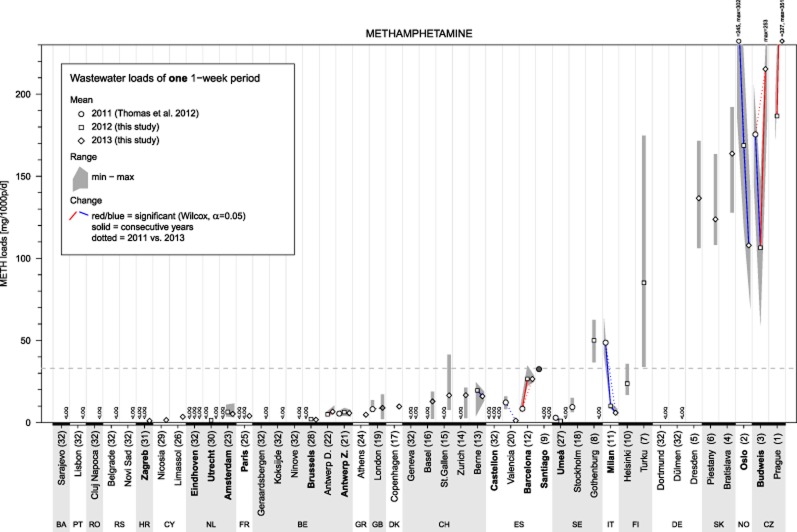
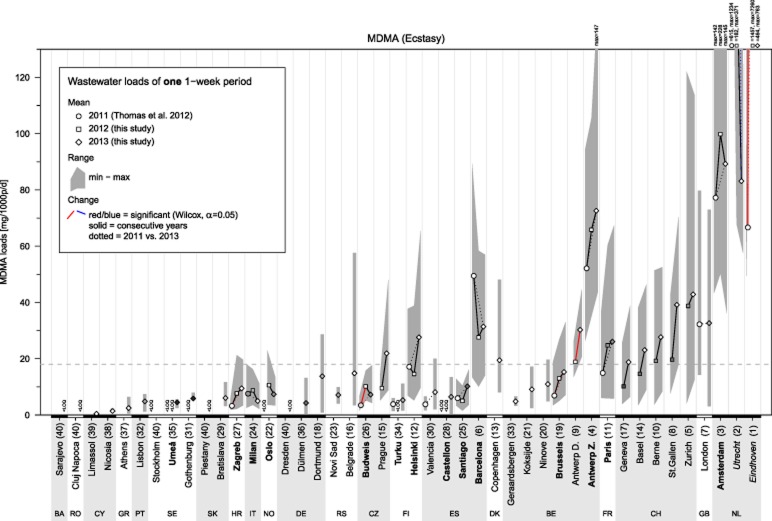
Measurements: Excretion products of five illicit drugs (cocaine, amphetamine, ecstasy, methamphetamine, cannabis) were quantified in wastewater samples using methods based on liquid chromatography coupled to mass spectrometry.

Findings: Spatial differences were assessed and confirmed to vary greatly across European metropolitan areas. In general, results were in agreement with traditional surveillance data, where available. While temporal changes were substantial in individual cities and years (P ranging from insignificant to <10(-3) ), overall means were relatively stable. The overall mean of methamphetamine was an exception (apparent decline in 2012), as it was influenced mainly by four cities.

Conclusions: Wastewater analysis performed across Europe provides complementary evidence on illicit drug consumption and generally concurs with traditional surveillance data. Wastewater analysis can measure total illicit drug use more quickly and regularly than is the current norm for national surveys, and creates estimates where such data does not exist.

Keywords: Amphetamine; cannabis; cocaine; drugs of abuse; ecstasy; methamphetamine; sewage.


Figures

Figure 1
Figure 1
Population-normalized benzoylecgonine (BE) loads of a single 1-week period per year. See Table 1 for more information. <LOQ: concentrations in all daily samples were below limit of quantification (LOQ). Grey dashed line: 2013 overall mean of all participating cities. Dot colour: white: concentrations in all samples were above LOQ; grey shading: one or more concentrations were below LOQ and set to 0.5*LOQ (the darker the grey, the more concentrations were below LOQ). Numbers in brackets: cities' rank (average over all available years). Cities in bold type participated in all 3 years and were used to calculate annual overall means (see Table 2). All P-values can be found in Supporting information, Appendix S3
Figure 2
Figure 2
Population-normalized amphetamine (AMP) loads of a single 1-week period per year. See Table 1 for more information. <LOQ: concentrations in all daily samples were below limit of quantification (LOQ). Grey dashed line: 2013 overall mean of all participating cities (except Eindhoven). Dot colour: white: concentrations in all samples were above LOQ; grey shading: one or more concentrations were below LOQ and set to 0.5*LOQ (the darker the grey, the more concentrations were below LOQ). Numbers in brackets: cities' rank (average over all available years). Cities in bold type participated in all 3 years and were used to calculate annual overall means (see Table 2). Cities in italic type exhibited abnormal high values in at least 1 year (see text for more details). All P-values can be found in Supporting information, Appendix S3
Figure 3
Figure 3
Population-normalized methamphetamine (METH) loads of a single 1-week period per year. See Table 1 for more information. <LOQ: concentrations in all daily samples were below limit of quantification (LOQ). Grey dashed line: 2013 overall mean of all participating cities. Dot colour: white: concentrations in all samples were above LOQ; grey shading: one or more concentrations were below LOQ and set to 0.5*LOQ (the darker the grey, the more concentrations were below LOQ). Numbers in brackets: cities' rank (average over all available years). Cities in bold type participated in all 3 years and were used to calculate annual overall means (see Table 2). All P-values can be found in Supporting information, Appendix S3
Figure 4
Figure 4
Population-normalized 3,4-methylenedioxy-methamphetamine (MDMA) loads of a single 1-week period per year. See Table 1 for more information. <LOQ: concentrations in all daily samples were below limit of quantification (LOQ). Grey dashed line: 2013 overall mean of all participating cities (except Utrecht and Eindhoven). Dot colour: white: concentrations in all samples were above LOQ; grey shading: one or more concentrations were below LOQ and set to 0.5*LOQ (the darker the grey, the more concentrations were below LOQ). Numbers in brackets: cities' rank (average over all available years). Cities in bold type participated in all 3 years and were used to calculate annual overall means (see Table 2). Cities in italic type exhibited abnormal high values in at least 1 year (see text for more details). All P-values can be found in Supporting information, Appendix S3
Figure 5
Figure 5
Population-normalized 11-nor-9-carboxy-delta9-tetrahydrocannabinol (THC-COOH) loads of a single 1-week period per year. See Table 1 for more information. <LOQ: concentrations in all daily samples were below limit of quantification (LOQ). Grey dashed line: 2013 overall mean of all participating cities. Dot colour: white: concentrations in all samples were above LOQ; Grey shading: one or more concentrations were below LOQ and set to 0.5*LOQ (the darker the grey, the more concentrations were below LOQ). Numbers in brackets: cities' rank (average over all available years). Cities in bold type participated in all 3 years and were used to calculate annual overall means (see Table 2). All P-values can be found in Supporting information, Appendix S3

References

    1. European Monitoring Centre for Drugs and Drug Addiction. 2008. Assessing Illicit Drugs in Sewage—Potential and Limitations of A New Monitoring Approach. Luxembourg: Office for Official Publications of the European Communities.
    1. Griffiths P, Mounteney J. Drug trend monitoring. In: Miller PG, Strang J, Miller PM, editors. Addiction Research Methods. Oxford, UK: Wiley-Blackwell; 2010. pp. 337–354.
    1. Zuccato E, Chiabrando C, Castiglioni S, Bagnati R, Fanelli R. Estimating community drug abuse by wastewater analysis. Environ Health Perspect. 2008;116:1027–1032. - PMC - PubMed
    1. van Nuijs ALN, Castiglioni S, Tarcomnicu I, Postigo C, de Alda ML, Neels H, et al. Illicit drug consumption estimations derived from wastewater analysis: a critical review. Sci Total Environ. 2011;409:3564–3577. - PubMed
    1. United Nations Office on Drugs and Crime (UNODC) 2013. The challenge of new psychoactive substances. UNODC, Vienna.

Publication types

MeSH terms