

Methotrexate inhibits the viability of human melanoma cell lines and enhances Fas/Fas-ligand expression, apoptosis and response to interferon-alpha: rationale for its use in combination therapy
- PMID: 24862567
- PMCID: PMC4319533
- DOI: 10.1016/j.abb.2014.04.019
Methotrexate inhibits the viability of human melanoma cell lines and enhances Fas/Fas-ligand expression, apoptosis and response to interferon-alpha: rationale for its use in combination therapy
Abstract
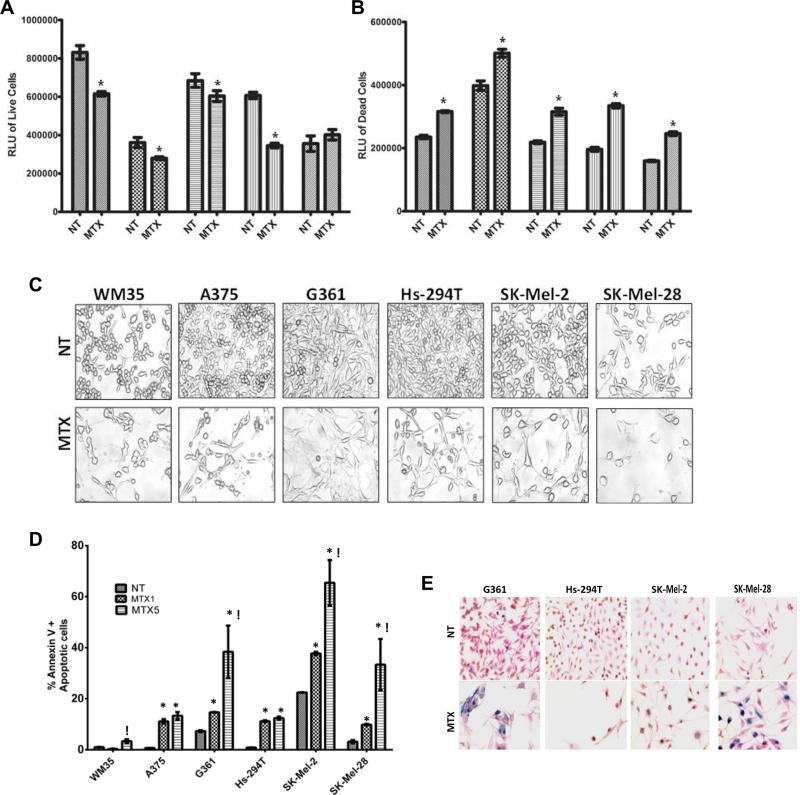
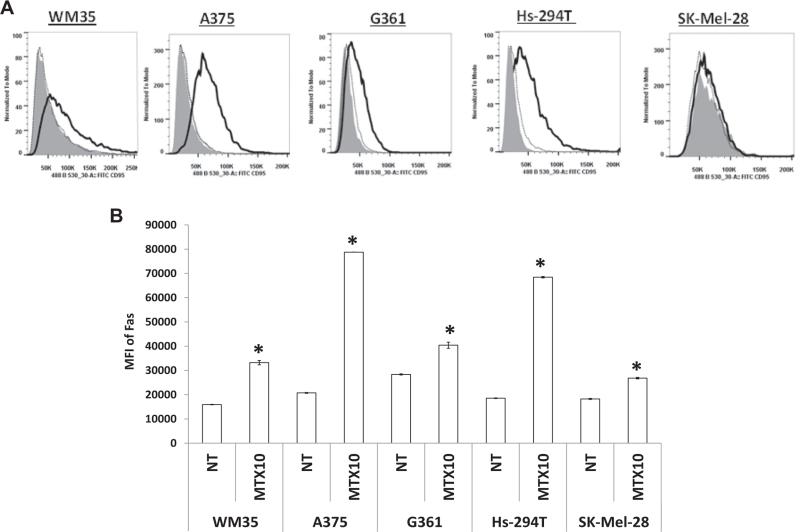
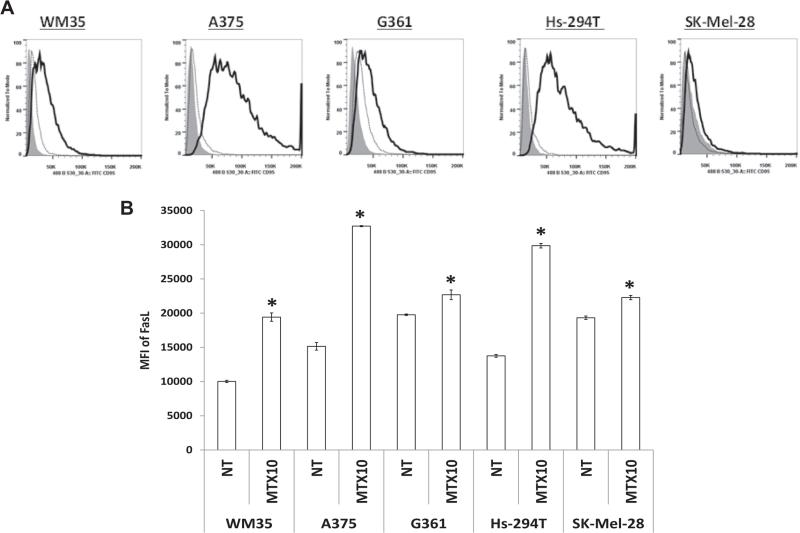
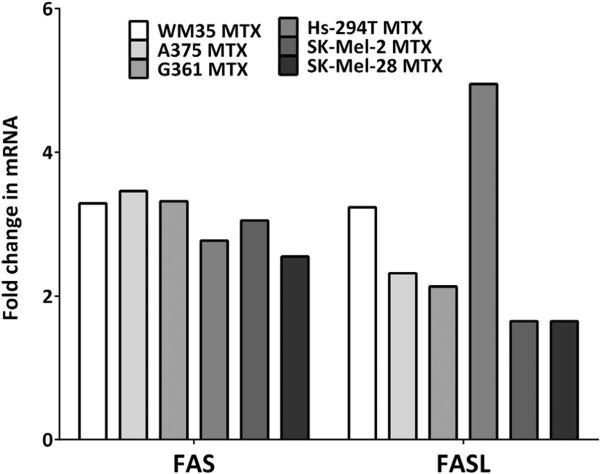
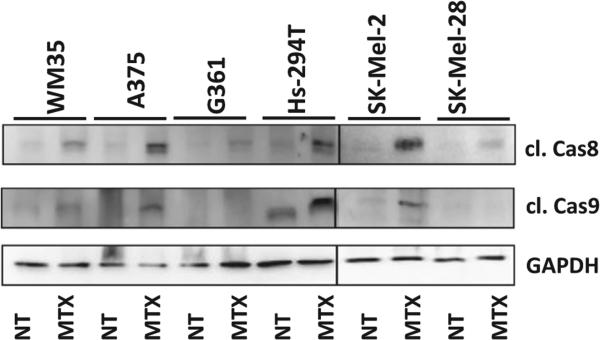
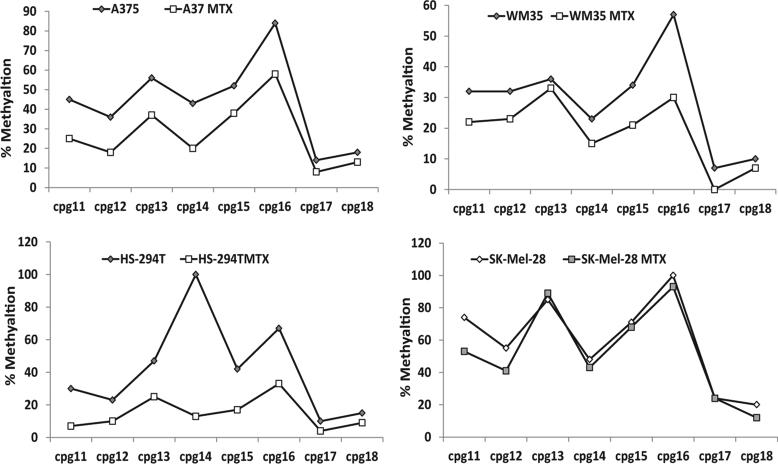
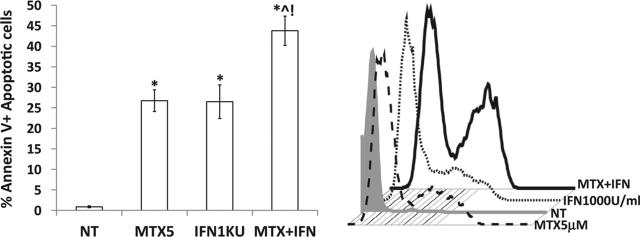
Melanoma, a highly aggressive form of cancer, is notoriously resistant to available therapies. Methotrexate (MTX), an antifolate, competitively inhibits DNA synthesis and is effective for several types of cancer. In cutaneous T-cell lymphoma (CTCL), MTX increases Fas death receptor by decreasing Fas promoter methylation by blocking the synthesis of SAM, the principal methyl donor for DNMTs, resulting in enhanced Fas-mediated apoptosis. The objective of this study was to explore the effects of MTX in human melanoma. MTX variably inhibited the survival of melanoma cells and induced apoptosis as evident by annexin V positivity and senescence associated β-galactosidase activity induction. Furthermore, MTX caused increased transcript and protein levels of extrinsic apoptotic pathway factors Fas and Fas-ligand, albeit at different levels in different cell lines. Our pyrosequencing studies showed that this increased expression of Fas was associated with Fas promoter demethylation. Overall, the ability of MTX to up-regulate Fas/FasL and enhance melanoma apoptosis through extrinsic as well as intrinsic pathways might make it a useful component of novel combination therapies designed to affect multiple melanoma targets simultaneously. In support of this concept, combination therapy with MTX and interferon-alpha (IFNα) induced significantly greater apoptosis in the aggressive A375 cell line than either agent alone.
Keywords: Apoptosis; DNA methylation; Fas/FasL; Melanoma; Methotrexate.
Figures
Similar articles
-
Analysis of the Effect of Gentian Violet on Apoptosis and Proliferation in Cutaneous T-Cell Lymphoma in an In Vitro Study.JAMA Dermatol. 2018 Oct 1;154(10):1191-1198. doi: 10.1001/jamadermatol.2018.2756. JAMA Dermatol. 2018. PMID: 30167641 Free PMC article.
-
Lipid Nanoparticle Delivery of Fas Plasmid Restores Fas Expression to Suppress Melanoma Growth In Vivo.ACS Nano. 2022 Aug 23;16(8):12695-12710. doi: 10.1021/acsnano.2c04420. Epub 2022 Aug 8. ACS Nano. 2022. PMID: 35939651 Free PMC article.
-
Role of inhibitor of growth 4 in the suppression of human melanoma cells through the Fas/FasL-mediated apoptosis pathway.Int J Mol Med. 2018 Feb;41(2):1055-1061. doi: 10.3892/ijmm.2017.3274. Epub 2017 Nov 20. Int J Mol Med. 2018. PMID: 29207034
-
The role of the Fas/FasL signaling pathway in environmental toxicant-induced testicular cell apoptosis: An update.Syst Biol Reprod Med. 2018 Apr;64(2):93-102. doi: 10.1080/19396368.2017.1422046. Epub 2018 Jan 4. Syst Biol Reprod Med. 2018. PMID: 29299971 Review.
-
The Fas/FasL Signaling Pathway: Its Role in the Metastatic Process and as a Target for Treating Osteosarcoma Lung Metastases.Adv Exp Med Biol. 2020;1258:177-187. doi: 10.1007/978-3-030-43085-6_12. Adv Exp Med Biol. 2020. PMID: 32767242 Review.
Cited by
-
DNA methylation in systemic lupus erythematosus.Epigenomics. 2017 Apr;9(4):505-525. doi: 10.2217/epi-2016-0096. Epub 2016 Nov 25. Epigenomics. 2017. PMID: 27885845 Free PMC article. Review.
-
Benefit/risk Ratio of Low-dose Methotrexate in Cutaneous Lesions of Mycosis Fungoides and Sézary Syndrome.Acta Derm Venereol. 2021 Feb 5;101(2):adv00384. doi: 10.2340/00015555-3719. Acta Derm Venereol. 2021. PMID: 33313939 Free PMC article.
-
Interferon α Induces the Apoptosis of Cervical Cancer HeLa Cells by Activating both the Intrinsic Mitochondrial Pathway and Endoplasmic Reticulum Stress-Induced Pathway.Int J Mol Sci. 2016 Nov 2;17(11):1832. doi: 10.3390/ijms17111832. Int J Mol Sci. 2016. PMID: 27827850 Free PMC article.
-
Epigenetics in SLE.Curr Rheumatol Rep. 2017 Sep;19(9):58. doi: 10.1007/s11926-017-0685-1. Curr Rheumatol Rep. 2017. PMID: 28752494 Free PMC article. Review.
-
Metabolic control of methylation and acetylation.Curr Opin Chem Biol. 2016 Feb;30:52-60. doi: 10.1016/j.cbpa.2015.10.030. Epub 2015 Nov 28. Curr Opin Chem Biol. 2016. PMID: 26629854 Free PMC article. Review.
References
-
- Jang S, Atkins MB. Lancet Oncol. 2013;14:e60–e69. - PubMed
-
- Jang S, Atkins MB. Clin. Pharmacol. Ther. 2014;95:24–31. - PubMed
-
- Camargo M, Cervenka J. Hum. Genet. 1980;54:47–53. - PubMed
-
- Martin M, Villar A, Sole-Calvo A, Gonzalez R, Massuti B, Lizon J, Camps C, Carrato A, Casado A, Candel MT, Albanell J, Aranda J, Munarriz B, Campbell J, Diaz-Rubio E. Ann. Oncol. 2003;14:833–842. - PubMed
Publication types
MeSH terms
Substances
Grants and funding
LinkOut - more resources
Full Text Sources
Other Literature Sources
Medical
Research Materials
Miscellaneous
