. 2014 May 26;205(4):555-71.
doi: 10.1083/jcb.201310018.

A TOGL domain specifically targets yeast CLASP to kinetochores to stabilize kinetochore microtubules

Affiliations

A TOGL domain specifically targets yeast CLASP to kinetochores to stabilize kinetochore microtubules

Caroline Funk et al. J Cell Biol. .

Abstract

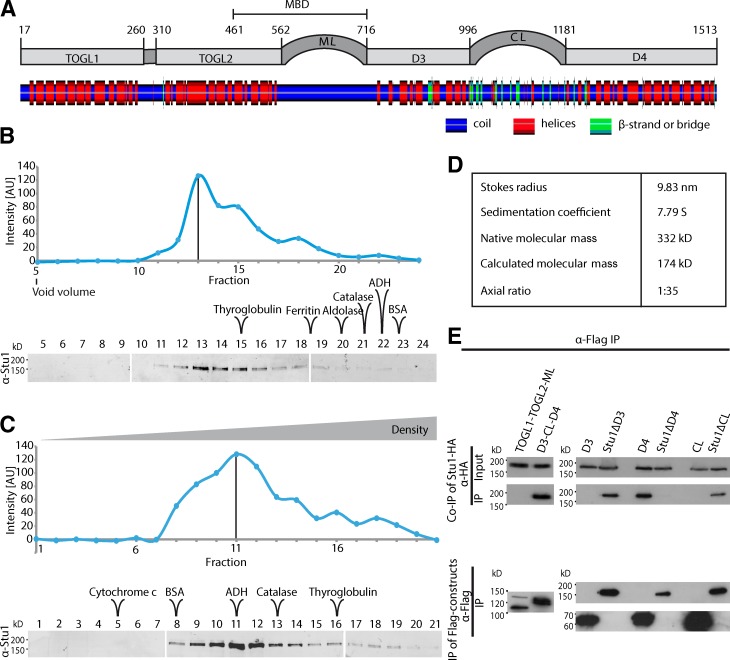
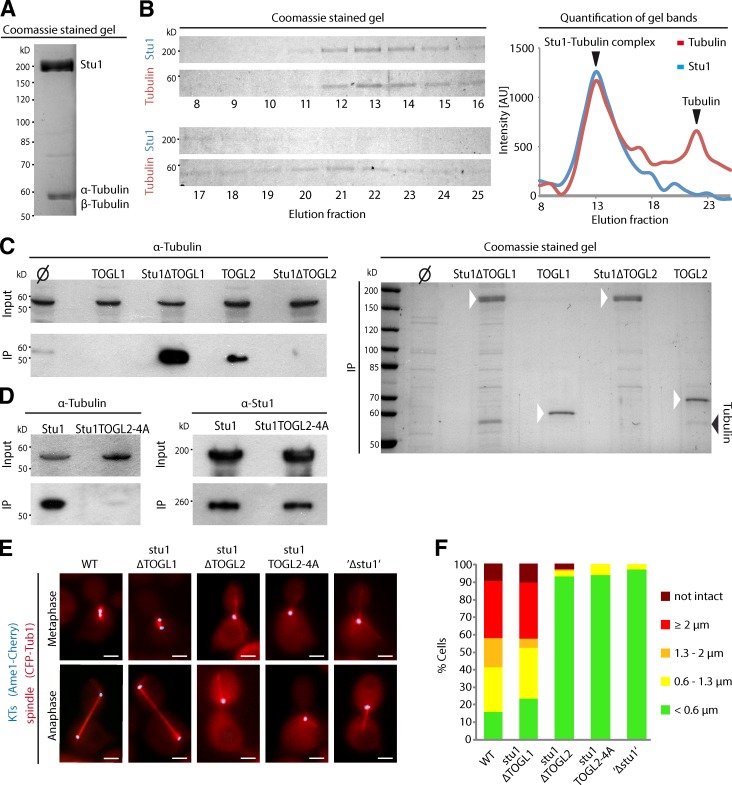
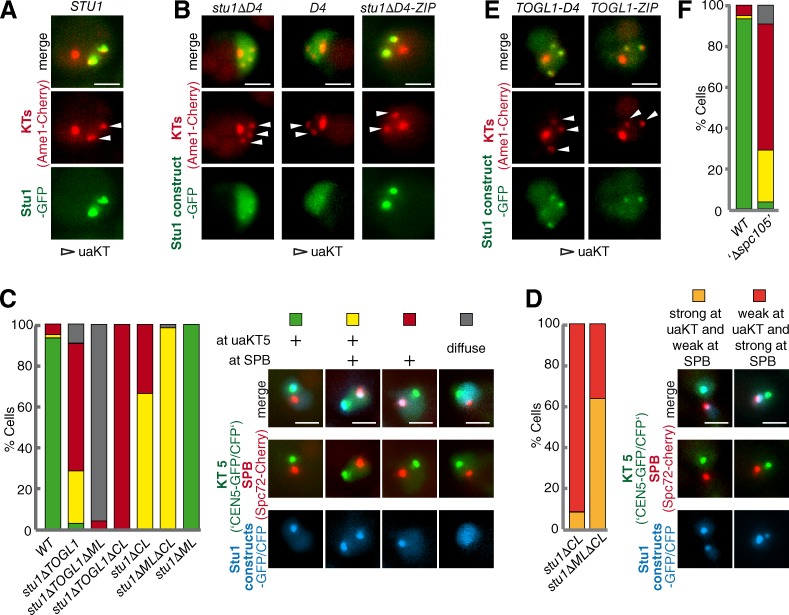
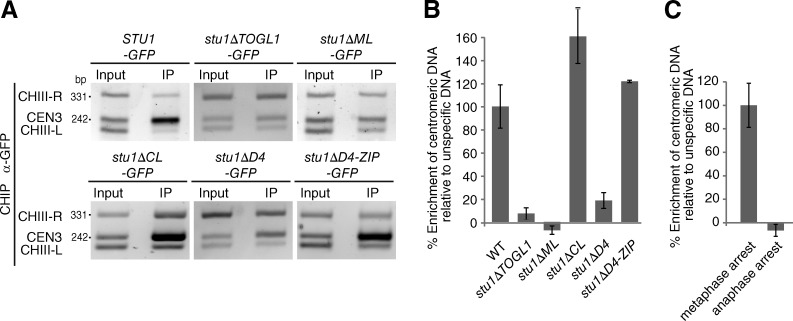
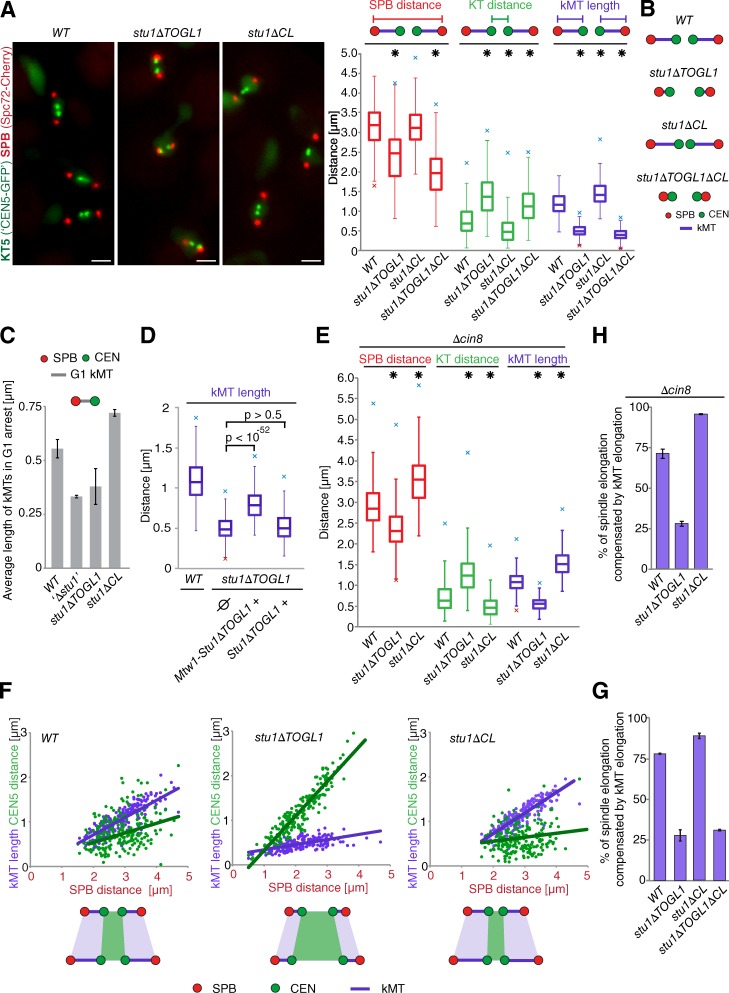
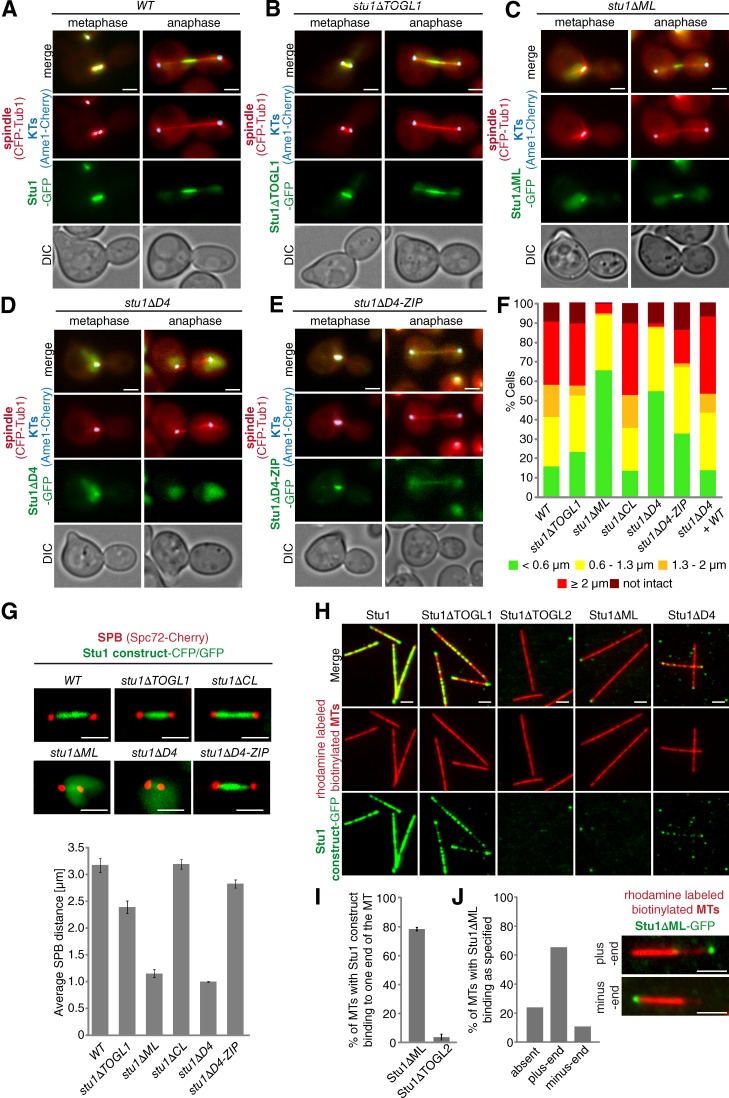
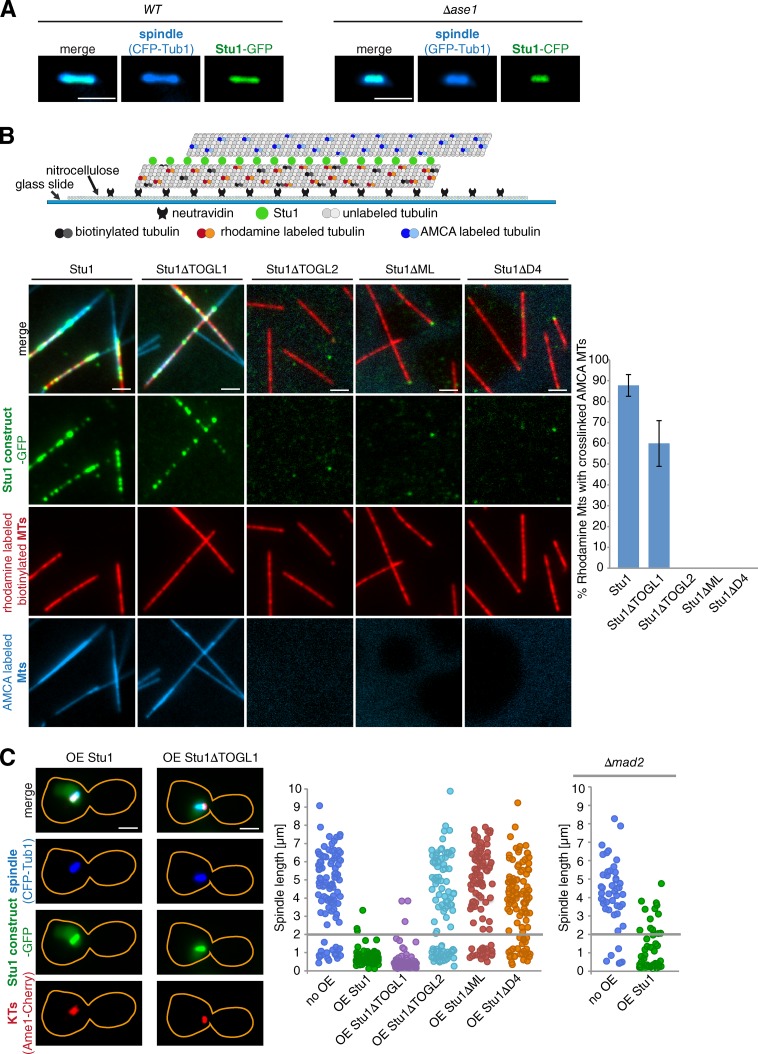
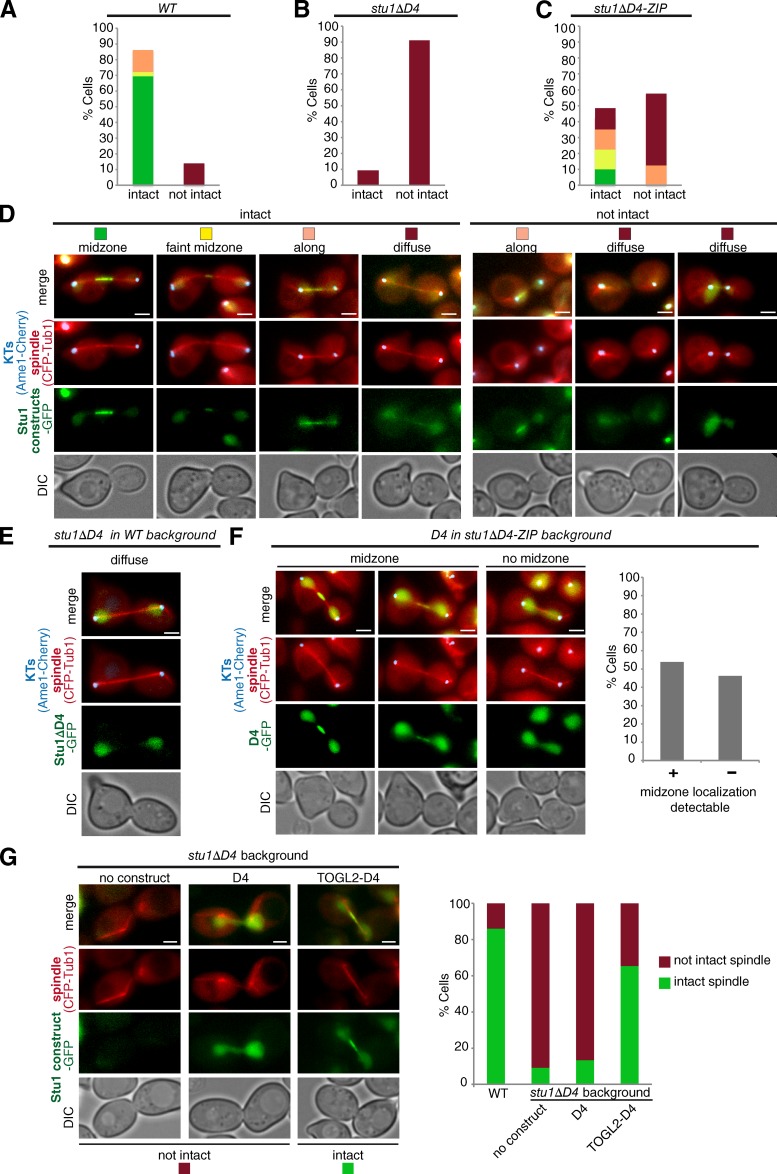
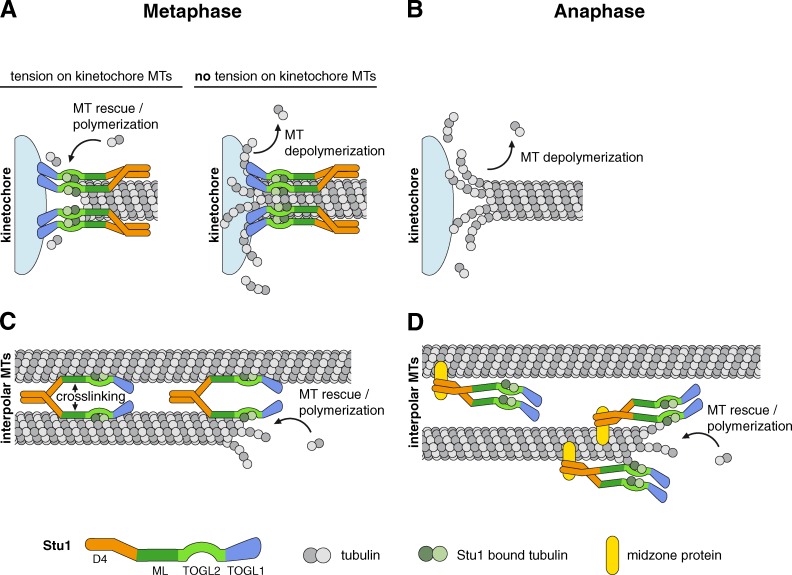
Cytoplasmic linker-associated proteins (CLASPs) are proposed to function in cell division based on their ability to bind tubulin via arrayed tumor overexpressed gene (TOG)-like (TOGL) domains. Structure predictions suggest that CLASPs have at least two TOGL domains. We show that only TOGL2 of Saccharomyces cerevisiae CLASP Stu1 binds to tubulin and is required for polymerization of spindle microtubules (MTs) in vivo. In contrast, TOGL1 recruits Stu1 to kinetochores (KTs), where it is essential for the stability and tension-dependent regulation of KT MTs. Stu1 is also recruited to spindle MTs by different mechanisms depending on the mitotic phase: in metaphase, Stu1 binds directly to the MT lattice, whereas in anaphase, it is localized indirectly to the spindle midzone. In both phases, the activity of TOGL2 is essential for interpolar MT stability, whereas TOGL1 is not involved. Thus, the two TOGL domains of yeast CLASP have different activities and execute distinct mitotic functions.


Figures

Figure 1.
Figure 1.
Stu1 dimerizes via D4. (A) Putative domain organization of Stu1. Secondary structure prediction was performed using SYMPRED and visualized by POLYVIEW-2D (Porollo et al., 2004). (B–D) Stu1 is a dimer with an elongated rod shape. The data shown are from a single representative experiment out of two analyses. (B) Gel filtration analysis of FLAG-Stu1. (C) Sucrose gradient analysis of FLAG-Stu1. (B and C) The samples were run on three separate gels as shown. Fractions containing Stu1 were detected by Western analysis and quantified. Standard proteins as indicated were used to determine the Stokes radius or sedimentation coefficient of Stu1 (see also Fig. S1, A and B). White lines indicate that intervening lanes have been spliced out. The black lines indicate the peak fraction. AU, arbitrary unit. (D) Native molecular mass and axial ratio of Stu1 as calculated from the determined hydrodynamic properties as previously described (Schuyler and Pellman, 2002). (E) D4 is the dimerization domain. FLAG-Stu1-GFP constructs were coexpressed with Stu1-HA in S. cerevisiae, and FLAG-Stu1-GFP constructs were affinity purified.
Figure 2.
Figure 2.
TOGL2, but not TOGL1, binds tubulin and is essential for spindle formation. (A) Tubulin copurifies with Stu1. FLAG-Stu1-GFP was affinity purified (see Materials and methods). Copurified tubulin was identified by mass spectrometry. (B) Stu1 and tubulin coelute as a complex during gel filtration. Fractions were analyzed as indicated and quantified. The data shown are from a single representative experiment out of two analyses. AU, arbitrary unit. (C) TOGL2, but not TOGL1, mediates tubulin binding. The constructs were expressed and purified as in A. Similar amounts of the IPs were loaded and subjected to Western analyses (α-tubulin) or PAGE/Coomassie. Ø indicates that no FLAG-tagged Stu1 construct was expressed. White arrowheads indicate the Stu1 constructs. (D) Mutations in the intra-HEAT repeat loops of TOGL2 abolish the Stu1–tubulin interaction. Constructs were expressed and purified as in A. (E) Cells were released from G1 arrest and visualized in meta- and anaphase. To analyze stu1ΔTOGL2, stu1TOGL2-4A, and ‘Δstu1’ cells, WT Stu1 expressed in the background was depleted. Bars, 2 µm. (F) Spindle phenotypes were quantified as indicated 2 or 2.5 h (Fig. S2) after G1 release. n > 100.
Figure 3.
Figure 3.
Stu1 localization to uaKTs depends on TOGL1, CL, dimerization, and Spc105. (A–F) Cells were analyzed 3 h after release from G1 into medium containing Nz. Bars, 2 µm. (A) Stu1 selectively associates with uaKTs. (B) Dimerization is required for Stu1 localization to uaKTs. To analyze D4-GFP cells, WT Stu1 expressed in the background was depleted. (C and D) TOGL1 and CL are essential for Stu1 localization to uaKTs. (C) Phenotypes were quantified as indicated in cells with a uaKT5. n > 70. (D) More detailed analyses of the Stu1 signal intensity at SPBs and uaKTs. n > 70. (E) TOGL1 interacts with uaKTs. WT Stu1 expressed in the background was depleted. (F) uaKT localization depends on Spc105. Depletion of Spc105 (‘Δspc105’) was as described in the Materials and methods section. Phenotypes were quantified as in C. n = 72. The result obtained for WT cells is shown as a comparison.
Figure 4.
Figure 4.
TOGL1 and ML localize the Stu1 dimer to metaphase KTs but not to anaphase KTs. (A and B) The Stu1–KT interaction in metaphase requires TOGL1, ML, and dimerization. Cells were arrested in metaphase by Cdc20 depletion for 3 h and analyzed by ChIP. (A) The presence of CEN3 DNA and two flanking DNA regions (CHIII-R and CHIII-L) was detected by triplex PCR. The input was 0.1% of the immunoprecipitation (IP). (B) Quantitative ChIP. The mean (3.5-fold) enrichment of CEN3 DNA over a control DNA (PHO5) observed for the WT was set to 100%. Error bars represent the SDs of three PCR experiments. (C) Stu1 is absent from anaphase KTs. cdc15-1 cells were arrested in anaphase by incubation at 37°C and analyzed by quantitative ChIP as in B. The result obtained for cells arrested in metaphase (set to 100%) is shown as a comparison.
Figure 5.
Figure 5.
Stu1 at metaphase KTs allows adaption of kMT length in correlation to tension at the KT–MT interface. (A–C) The kMT length is decreased in TOGL1 and increased in CL deletion mutants. (A) Cells were arrested in metaphase by Cdc20 depletion for 5 h. Bars, 2 µm. n > 200. Asterisks indicate significant differences to WT with P < 0.0001. (B) Schemes illustrating the results described in A. (C) Cells were arrested in G1 for 3 h. n > 100. Error bars represent the SDs for two experiments. (D) KT-linked Stu1ΔTOGL1 partially rescues kMT lengths in metaphase. stu1ΔTOGL1 cells additionally expressing either an Mtw1-Stu1ΔTOGL1 fusion protein or Stu1ΔTOGL1 were analyzed as in A. n > 100. Ø indicates that no additional Stu1 construct was expressed. (E) CIN8 deletion intensifies the ΔCL but fails to rescue the ΔTOGL1 phenotype. Cells with a Δcin8 background were analyzed as in A. n > 100. Asterisks indicate significant differences to WT with P < 0.0001. (A, D, and E) Boxes cover the middle 50% of the data, with a horizontal line at the median. Whiskers show the range of data (maximal 1.5× interquartile range). Maximal outliers are shown as crosses. (F) Cells were arrested in metaphase by Cdc20 depletion. (F and G) The percentage of spindle elongation that is compensated by kMT elongation is strongly decreased in the absence of TOGL1 but increased in the absence of CL in comparison with WT cells. After 2 and 5 h, inter-KT distances and kMT lengths of individual cells were determined and blotted against the corresponding inter-SPB distance. The models illustrate how kMTs and inter-KT distances react to spindle elongation as revealed by the presented data. n > 100. Lines indicate the linear regression. (G) Percentage of spindle elongation that is compensated by kMT elongation. The values represent the twofold slopes of the kMT graphs (purple) as shown in F. Error bars represent the SDs for two experiments. (H) Δcin8 strains with the indicated Stu1 constructs were analyzed as described in F and G. n > 100. Error bars represent the SDs for two experiments.
Figure 6.
Figure 6.
ML and TOGL2 confer interaction of Stu1 with the MT lattice. (A–G) Localization to metaphase spindles depends on ML and Stu1 dimerization. (A–E) Cells were released from G1 arrest and visualized in metaphase and anaphase. DIC, differential interference contrast. (F) Spindle phenotypes were quantified as indicated 2 or 2.5 h (Fig. S2) after G1 release. n > 100. (G) Cells were arrested in metaphase by Cdc20 depletion for 5 h. Spindle length was measured as the distance between SPB signals for n > 100. Error bars represent SDs for two experiments. (H) ML and TOGL2 confer MT lattice binding in vitro. Stabilized and immobilized MTs were incubated with purified Stu1 constructs (Fig. S5 A) and visualized as indicated. (I and J) TOGL2 confers MT plus-end binding in vitro. (I) Quantification of MTs with Stu1 at one of the ends. Experiment performed as in H. Error bars represent the SDs of two experiments. n > 150. (J) Quantification of MTs with Stu1 at the plus end. The experiment was performed as in H with the exception that polarity-marked MTs were used. The fraction of MTs with Stu1ΔML bound to plus or minus ends was determined. n = 174 . Bars, 2 µm.
Figure 7.
Figure 7.
Laterally bound Stu1 cross-links MTs. (A) Stu1 spindle localization in metaphase is independent of Ase1. Cells were arrested in metaphase by Cdc20 depletion for 2 h. (B) Stu1 cross-links MTs in vitro. As illustrated, stabilized MTs were immobilized, incubated with the indicated Stu1 constructs, and subsequently incubated with mobile MTs. Colocalization of immobile and mobile MTs was quantified. Error bars represent the SDs of two experiments. n > 100. (C) Overexpression (OE) of Stu1 arrests cells with metaphase-like spindles independent of the spindle assembly checkpoint. Yellow lines indicate the outline of the cells. Overexpression of the indicated Stu1 constructs was started after G1 release. The distribution of spindle lengths for cells with large buds (>2/3 of mother) was determined. Lines indicate the cutoff for metaphase spindles. n > 100 for WT, and n > 45 for Δmad2 cells. AMCA, aminomethylcoumarin acetate. Bars, 2 µm.
Figure 8.
Figure 8.
D4 mediates Stu1 midzone association. (A–G) Cells were analyzed 2 h after G1 release. (A–D) D4 promotes Stu1 midzone positioning. Stu1 localization and anaphase spindle phenotypes were quantified as indicated. n > 40. (E) Stu1ΔD4 fails to localize to the midzone of intact anaphase spindles. Stu1ΔD4 was expressed in the WT background. n > 40. (F) D4 associates with the spindle midzone. Midzone localization of D4 was quantified in stu1ΔD4-ZIP cells with intact anaphase spindles as indicated. n > 100. (G) Localizing TOGL2 to the spindle midzone via D4 rescues the stu1ΔD4 spindle defect. Anaphase spindle phenotypes were quantified in stu1ΔD4 cells expressing the indicated constructs. n > 30. DIC, differential interference contrast. Bars, 2 µm.
Figure 9.
Figure 9.
Model: How individual Stu1 domains direct Stu1 localization and function to KTs and MTs in metaphase versus anaphase. (A–D) See Discussion for details.

Similar articles

Cited by

References

    1. Akiyoshi B., Sarangapani K.K., Powers A.F., Nelson C.R., Reichow S.L., Arellano-Santoyo H., Gonen T., Ranish J.A., Asbury C.L., Biggins S. 2010. Tension directly stabilizes reconstituted kinetochore-microtubule attachments. Nature. 468:576–579 10.1038/nature09594 - DOI - PMC - PubMed
    1. Al-Bassam J., Chang F. 2011. Regulation of microtubule dynamics by TOG-domain proteins XMAP215/Dis1 and CLASP. Trends Cell Biol. 21:604–614 10.1016/j.tcb.2011.06.007 - DOI - PMC - PubMed
    1. Al-Bassam J., van Breugel M., Harrison S.C., Hyman A. 2006. Stu2p binds tubulin and undergoes an open-to-closed conformational change. J. Cell Biol. 172:1009–1022 10.1083/jcb.200511010 - DOI - PMC - PubMed
    1. Al-Bassam J., Larsen N.A., Hyman A.A., Harrison S.C. 2007. Crystal structure of a TOG domain: conserved features of XMAP215/Dis1-family TOG domains and implications for tubulin binding. Structure. 15:355–362 10.1016/j.str.2007.01.012 - DOI - PubMed
    1. Al-Bassam J., Kim H., Brouhard G., van Oijen A., Harrison S.C., Chang F. 2010. CLASP promotes microtubule rescue by recruiting tubulin dimers to the microtubule. Dev. Cell. 19:245–258 10.1016/j.devcel.2010.07.016 - DOI - PMC - PubMed

Publication types

MeSH terms

Substances

LinkOut - more resources