. 2014 May 26;205(4):591-606.
doi: 10.1083/jcb.201402066.

A new probe for super-resolution imaging of membranes elucidates trafficking pathways

Affiliations

A new probe for super-resolution imaging of membranes elucidates trafficking pathways

Natalia H Revelo et al. J Cell Biol. .

Abstract

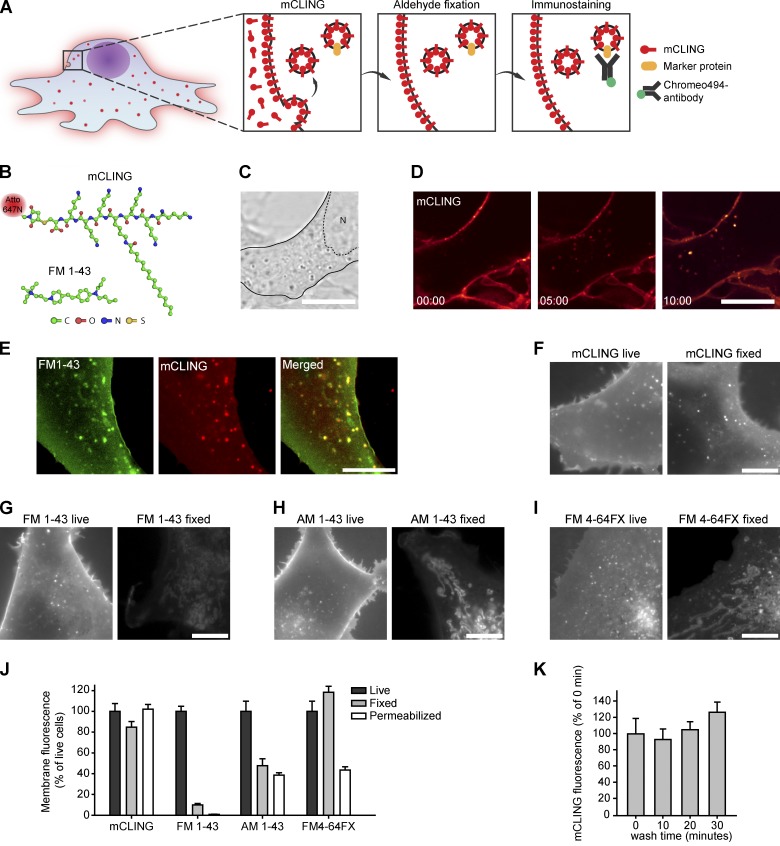
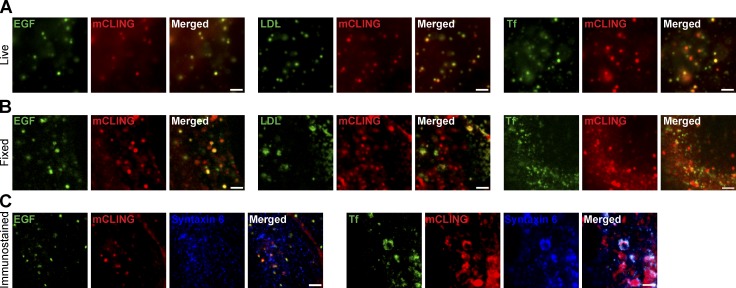
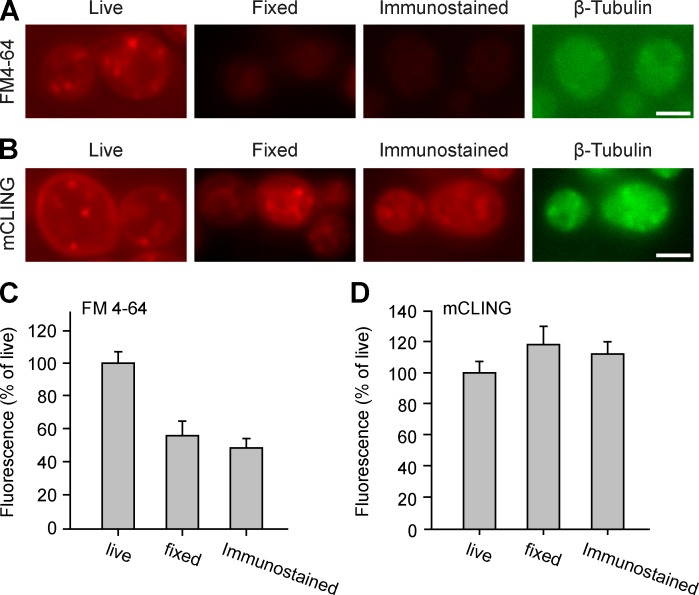
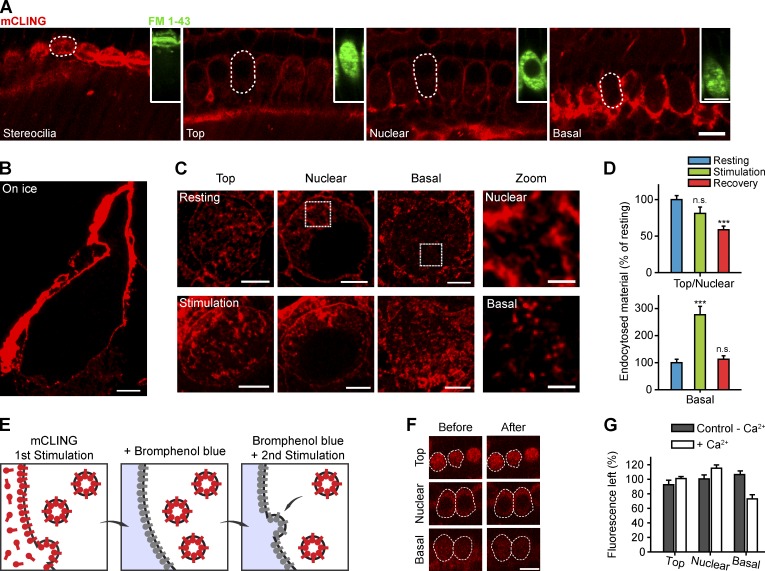
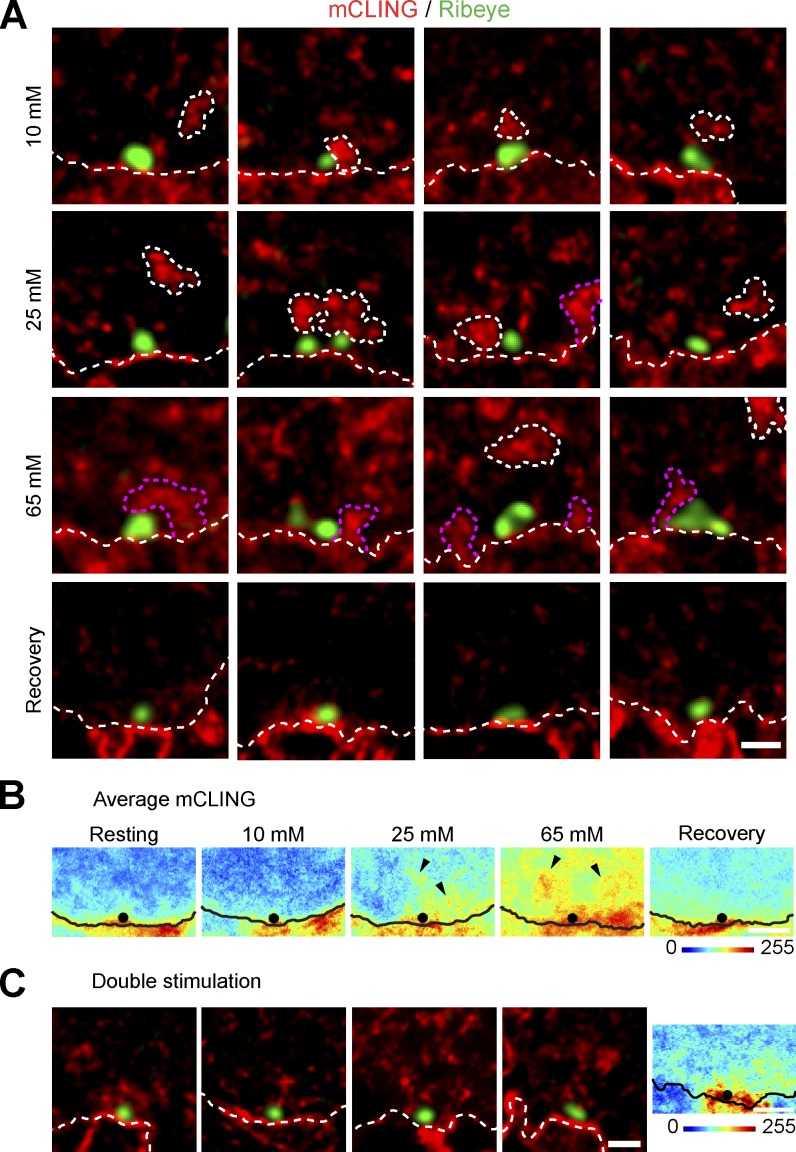
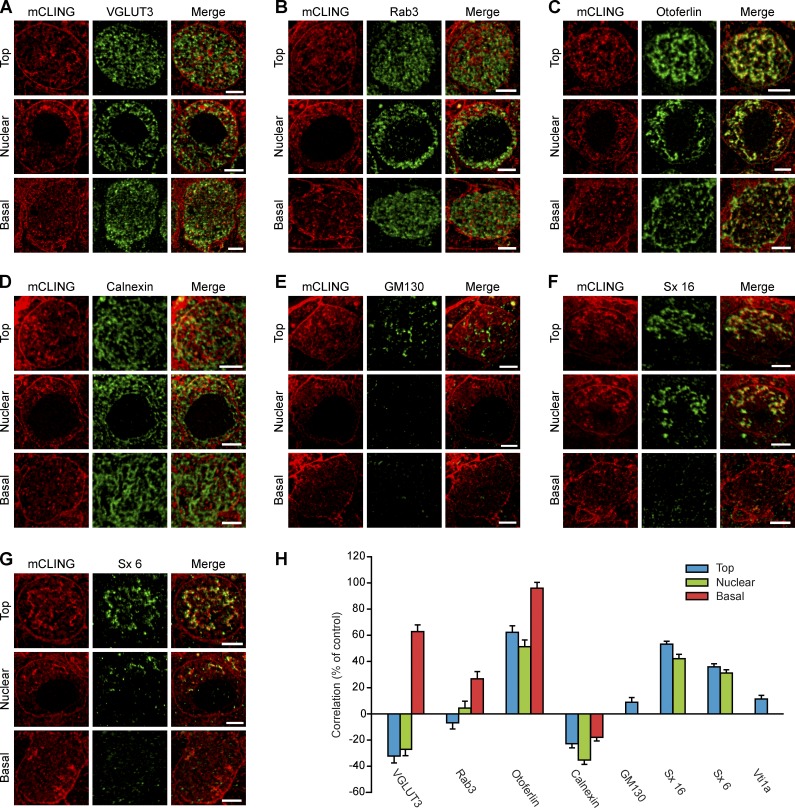
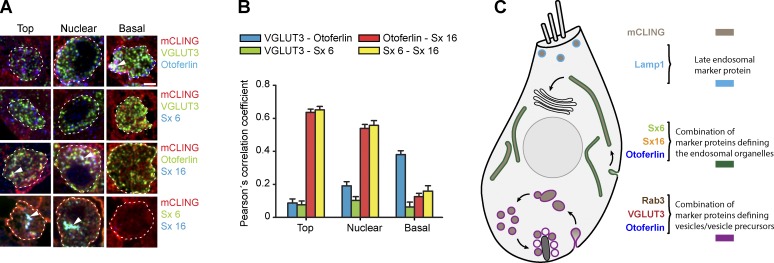
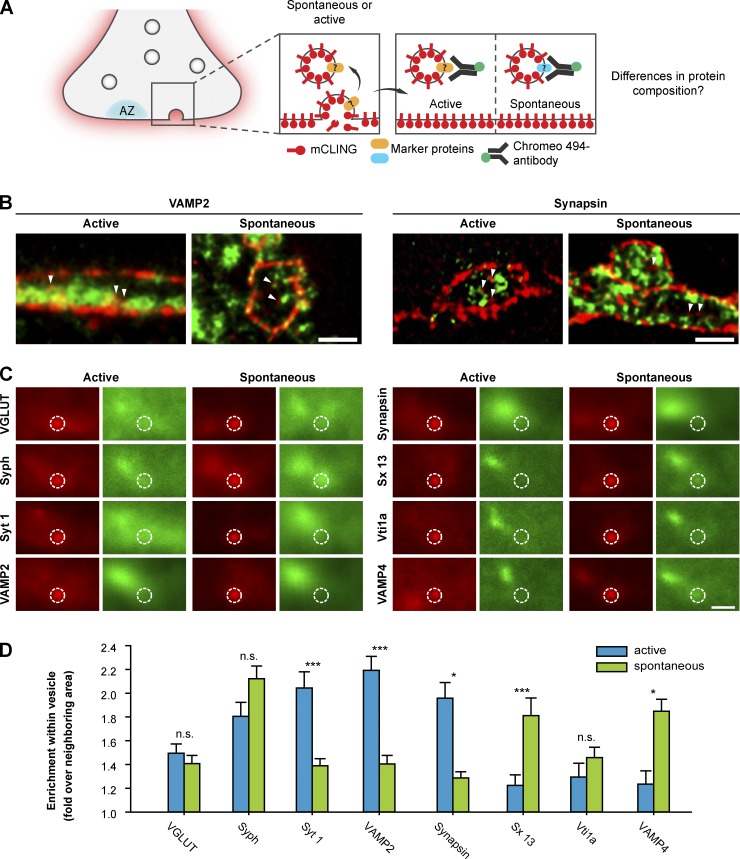
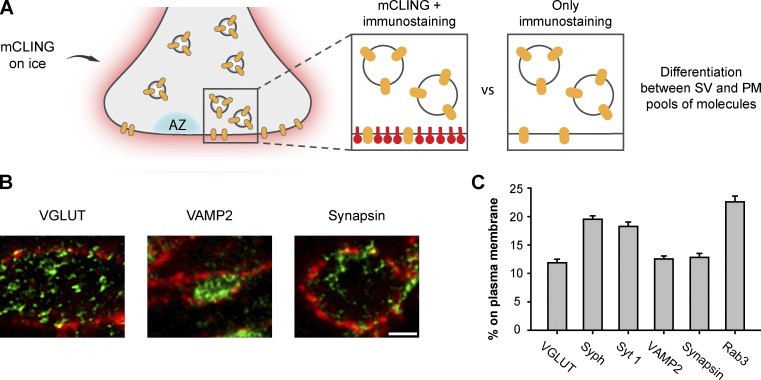
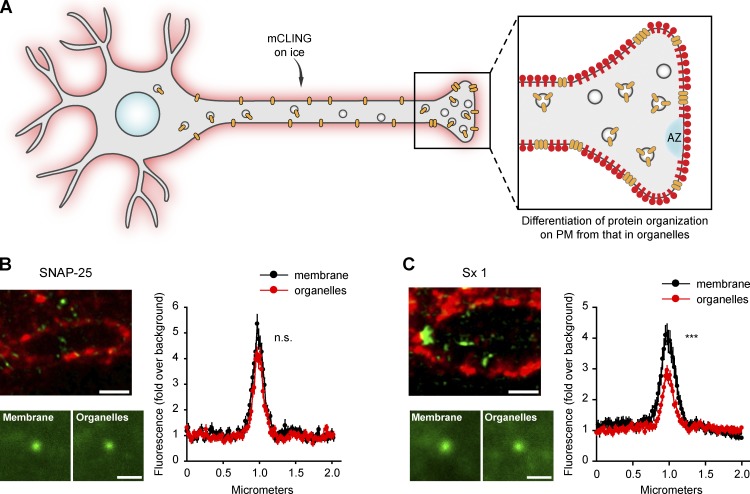
The molecular composition of the organelles involved in membrane recycling is difficult to establish as a result of the absence of suitable labeling tools. We introduce in this paper a novel probe, named membrane-binding fluorophore-cysteine-lysine-palmitoyl group (mCLING), which labels the plasma membrane and is taken up during endocytosis. It remains attached to membranes after fixation and permeabilization and can therefore be used in combination with immunostaining and super-resolution microscopy. We applied mCLING to mammalian-cultured cells, yeast, bacteria, primary cultured neurons, Drosophila melanogaster larval neuromuscular junctions, and mammalian tissue. mCLING enabled us to study the molecular composition of different trafficking organelles. We used it to address several questions related to synaptic vesicle recycling in the auditory inner hair cells from the organ of Corti and to investigate molecular differences between synaptic vesicles that recycle actively or spontaneously in cultured neurons. We conclude that mCLING enables the investigation of trafficking membranes in a broad range of preparations.


Figures

Figure 1.
Figure 1.
mCLING: A novel membrane probe. (A) Outline of an experiment designed to reveal the molecular composition of endocytotic organelles. The membrane probe mCLING labels the endocytotic organelles and is retained during fixation and immunostaining. Different protein markers can thus be analyzed on the endocytotic organelles. (B) The structure of mCLING compared with the smaller styryl dye FM 1-43. (C) Outline of a cultured cell (COS7) in bright-field microscopy. N marks the nucleus (dashed outline). (D) Uptake of mCLING in endocytotic organelles, visualized by confocal microscopy. (E) Live epifluorescence imaging of COS7 cells, co-incubated for 5 min with FM 1-43 and mCLING. Note the high colocalization of the two probes. (F–I) Comparison between live and fixed COS7 cells, incubated with mCLING (F), FM 1-43 (G), AM 1-43 (H), and FM 4-64FX (I). (J) Quantification of the fluorescence intensity of these four membrane probes in living, fixed, or fixed and permeabilized cells (21–37 cells evaluated in every condition). (K) Quantification of mCLING wash-off kinetics. COS7 cells were incubated with mCLING for 5 min and then washed for different time periods (24–28 cells evaluated for every incubation time point). Error bars show SEMs. Bars, 10 µm.
Figure 2.
Figure 2.
mCLING labels endocytotic organelles involved in ligand trafficking. (A) COS7 cells were incubated for 5 min with mCLING and with fluorescently coupled transferrin (Tf), LDL, or EGF at 37°C. The living cells were then analyzed by epifluorescence imaging. (B) The correlation of mCLING with the ligands is also evident after fixation, in confocal microscopy. (C) We immunostained cells after incubation with mCLING and transferrin or EGF. LDL was not used because it does not fix well and is lost during permeabilization. Note that mCLING still correlates with the ligand-labeled organelles. Immunostaining reveals that these organelles contain the endosomal SNARE protein syntaxin 6. Bars, 2 µm.
Figure 3.
Figure 3.
mCLING imaging in yeast. (A) Yeast cells from the strain BY4742 were incubated with FM 4-64 for 20 min, at RT, and were analyzed by epifluorescence imaging under different conditions: live (left), after fixation for 30 min with 4% PFA + 0.2% glutaraldehyde (middle), or after permeabilization and immunostaining for tubulin, using an antitubulin single-chain recombinant antibody (right; Nizak et al., 2003). (B) The cells were treated similarly, using mCLING. (C and D) Quantification of the FM4-64 or mCLING fluorescence levels. 17–31 fields of yeast cells were analyzed for each condition. Error bars show SEMs. Bars, 2 µm.
Figure 4.
Figure 4.
mCLING imaging in IHCs. (A) mCLING does not permeate mechanotransducer channels in living IHCs. Confocal images of the stereocilia bundle and of the top, nuclear, and basal levels of a row of living IHCs were taken after a 3-min incubation with 1.7 µM mCLING. mCLING is found inside the cells, presumably taken up by endocytotic organelles, but does not diffusely label the cells as seen for FM 1-43 (green insets), which enters the cytosol through the mechanotransducer channels. The dashed lines show the profile of one IHC at the different imaged planes. (B) STED microscopy image of a plastic section from an IHC incubated with mCLING at low temperature. Endocytosis is inhibited. (C) When incubated at 37°C, mCLING was found in structures of different sizes, both in resting cells (top) and in stimulated cells (bottom). The zoom images indicate typical organelles from the top/nuclear and basal regions of IHCs (boxes). (D) Stimulation increases mCLING labeling only in the basal region of the cells. The error bars show means ± SEM from 27, 22, and 57 cell top and nuclear regions (resting, stimulation, and recovery, respectively) and from 25, 28, and 27 cell bases (resting, stimulation, and recovery, respectively). n.s., no significant difference (t test, P > 0.05); ***, significant difference (t test, P ≤ 0.001) compared with resting condition. (E) Experimental outline for the investigation of exocytosis using mCLING: cells are stimulated in the presence of mCLING (65 mM KCl for 1 min), which is taken up in organelles. After a brief wash, BPB is added to quench the dye present on the cell surface (for 5 min). A second round of stimulation in the presence of BPB (65 mM KCl for 1 min) causes the exocytosis of labeled organelles, whose fluorescence is quenched. (F) Typical fluorescence images of top, nuclear, and basal regions of IHCs (dashed lines) treated with BPB, before (left) or after the second round of stimulation (right). (G) Quantification of the fluorescence intensity remaining after the second round of stimulation (white bars). As a control, we analyzed cells stimulated in the absence of Ca2+ during the second round (gray bars). All measurements are normalized to their initial intensity values, before stimulation. A significant decrease is only obtained for the basal region of the cells (t test, P < 0.001; two to six independent experiments were performed, with 8–15 IHCs analyzed in each experiment). Error bars show SEMs. Bars: (A and F) 10 µm; (B and C, main images) 2 µm; (C, zoom images) 500 nm.
Figure 5.
Figure 5.
mCLING reveals organelles endocytosed at the IHC base. (A) Endocytosis near active zones, at the base of the cell, during stimulation. mCLING-labeled organelles were imaged in the vicinity of synaptic ribbons (green). Several mCLING-labeled membrane infoldings and internalized organelles are indicated by the dashed white lines. Similar lines indicate the plasma membrane. Organelles that appear connected to the plasma membrane are indicated by the dashed pink lines. The different images show organelles appearing after stimulation (depolarization for 1 min with 10, 25, or 65 mM KCl) and after recovery from 65 mM KCl depolarization (5 min in Ca2+-containing buffer). (B) To obtain a more quantitative view of endocytosis across different release sites, average images centered on the synaptic ribbons were generated (from 20 to 31 individual ribbon synapses). The black lines show the estimated location of the plasma membrane in the average images, and the black dots indicate the location of the ribbons. Note the increase on average mCLING fluorescence intensity in stimulated active zones (black arrowheads). (C) A similar analysis of IHCs that were subjected to two rounds of stimulation (65 mM KCl for 1 min each). The double-stimulated cells contained more labeled organelles in the basal region of the cells than the cells stimulated only once, as expected (compare with bottom row of cells in A). (right) Several of these organelles find themselves close to the synaptic ribbon, as indicated also by the average image. White dashed lines indicate the plasma membrane. Bars: (A and C, left) 500 nm; (B and C, right) 1 µm.
Figure 6.
Figure 6.
Immunostaining analysis of the organelles involved in membrane recycling in IHCs. We labeled organs of Corti with mCLING and then immunostained them for different organelle markers. (A–G) The following markers were analyzed using two-color STED: VGLUT3, a synaptic vesicle marker (A); Rab3, a second synaptic vesicle marker (B); the synaptic protein otoferlin (C); the ER marker calnexin (D); the cis-Golgi apparatus marker GM130 (E); and the SNARE proteins syntaxin 16 (Sx 16) and syntaxin 6 (Sx 6), markers for endosomes (F and G). (H) Pearson’s correlation coefficients were determined for each immunostaining condition. For the markers present throughout the cell, the correlation coefficients were calculated at all the different levels of the cell (top, nuclear, and basal). For markers abundant only at the top (or the top/nuclear) level, the analysis was not performed at other levels. The correlation with an additional endosomal marker, the SNARE Vti1a, is also shown. Coefficients are expressed as percentages of the maximum expected correlation (% of control) obtained from two-color immunostaining of VGLUT3 using Atto647N- and Chromeo494-coupled secondary antibodies. Error bars represent mean correlation coefficient ± SEM (from 100 to 500 mCLING-labeled organelles, from 20 to 85 cells, in two to six independent experiments for each marker protein). Bars, 2 µm.
Figure 7.
Figure 7.
Multicolor immunostaining analysis of the IHC organelles. (A) mCLING-labeled organs of Corti were immunostained for VGLUT3 and otoferlin (first row), for VGLUT3 and syntaxin 6 (Sx 6; second row), for otoferlin and syntaxin 16 (Sx 16; third row), and finally for syntaxin 6 and syntaxin 16 (fourth row). The samples were cut into 20-nm sections and were imaged using an epifluorescence microscope. Dashed white lines indicate the plasma membrane of the IHCs. White arrowheads point to organelles where the signals for mCLING and the two immunostained proteins colocalized. Bar, 2 µm. (B) Pearson’s correlation coefficients were analyzed for the two markers immunostained in each experiment, selectively on mCLING-labeled organelles. Otoferlin and syntaxin 6 (or syntaxin 16) correlate in the mCLING-labeled organelles at the top and nuclear levels. VGLUT3 correlates best with otoferlin at the basal level. At least 100 organelles were analyzed for each condition. Error bars show SEMs. (C) Model of membrane recycling in IHCs. Organelles with different molecular composition recycle membrane in different regions, taking up mCLING. Apical endocytosis takes up membrane into round organelles, a sizeable proportion of which is similar to late endosomes (light blue). Endocytosis in the top and nuclear regions reaches tubular organelles containing otoferlin and two endosome markers, syntaxin 16 and syntaxin 6. This suggests that these organelles participate in constitutive pathways, probably by maintaining membrane traffic between the plasma membrane and the trans-Golgi. At the base of the cell, stimulation induces the formation of membrane infoldings and cisterns that are characterized by the presence of VGLUT3, Rab3, and also otoferlin.
Figure 8.
Figure 8.
mCLING reveals differences in protein composition between actively and spontaneously recycling synaptic vesicles in hippocampal neurons. (A) Experimental outline: neurons are incubated with mCLING, and active synaptic vesicle recycling is induced by stimulation. Alternatively, spontaneous vesicle recycling is allowed to take place, whereas the neurons are silenced using tetrodotoxin. The preparations are then immunostained, embedded in melamine, cut in thin sections, and imaged using two-color STED microscopy, which allows the investigation of the vesicle composition. AZ, active zone. (B) Typical images of mCLING-labeled synaptic boutons. Proteins are shown in green, and mCLING is shown in red. Arrowheads point to several endocytosed vesicles. (C) Average images of mCLING-labeled vesicles from stimulated or resting preparations. Red images show the mCLING signal; green images show the corresponding immunostaining signals. The circles indicate the vesicle area; note that this contains abundant staining for some, but not all, of the proteins. The larger protein-stained area, shown at the left of the green images, represents the synaptic vesicle cluster. (D) The enrichment of the different proteins of interest within the vesicles was calculated, over the neighboring areas within the synapse. The error bars show means ± SEM from 100 to 500 mCLING-labeled vesicles. n.s., no significant difference (t test, P > 0.05); *, significant difference (t test, P ≤ 0.05); ***, significant difference (t test, P ≤ 0.001). Syph, synaptophysin; Sx 13, syntaxin 13; VGLUT, vesicular glutamate transporter; Syt 1, synaptotagmin 1. Bars, 500 nm.
Figure 9.
Figure 9.
mCLING use in identifying the membrane-associated fraction of synaptic vesicle proteins. (A) Experimental outline: application of mCLING on ice reveals only the plasma membrane (PM). Immunostaining then allows the differentiation between membrane-associated staining and organelle-associated staining, which is further away from the membrane. (right) Without mCLING, the two cannot be differentiated. AZ, active zone; SV, synaptic vesicle. (B) Example two-color STED images. Proteins are shown in green, and mCLING is shown in red. Bar, 500 nm. (C) Analysis of the percentage of protein associated with the plasma membrane. The error bars show means ± SEM from 99 to 270 mCLING-labeled membrane areas. Syph, synaptophysin; Syt 1, synaptotagmin 1; VGLUT, vesicular glutamate transporter.
Figure 10.
Figure 10.
mCLING use in revealing differences between organellar and plasma membrane protein assemblies. (A) Experimental outline: as in Fig. 9, mCLING reveals the plasma membrane (PM) and allows the identification of protein clusters on the membrane or in intracellular organelles, away from the membrane. AZ, (B and C, top left) Example two-color STED images with mCLING in red and protein of interest in green (SNAP-25 or syntaxin 1 [Sx 1]). The bottom shows average images of the protein clusters, obtained by averaging 115–133 protein clusters from the membrane or from organelles for syntaxin 1 and 88–90 clusters for SNAP-25. (right) Average line scans through the protein clusters. Graphs show means ± SEM, from the same organelles. n.s., no significant difference in intensity between the peaks of the two distributions (t test, P > 0.05); ***, significant difference (t test, P ≤ 0.001). Bars, 500 nm.

References

    1. Atwood H.L., Govind C.K., Wu C.F. 1993. Differential ultrastructure of synaptic terminals on ventral longitudinal abdominal muscles in Drosophila larvae. J. Neurobiol. 24:1008–1024 10.1002/neu.480240803 - DOI - PubMed
    1. Banker G.A., Cowan W.M. 1977. Rat hippocampal neurons in dispersed cell culture. Brain Res. 126:397–425 10.1016/0006-8993(77)90594-7 - DOI - PubMed
    1. Bar-On D., Wolter S., van de Linde S., Heilemann M., Nudelman G., Nachliel E., Gutman M., Sauer M., Ashery U. 2012. Super-resolution imaging reveals the internal architecture of nano-sized syntaxin clusters. J. Biol. Chem. 287:27158–27167 10.1074/jbc.M112.353250 - DOI - PMC - PubMed
    1. Beaudoin G.M.J., III, Lee S.-H., Singh D., Yuan Y., Ng Y.-G., Reichardt L.F., Arikkath J. 2012. Culturing pyramidal neurons from the early postnatal mouse hippocampus and cortex. Nat. Protoc. 7:1741–1754 10.1038/nprot.2012.099 - DOI - PubMed
    1. Bedrosian J.C., Gratton M.A., Brigande J.V., Tang W., Landau J., Bennett J. 2006. In vivo delivery of recombinant viruses to the fetal murine cochlea: transduction characteristics and long-term effects on auditory function. Mol. Ther. 14:328–335 10.1016/j.ymthe.2006.04.003 - DOI - PMC - PubMed

Publication types

MeSH terms

Substances