. 2014 Apr;16(4):354-64.e1-3.
doi: 10.1016/j.neo.2014.04.005.

Mechanisms of buffer therapy resistance

Affiliations

Mechanisms of buffer therapy resistance

Kate M Bailey et al. Neoplasia. 2014 Apr.

Abstract

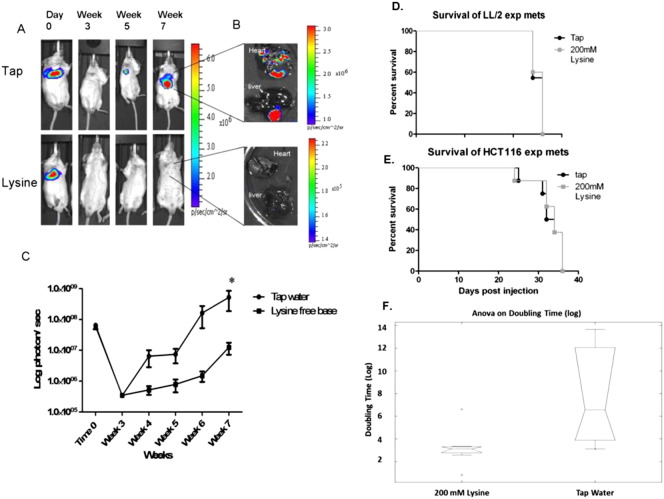
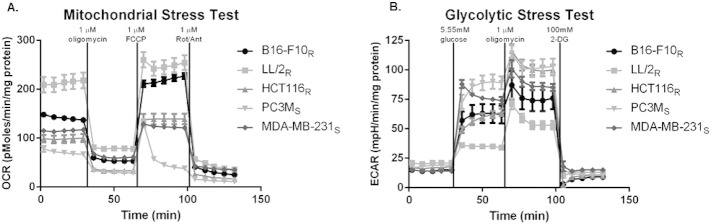
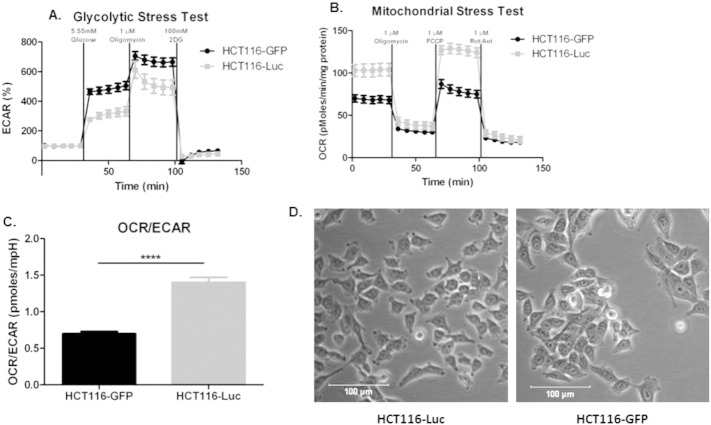
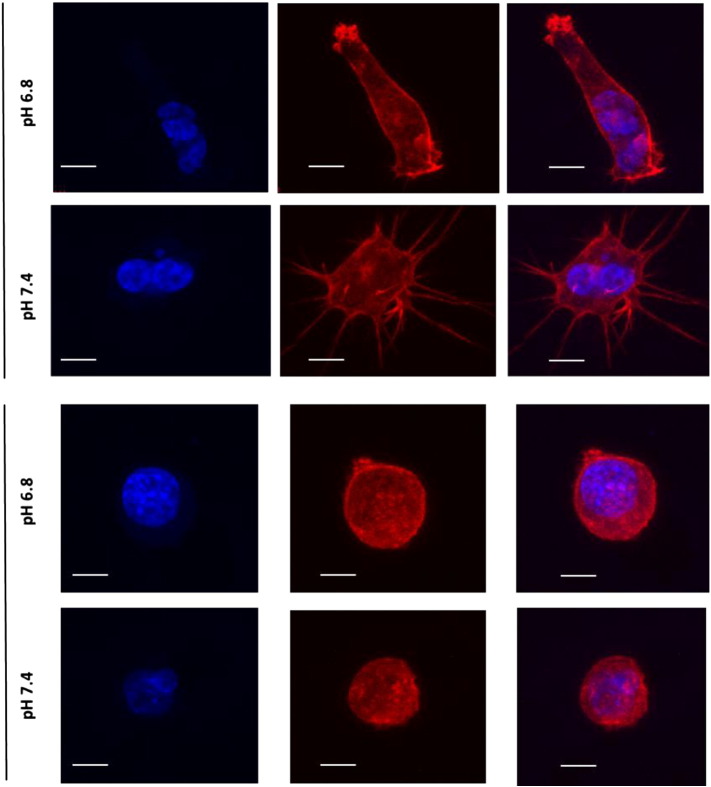
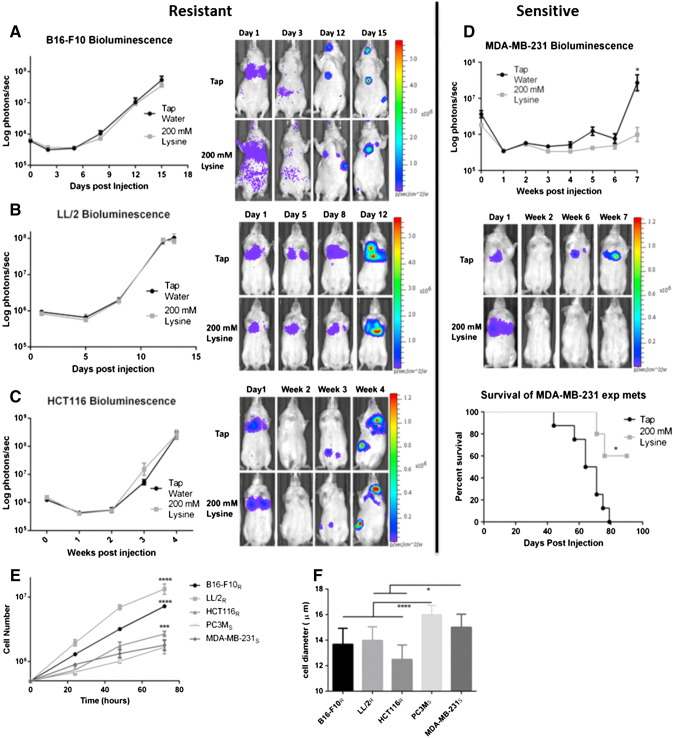
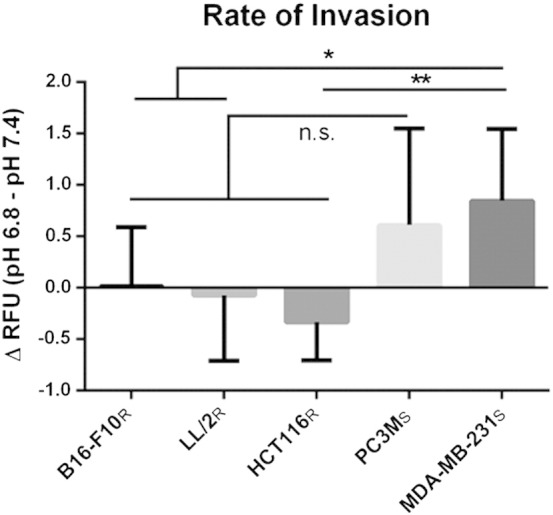
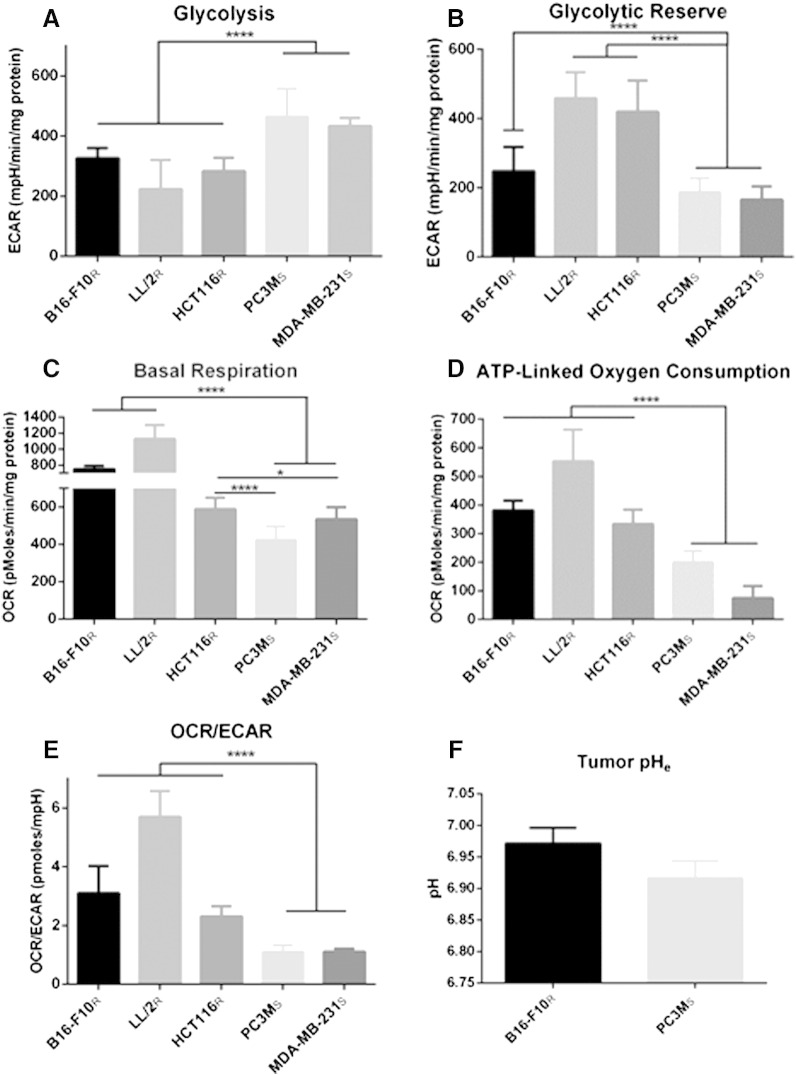
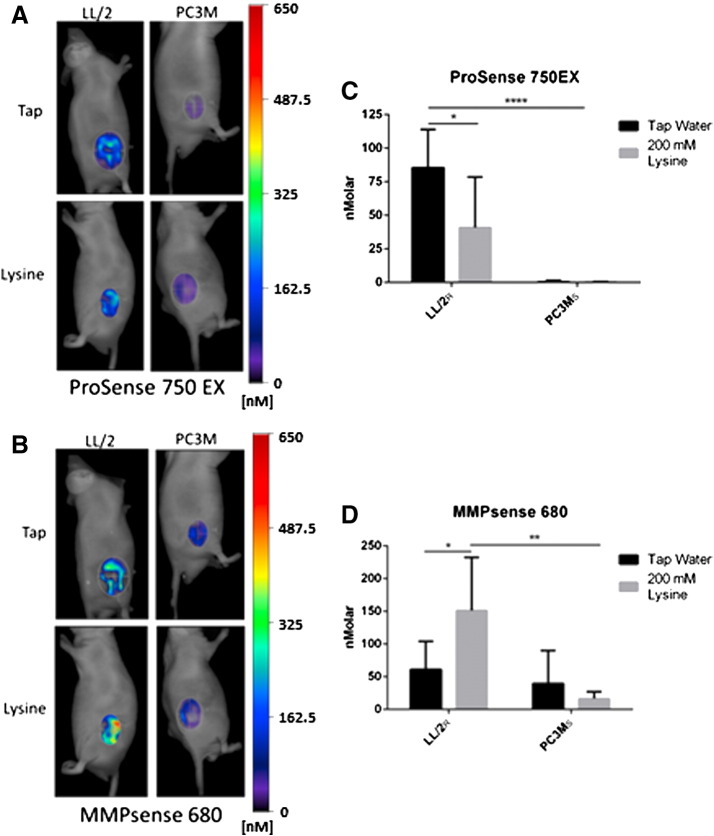
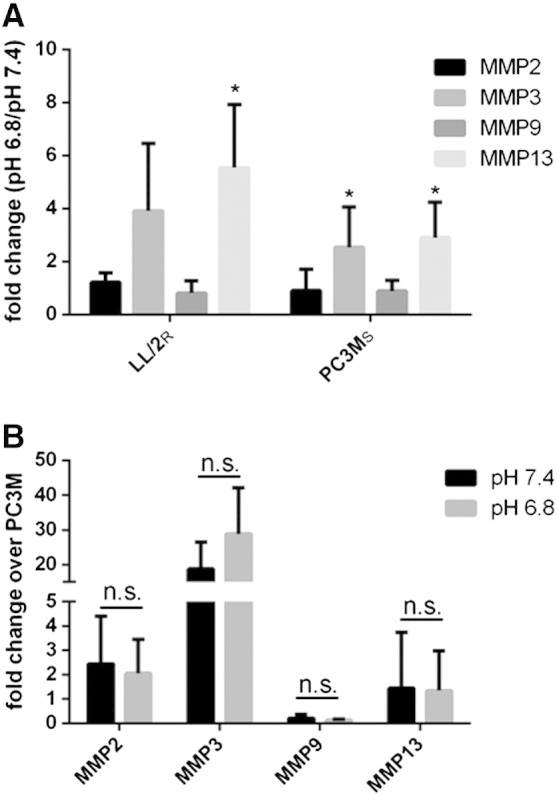
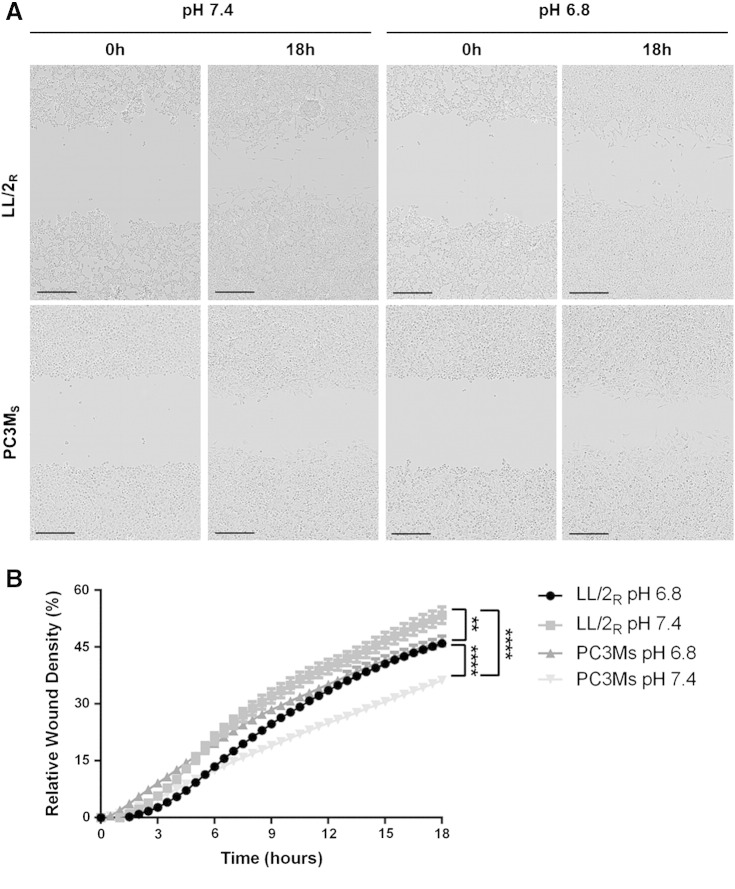
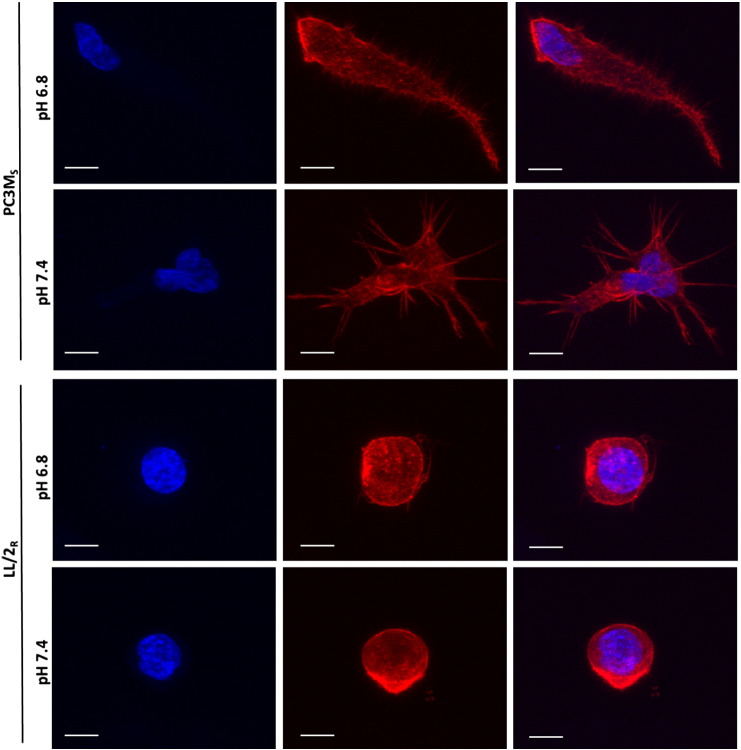
Many studies have shown that the acidity of solid tumors contributes to local invasion and metastasis. Oral pH buffers can specifically neutralize the acidic pH of tumors and reduce the incidence of local invasion and metastatic formation in multiple murine models. However, this effect is not universal as we have previously observed that metastasis is not inhibited by buffers in some tumor models, regardless of buffer used. B16-F10 (murine melanoma), LL/2 (murine lung) and HCT116 (human colon) tumors are resistant to treatment with lysine buffer therapy, whereas metastasis is potently inhibited by lysine buffers in MDA-MB-231 (human breast) and PC3M (human prostate) tumors. In the current work, we confirmed that sensitive cells utilized a pH-dependent mechanism for successful metastasis supported by a highly glycolytic phenotype that acidifies the local tumor microenvironment resulting in morphological changes. In contrast, buffer-resistant cell lines exhibited a pH-independent metastatic mechanism involving constitutive secretion of matrix degrading proteases without elevated glycolysis. These results have identified two distinct mechanisms of experimental metastasis, one of which is pH-dependent (buffer therapy sensitive cells) and one which is pH-independent (buffer therapy resistant cells). Further characterization of these models has potential for therapeutic benefit.


Figures

Supplemental Figure 1
Sensitivity of PC3MS to treatment with lysine buffer therapy. (A–C) Figure reprinted from . (A) Representative bioluminescent images of PC3MS metastasis in SCID mice. (B) Ex vivo bioluminescent imaging of PC3MS metastasis. (C) Graphic representation of bioluminescent imaging of PC3MS metastasis. Data is reported as log photons/sec ± SEM. Kaplan Meier curves showing survival of experimental metastasis models of LL/2R (D) and HCT116R (E). (F) Box plot of log doubling time (DT) estimate of MDA-MB-231 experimental metastasis data. *P < 0.5. R, resistant.
Supplemental Figure 2
Metabolic analysis of buffer therapy resistant and sensitive cells. A. Line graph showing sensitive and resistant cells oxygen consumption rates (OCR) through a mitochondrial stress test. Five basal measurements were obtained while cells were in media containing 5.55 mmol/l glucose, 2 mmol/l glutamine and 1 mmol/l pyruvate. Treatment of cells with oligomycin (1 μmol/l) led to a decrease in OCR that can be related to ATP production, followed by an increase in OCR to maximal respiration rates after treatment with FCCP (1 μmol/l). Finally, complete OXPHOS inhibition was achieved after treatment with Rotentone (1 μmol/l) and Antimycin A (1 μmol/l) B. Line graph showing sensitive and resistant cells extracellular acidification rates (ECAR) through a glycolytic stress test. Five basal measurements of cells that had been glucose starved for 2 hours shows non-glycolytic acidification. Stimulation of cells with glucose (5.55 mmol/l) results in basal glycolysis levels, which is increased to maximal glycolysis flux upon treatment with oligomycin (1 μmol/l). Glycolysis inhibition is achieved with treatment of 2DG (100 mmol/l). Data was normalized to mg protein and is reported as mean ± SD. R= Resistant, S= Sensitive.
Supplemental Figure 3
Metabolic profile analysis of HCT116-Luc and HCT116-GFP cells. Glycolytic and mitochondrial stress tests show different metabolic profiles of HCT116-Luc and HCT116-GFP cells. (A) Extracellular acidification rates (ECAR) of cells after stimulation of glycolysis with glucose (5.55 mmol/l), oligomycin (1 μmol/l) and glycolysis inhibitor, 2DG (100 mmol/l). (B) Oxygen consumption rates (OCR) of cells before treatment with oligomycin (1 μmol/l), FCCP (1 μmol/l) and Rotentone (1 μmol/l) and Antimycin A (1 μmol/l). (C) OCR/ECAR ratio of cells during basal metabolism. (D) Representative brightfield microscopy images of HCT116-Luc and HCT116-GFP cells in pH 7.4 culture conditions. Data shown as mean ± SD. Scale bars represent 100 μm.
Supplemental Figure 4
Morphologies in a 3D matrix in vitro. LL/2R and PC3MS cells were seeded onto a thick (500-1000 μm) layer of polymerized matrigel and invaded into the matrix over a period of 72 hours in pH 6.8 or pH 7.4 media. Single cells were imaged using confocal microscopy for morphological studies. Additional representative images of PC3MS cells (upper panels) and LL/2R cells (lower panels) show a 3D reconstruction of at least 20 slices. Phalloidin (F-actin) is shown in red; Hoechst nuclear stain is shown in blue. Scale bars represent 10 μm. R, resistant; S, sensitive.
Figure 1
Figure 1
Effect of lysine on metastasis and survival. Efficacy of lysine was determined by pre-treating SCID-beige mice for a week before tail vein injection of cells stably expressing Firefly-luciferase in an experimental metastasis model. Treatment with 200 mmol/l lysine was administered continuously throughout the experiment. Metastasis formation was measured by bioluminescent imaging, reported as log photons per second ± SEM, and representative bioluminescent images of one mouse per cohort for each experiment are shown at the times indicated. Bioluminescent imaging of B16-F10 metastasis (Tap n = 10, Lysine n = 10)(A), LL/2 metastasis (Tap n = 10, Lysine n = 10) (B), and HCT116 metastasis (Tap n = 8, Lysine n = 10) (C) shows buffer therapy is ineffective. (D) Bioluminescent imaging of MDA-MB-231 metastasis shows buffer therapy is effective in reducing metastatic formation (upper panel) leading to a significant increase in survival (bottom panel) (Tap n = 5, Lysine n = 8). (E) Average cell growth curves measured over 72 hours indicates significant growth rate differences between resistant and sensitive cells and correlate with in vivo tumor growth rates. Data shown as mean cell number ± SD. (F) Cell diameter measurements of single cells in suspension show resistant cells are significantly smaller than sensitive cells. Data shown as mean cell diameter (μm) ± SD. Cells will be identified as resistant or sensitive to treatment with subscripts (R = Resistant; S = Sensitive). *P < .05; ***P < .001; ****P < .0001.
Figure 2
Figure 2
Effect of pHe on invasion rates of resistant and sensitive cells. In vitro invasion assay using a Boyden chamber coated with Matrigel. Fluorescently labeled cells were measured every 6 hours for 48 hours for invasion through Matrigel layer. Data shown is the result of two biologic experiments (n = 6/sample) normalized to wells lacking serum attractant (n = 2/sample). Data is presented as the mean difference in the rate of invasion of cells cultured in pH 6.8 and cells cultured in pH 7.4 ± SD. The rate of invasion of sensitive cells increases in pH 6.8 compared to resistant lines. *P < .05; **P < .005. R, resistant; S, sensitive.
Figure 3
Figure 3
Metabolic profile analysis of resistant and sensitive cells and tumor pH. In vitro oxygen consumption rate (OCR) and extracellular acidification rate (ECAR) of resistant and sensitive cells, measured using Seahorse XF-96 Instrument. Metabolic data are presented as mean ± SD. (A) ECAR measurements in response to 5.55 mmol/l glucose stimulation indicate basal glycolytic activity of cells. Sensitive cells are significantly more glycolytic than resistant cells. (B) The increase in ECAR of cells in response to treatment with 1 μmol/l oligomycin minus basal glycolytic activity indicates the glycolytic reserve of cells. Sensitive cells have significantly reduced glycolytic reserve compared resistant cells.(C) Basal OCR measurements show significantly higher oxidative phosphorylation flux in resistant cells compared to sensitive cells. (D) OCR contributing to production of ATP during oxidative phosphorylation is measured by the difference of basal OCR and the OCR of cells after treatment with 1 μmol/l oligomycin, a mitochondrial ATP synthase inhibitor. The amount of OCR contributing to the production of ATP by oxidative phosphorylation is significantly higher in resistant cells compared to sensitive cells. (E) The OCR/ECAR ratio of cells during basal metabolism indicates that sensitive cells are significantly more glycolytic than resistant cells. (F) Intratumoral pH measurements of subcutaneous tumors using pH electrodes shows that increased glycolytic activity of sensitive cells, PC3MS, contributes to a more acidic tumor microenvironment than resistant tumors, B16-F10R. pH data are presented as mean of independent measurements (B16-F10Rn = 10; PC3MSn = 5) ± SEM. *P < .05; ****P < .0001. R, resistant; S, sensitive.
Figure 4
Figure 4
Resistant tumors have increased in-vivo protease activity. Mice bearing LL/2R (Tap n = 7, Lysine n = 8) and PC3MS (Tap n = 7, Lysine n = 5) tumors were injected with activatable probes, ProSense 750EX and MMPsense 680, which report Cathepsin and MMP activity, respectively. Representative images of fluorescent tomographic imaging showing cathepsin activity through ProSense 750EX signal (A) through MMPsense 680 (B) in LL/2R and PC3MS tumors in mice receiving either tap water or lysine buffer. (C) Quantitation of ProSense 750EX activated signal in tumors, normalized to tumor size. (D) Quantitation of MMPsense 680 activated signal in tumors, normalized to tumor size. Data are presented as mean nanomolar concentration ± SD. *P < .05; **P < .01; ****P < .0001. R, resistant; S, sensitive.
Figure 5
Figure 5
Elevated MMP expression in resistant cells. Quantitation of MMP expression in sensitive and resistant cells grown in physiological or acidic pH media for 24 hours. Transcripts were normalized to β-actin expression before analysis. (A) Ratio of expression of MMP-2, -3, -9 and -13 in LL/2R and PC3MS cultured in acidic media relative to cells cultured in physiological media. (B) Ratio of expression of MMP-2, -3, -9, and -13 in LL/2R cells relative to expression in PC3MS cells cultured in acidic and physiological media. Data are the average of three independent experiments and is reported as mean ± SD. *P < .05. R, resistant; S, sensitive.
Figure 6
Figure 6
Migratory patterns of LL/2R and PC3MS cells; 700- to 800-μm wounds were created in confluent cell cultures exposed to physiologic or acidic media 24 hours before wound formation, and during the duration of the experiment. Samples were imaged in 30-minute intervals for 18 hours. (A) Representative microscopy images of LL/2R (upper panel) and PC3MS (lower panel) show movement across a wound at 0 and 18 hours in pH 7.4 or pH 6.8 media. Scale bars represent 300 μm. (B) Percent relative wound density was determined by measuring the density of cells within the original wound site at each of the time points imaged. Data are shown as the mean ± SEM and are representative of three independent experiments. **P < .01; ****P < .0001; R, resistant; S, sensitive.
Figure 7
Figure 7
Morphologies in a 3D matrix in vitro. LL/2R and PC3MS cells were seeded onto a thick (500-1000 μm) layer of polymerized Matrigel and invaded into the matrix over a period of 72 hours in pH 6.8 or pH 7.4 media. Single cells were imaged using confocal microscopy for morphological studies. Representative images of PC3MS cells (upper panels) and LL/2R cells (lower panels) show a 3D reconstruction of at least 20 slices. Phalloidin (F-actin) is shown in red, Hoechst nuclear stain is shown in blue. Scale bars represent 10 μm. R, resistant; S, sensitive.

References

    1. Chambers A.F., Groom A.C., MacDonald I.C. Dissemination and growth of cancer cells in metastatic sites. Nat Rev Cancer. 2002;2:563–572. - PubMed
    1. Hanahan D., Weinberg R.A. Hallmarks of cancer: the next generation. Cell. 2011;144:646–674. - PubMed
    1. Moellering R.E., Black K.C., Krishnamurty C., Baggett B.K., Stafford P., Rain M., Gatenby R.A., Gillies R.J. Acid treatment of melanoma cells selects for invasive phenotypes. Clin Exp Metastasis. 2008;25:411–425. - PubMed
    1. Rofstad E.K. Microenvironment-induced cancer metastasis. Int J Radiat Biol. 2000;76:589–605. - PubMed
    1. Rofstad E.K., Mathiesen B., Kindem K., Galappathi K. Acidic extracellular pH promotes experimental metastasis of human melanoma cells in athymic nude mice. Cancer Res. 2006;66:6699–6707. - PubMed

Publication types