. 2014 May 27:5:4002.
doi: 10.1038/ncomms5002.

Design of synthetic yeast promoters via tuning of nucleosome architecture

Affiliations

Design of synthetic yeast promoters via tuning of nucleosome architecture

Kathleen A Curran et al. Nat Commun. .

Abstract

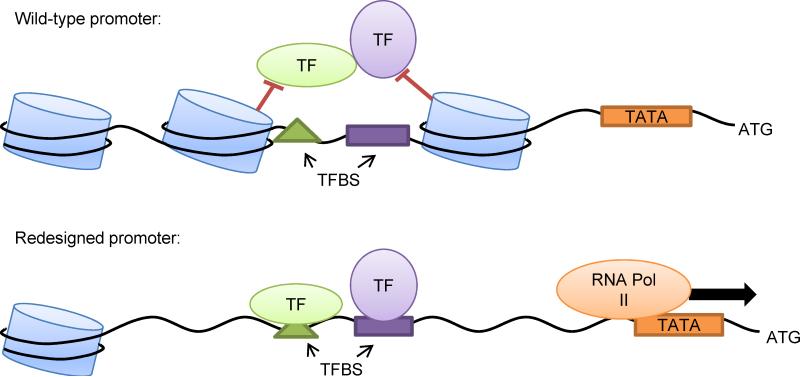
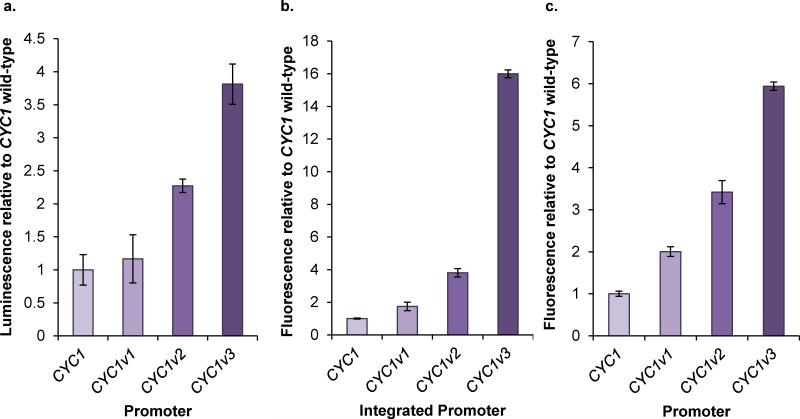
Model-based design of biological parts is a critical goal of synthetic biology, especially for eukaryotes. Here we demonstrate that nucleosome architecture can have a role in defining yeast promoter activity and utilize a computationally-guided approach that can enable both the redesign of endogenous promoter sequences and the de novo design of synthetic promoters. Initially, we use our approach to reprogram native promoters for increased expression and evaluate their performance in various genetic contexts. Increases in expression ranging from 1.5- to nearly 6-fold in a plasmid-based system and up to 16-fold in a genomic context were obtained. Next, we demonstrate that, in a single design cycle, it is possible to create functional, purely synthetic yeast promoters that achieve substantial expression levels (within the top sixth percentile among native yeast promoters). In doing so, this work establishes a unique DNA-level specification of promoter activity and demonstrates predictive design of synthetic parts.


Figures

Figure 1
Figure 1
A model for promoter strength. Native promoters can be redesigned for increased strength by decreasing nucleosome affinity. Transcription factors are designated “TF” and binding sites are “TFBS.”
Figure 2
Figure 2
Nucleosome affinity correlates to mutant promoter strength. A) Computational nucleosome affinity profiles generated using a hidden Markov model for several TEF1 mutant promoters, , with TEF1 mutant 2 being the weakest and TEF1 mutant 6 the strongest B) Experimental promoter strength as a function of cumulative affinity scores based on profiles in (A) for the TEF1 mutant promoter library.
Figure 3
Figure 3
Computational candidates generated for one round of the CYC1 promoter redesign. Each candidate queried for the CYC1 promoter redesign was plotted for the first round of A) a greedy algorithm searching over all possible single base pair changes per round and B) a greedy algorithm searching over all possible double base pair changes per round. For the algorithm searching over all single base pair changes, known transcription factor binding sites, TATA boxes, and transcription start sites are annotated. For the algorithm searching over all pairs, each point on the surface represents the most favorable pair of mutations (out of 16 possibilities) for a particular pair of positions.
Figure 4
Figure 4
Redesign of native yeast promoters for increased expression by decreasing nucleosome affinity. A) Computationally redesigned promoters exhibiting upwards of 3.2-fold increases in fluorescence over wild-type. Error bars represent standard deviation from three biological replicates. See Supplementary Figures 2-7 for a comparison of wild-type promoter strengths and predicted nucleosome affinity profiles. B) Relative transcript level as measured by quantitative PCR for the promoters shown in (A). Error bars represent standard deviation from three technical replicates.
Figure 5
Figure 5
Nucleosome occupancy is decreased in the CYC1v3 promoter relative to the CYC1 promoter. A) Relative abundance of nucleosomal DNA as measured by micrococcal nuclease assays in CYC1 and CYC1v3 promoters. After micrococal nuclease digestion, copy number was measured across the promoter using a quantitative PCR (qPCR) tiling array. Each point represents the relative copy number of the qPCR amplicon centered at that base-pair location. Relative copy number of each amplicon was calculated in comparison to a control amplicon in the ampicillin gene. Error bars represent standard deviation from three technical measurements of each amplicon and ampicillin gene. The redesigned CYC1v3 promoter exhibits lower nucleosome occupancy in the promoter region than the wild-type version. B) Predicted nucleosome affinity profile for the CYC1 and CYC1v3 promoters using the hidden Markov model. C) Predicted nucleosome occupancy profiles for the CYC1 and CYC1v3 promoters using the hidden Markov model.
Figure 6
Figure 6
CYC1 promoter redesigns have consistently increased expression levels in different genetic contexts. A) Relative expression level from the CYC1 promoter variants expressing the beta-galactosidase gene LacZ as measured by a chemiluminescent assay. Background luminescence from a strain not expressing LacZ was negligible. B) Relative expression level from the CYC1 promoter variants expressing yECitrine and integrated into the TRP1 locus of the BY4741 genome. C) Relative expression level from the CYC1 promoter variants expressing yECitrine with the K. lactis URA3 gene integrated upstream of the promoter. These plasmid constructs were the basis for the integration cassette used to create the strains measured in (B). Error bars represent standard deviation from biological triplicate.
Figure 7
Figure 7
Model-guided creation of de novo synthetic promoters. A) Two synthetic lead sequences, each containing prescribed transcription factor binding sites and randomized linker sequences, were used for de novo promoter design. B) Three computationally derived versions of each synthetic promoter were tested, one from an early round of optimization, one from an intermediate round, and one from a late round. Psynth1v1 and Psynth1v2 are the result of the sixth round, Psynth1v2 is from the 50th, Psynth1v3 is from the 98th, Psynth2v2 is from the 30th, and Psynth2v3 is from the 59th. Expression levels of the redesigned synthetic promoters spanned a nearly 20-fold range and all were functional. Error bars represent standard deviation of three biological replicates.

References

    1. Crook N, Alper HS. Model-based design of synthetic, biological systems. Chemical Engineering Science. 2013;103:2–11.
    1. Salis HM, Mirsky EA, Voigt CA. Automated design of synthetic ribosome binding sites to control protein expression. Nature biotechnology. 2009;27:946–950. - PMC - PubMed
    1. Amit R, Garcia HG, Phillips R, Fraser SE. Building enhancers from the ground up: a synthetic biology approach. Cell. 2011;146:105–118. - PMC - PubMed
    1. Khalil Ahmad S., et al. A synthetic biology framework for programming eukaryotic transcription functions. Cell. 2012;150:647–658. - PMC - PubMed
    1. McIsaac RS, et al. Synthetic gene expression perturbation systems with rapid, tunable, single-gene specificity in yeast. Nucleic acids research. 2013;41:e57. - PMC - PubMed

Publication types

MeSH terms

LinkOut - more resources