. 2014 Jun 2;211(6):1197-213.
doi: 10.1084/jem.20132629. Epub 2014 May 26.

Regulation of mammalian siderophore 2,5-DHBA in the innate immune response to infection

Affiliations

Regulation of mammalian siderophore 2,5-DHBA in the innate immune response to infection

Zhuoming Liu et al. J Exp Med. .

Abstract

Competition for iron influences host-pathogen interactions. Pathogens secrete small iron-binding moieties, siderophores, to acquire host iron. In response, the host secretes siderophore-binding proteins, such as lipocalin 24p3, which limit siderophore-mediated iron import into bacteria. Mammals produce 2,5-dihydroxy benzoic acid, a compound that resembles a bacterial siderophore. Our data suggest that bacteria use both mammalian and bacterial siderophores. In support of this idea, supplementation with mammalian siderophore enhances bacterial growth in vitro. In addition, mice lacking the mammalian siderophore resist E. coli infection. Finally, we show that the host responds to infection by suppressing siderophore synthesis while up-regulating lipocalin 24p3 expression via TLR signaling. Thus, reciprocal regulation of 24p3 and mammalian siderophore is a protective mechanism limiting microbial access to iron.


Figures

Figure 1.
Figure 1.
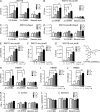
2,5-DHBA-mediated growth augmentation of E. coli in vitro. (A–D) E. coli W3110 (A), E. coli W3110 mut aroB (B), E. coli W3110ΔFepA (C) or E. coli W3110ΔFepAaroB (D; 104 CFU/ml each) was cultured in the presence of the indicated amounts of 2,5-DHBA, 2,3-DHBA, or benzoic acid overnight and CFU were determined at 12 h after culture. Data are the means of three independent experiments ± SD. Statistical analysis by one-way analysis of variance followed by the Tukey HSD test for multiple comparisons: *, P < 0.05; **, P < 0.01, ***, P < 0.001. (E and F) E. coli W3110 mut aroB (104 CFU/ml) was cultured in the presence of 0.1 µM FeCl3 and increasing concentrations of 2,5-DHBA (E) or 2,3-DHBA (F) overnight and CFU were determined at 12 h after culture. Data are the means of three independent experiments ± SD. Statistical analysis by one-way analysis of variance followed by the Tukey HSD test for multiple comparisons: *, P < 0.05; **, P < 0.01; ***, P < 0.001. (G, right) Schematic showing chromium substitution in 2,5-DHBA. (left) E. coli W3110 mut aroB (104 CFU/ml) was cultured in the presence of 0.1 µM CrCl3 and increasing concentrations of 2,5-DHBA overnight and CFU were determined at 12 h after culture. Data are the means of three independent experiments ± SD. Statistical analysis by one-way analysis of variance followed by the Tukey HSD test for multiple comparisons: *, P < 0.05; **, P < 0.01. (H) E. coli H9049 (104 CFU/ml) was cultured as stated in A. Statistical analysis by one-way analysis of variance followed by the Tukey HSD test for multiple comparisons: *, P < 0.05; **, P < 0.01; ***, P < 0.001. (I and J) E. coli H9049 (104 CFU/ml) was cultured in the presence of 0.1 µM FeCl3 and increasing concentrations of 2,5-DHBA (H) or 2,3-DHBA (I) and CFU were determined 12 h after culture. Data are the means of three independent experiments ± SD. Statistical analysis by one-way analysis of variance followed by the Tukey HSD test for multiple comparisons: *, P < 0.05; **, P < 0.01; ***, P < 0.001. (K) DHBA supplementation has no effect on S. aureus growth. S. aureus strain 25923 at 105 CFU/ml was cultured in the presence of indicated amounts of 2,5-DHBA, 2,3-DHBA, or benzoic acid overnight and CFU were determined at 12 h after culture by plating onto tryptic soy agar plates. Data are the means of three independent experiments ± SD. Statistical analysis by one-way analysis of variance followed by the Tukey HSD test for multiple comparisons. P < 0.05 was considered significant. (L) C. albicans is impervious to DHBA supplementation. C. albicans strain 562 at 106 CFU/ml was cultured in the presence of indicated amounts of 2,5-DHBA, 2,3-DHBA, or benzoic acid overnight and their number was enumerated in a hemocytometer 24 h after culture. Data are the means of three independent experiments ± SD. Statistical analysis by one-way analysis of variance, followed by the Tukey HSD test for multiple comparisons. P < 0.05 was considered significant.
Figure 2.
Figure 2.
Derivation of bdh2 knockout mice. (A) Schematic representation of the targeting strategy and the expected patterns of Cre-mediated homologous recombination. The structure of the bdh2 locus is shown at the top, the targeting construct in the middle and the resulting targeted allele at the bottom. Numbered boxes indicate exons. Black triangles indicate LoxP sites. Arrowheads indicate PCR primer locations for genotyping (P1-P4). 5′ and 3′ external probes indicated by solid lines. TK, herpes simplex virus thymidine kinase gene. Restriction sites, HindIII (H), EcoRI (E), used for Southern blot genotyping are indicated. (B) Assessment of 2,5-DHBA levels in urine samples of control and bdh2-null mice. A total of 10 age- and sex-matched WT and bdh2-null mice on C57BL/6 genetic background were analyzed. Representative GC-MS spectra of the TMS-derivatized, small molecule fractions from urine specimen from WT and bdh2-null mice were shown. A set of DHBA standards is shown on the top. (C and D) Bdh2 deficiency does not alter ketone body metabolism. Measurement of 3-hydroxybutyrate and acetoacetate levels in plasma of 8-wk-old female WT and bdh2-null mice on C57BL/6 genetic background. Data are representative of two independent experiments, each with at least 4–9 mice per group. Statistical analysis by one-way analysis of variance followed by the Tukey HSD test for multiple comparisons. P < 0.05 was considered significant. (E–G) Evaluation of fatty acid profiles in plasma of 8-wk-old female WT and bdh2-null mice on C57BL/6 genetic background. Data are representative of two independent experiments, each with at least 4–9 mice per group. Statistical analysis by one-way analysis of variance followed by the Tukey HSD test for multiple comparisons. P < 0.05 was considered significant.
Figure 3.
Figure 3.
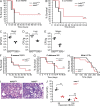
2,5-DHBA deficient mice are resistant to E. coli infection. (A and B) WT and bdh2-null mice were infected with 2.5 × 10⁸ CFU of E. coli H9049 strain (A) or 108 CFU of E. coli 25922 strain (B) i.p. and their survival was monitored for 7 d. Data are representative of 2 independent experiments with 8–13 mice per group. Statistical analysis by log-rank test: ***, P < 0.001. (C–E) Bacterial loads in blood and parenchymal tissues of WT and bdh2-null mice 36 h after infection with 0.6 × 10⁸ CFU of E. coli H9049. Blood (C) or homogenates of liver (D) and spleen (E) were plated on LB agar plates and the CFU were determined. Symbols represent individual mice. Bars represent the mean CFU. Data are representative of two independent experiments, each with at least four mice per group. Statistical analysis by two-tailed unpaired Student’s t test with Welch’s correction: ***, P < 0.001. (F) Survival curve comparing WT and bdh2-null mice after i.p. challenge with S. aureus 25923 strain (3 × 10⁸ CFU). Mice were monitored for 4 d after challenge. Data are representative of two independent experiments with seven mice per group. Statistical analysis by log-rank test: ns, not significant. (G) Survival curve comparing WT and bdh2-null mice after i.p. challenge with 7 × 10⁷ C. albicans. Mice were monitored for 3 wk after challenge. Data are representative of two independent experiments with 10 mice per group. Statistical analysis by log-rank test: ns, not significant. (H) Survival analysis of WT and bdh2-null mice infected with M. tuberculosis (M. tb) H37Rv. Mice were monitored for 300 d after challenge. Each group contained 12 mice. Statistical analysis by log-rank test: ns, not significant. (I) Histological analysis of representative lung sections (H&E) from WT and bdh2-null mice infected with M. tuberculosis H37Rv. Bars, 100 µM. (J) CFU determination in lung homogenates of WT and bdh2-null mice infected with M. tuberculosis. Symbols represent individual mouse. Bars represent the mean CFU. Data are representative of two independent experiments, each with at least three mice per group. Statistical analysis by two-tailed unpaired Student’s t test with Welch’s correction: ns, not significant; ***, P < 0.001.
Figure 4.
Figure 4.
2,5-DHBA supplementation confers enhanced sensitivity to E. coli infection. (A) Schematic representation for derivation of 13C-labeled 2,5-DHBA from 13C salicylic acid. (B) Kinetic analysis of 13C-2,5-DHBA clearance from mice. Mice were injected intraperitoneally with 13C-2,5-DHBA and its elimination from the body was assessed by subjecting urine samples to GC-MS analysis. Data are representative of two independent experiments, each with three mice per group. (C) Quantification of 2,5-DHBA levels in urine samples from control and bdh2-null mice. 2,5-DHBA levels were quantitated by comparing to known amounts of 2,5-DHBA. Results show pooled data from two independent experiments, each with at least three mice per group. Statistical analysis by two-tailed unpaired Student’s t test: ***, P < 0.001. (D) Serum transferrin saturation in 8-wk old female C57BL/6 (WT) mice injected with 2,5-DHBA. Results show pooled data from two independent experiments, each with at least three mice per group. Statistical analysis by two-tailed unpaired Student’s t test: ns, not significant. (E) Iron levels were measured in nonhemolyzed serum of control and 2,5-DHBA–injected mice. Symbols represent individual mice. Bars represent the mean values. Results show pooled data from two independent experiments, each with at least three mice per group. Statistical analysis by two-tailed unpaired t test: ns, not significant. (F–H) Survival curve comparing WT and bdh2-null mice supplemented with 2,5-DHBA or iron or 2,5-DHBA + iron and challenged with 2 × 10⁸ CFU of E. coli H9049 strain. Data are representative of two independent experiments with 4–14 mice per group. Statistical analysis by log-rank test: *, P < 0.05. (I) 2,5-DHBA supplementation augments bacterial growth in mice. WT and bdh2-null mice were infected with 0.6 × 10⁸ CFU of E. coli H9049 strain and bacterial loads in blood and parenchymal tissues after infection were determined. Symbols represent individual mice. Bars represent the mean CFU. Data are representative of two independent experiments, each with at least 5 mice per group. Statistical analysis by two-tailed unpaired Student’s t test with Welch’s correction: *, P < 0.05; **, P < 0.01.
Figure 5.
Figure 5.
Analysis of cytokines in bdh2-null mice. (A) Quantification of mRNAs for indicated cytokines in liver samples of control or bdh2-null mice 36 h after infection with E. coli H9049. Expression levels of cytokine mRNAs as indicated with control mice set at 1. The relative mRNA levels in each sample were normalized to actin mRNA. Results show pooled data from two independent experiments, each with at least three mice per group. Statistical analysis by two-tailed unpaired Student’s t test: ns, not significant; *, P < 0.05. (B) Quantitative analysis of mRNAs for indicated cytokines in liver samples of control or bdh2-null mice 6 h after LPS injection. Values relative to the liver mRNA from PBS-injected mice. Results show pooled data from two independent experiments, each with at least three mice per group. Statistical analysis by one-way analysis of variance followed by the Tukey HSD test for multiple comparisons: ns, not significant; *, P < 0.05; **, P < 0.01.
Figure 6.
Figure 6.
Bdh2 production is repressed by TLRs. (A) Quantitative analysis of bdh2 mRNA 4 h after treatment of RAW264.7 macrophages with the indicated TLR ligands. Expression of levels of bdh2 in naive cells was set at 1. The relative mRNA levels in each sample were normalized to actin mRNA. Data are the means of three independent experiments ± SD. Statistical analysis by one-way analysis of variance followed by the Tukey HSD test for multiple comparisons: *, P < 0.05, **, P < 0.01, ***, P < 0.001. (B) Quantitative analysis of bdh2 mRNA 4 h after treatment of primary bone marrow macrophages with LPS. Analysis was as described in A. Results are the means of three independent experiments ± SD. Statistical analysis by two-tailed unpaired Student’s t test: **, P < 0.01. (C) Time-course analysis of bdh2 mRNA at the indicated time points after LPS treatment of RAW264.7 macrophages. The expression level of bdh2 in naive cells was set at 1. Results are the means of three independent experiments ± SD. Statistical analysis by one-way analysis of variance followed by the Tukey HSD test: *, P < 0.05; **, P < 0.01. (D) Analysis of bdh2 mRNA in LPS-treated RAW264.7 macrophages with or without cycloheximide. The expression level of bdh2 in cycloheximide only treated cells was set at 1. Inset, IL-6 levels in culture supernatants from the same cells determined by ELISA. The results are the means of three independent experiments ± SD. Statistical analysis by one-way analysis of variance followed by the Tukey HSD test: *, P < 0.05. (E) Effect of cytokines on bdh2 mRNA level in RAW264.7 macrophages. Cells were treated with the indicated amounts of recombinant cytokines for 12 h and bdh2 mRNA levels were determined by qRT-PCR. The expression level of bdh2 mRNA in untreated cells was set at 1. The results are the means of three independent experiments ± SD. Statistical analysis by one-way analysis of variance followed by the Tukey HSD test: ns, not significant; *, P < 0.05. (F) Quantitative analysis of bdh2 mRNA in liver and spleen samples of 8-wk old female C57BL/6 WT mice after poly (I:C) or LPS injection. Values relative to the mRNA from PBS-injected mice. Analysis was as described in A. Results show pooled data from two independent experiments, each with at least three mice per group. Statistical analysis by one-way analysis of variance followed by the Tukey HSD test: ***, P < 0.001. (G) Quantitative analysis of bdh2 mRNA in liver samples of 8-wk-old female C57BL/6 WT mice after E. coli or S. aureus infection. Values relative to the mRNA from PBS-injected mice. Analysis was as described in A. Results show pooled data from two independent experiments, each with at least three mice per group. Statistical analysis by one-way analysis of variance followed by the Tukey HSD test: ***, P < 0.001. (H) Immunoblot analysis of Bdh2 in C57BL/6 WT mice after E. coli or S. aureus infection. Actin was used as a loading control. Molecular weight markers are indicated on the right. (I) Quantitative analysis of 24p3 in serum samples of WT and bdh2-null mice after E. coli H9049 or S. aureus infection. Symbols represent individual mice. Bars represent the mean values. Data are representative of two independent experiments, each with at least three to four mice per group. Statistical analysis by two-tailed unpaired t test: *, P < 0.05; ***, P < 0.001. (J) Assessment of 2,5-DHBA levels in urine samples of control and bdh2-null mice challenged with E. coli H9049 or S. aureus. Mass spectrometry analysis of cold ethanol precipitated urine samples. 2,5-DHBA levels were quantitated by comparing to known amounts of 2,5-DHBA. Results show pooled data from two independent experiments, each with at least three mice per group. Statistical analysis by one-way analysis of variance followed by the Tukey HSD test: **, P < 0.01; ***, P < 0.001. (K) Quantitative analysis of bdh2 mRNA in liver and spleen samples of LPS-injected TLR4-null mice. Values relative to the mRNA from PBS-injected mice. Analysis was as described in A. Results show pooled data from two independent experiments, each with at least three mice per group. Statistical analysis by two-tailed unpaired Student’s t test: P < 0.05 was considered significant. (L) The bdh2 promoter is down-regulated by LPS stimulation in RAW264.7 macrophages. Progressive deletions in 5′ flanking region of the bdh2 gene. (left) Luciferase activity in naive RAW264.7 cells. (right) Luciferase activity in LPS-stimulated RAW264.7 cells. Bottom, predicted transcription factor binding sites. The DNA binding site for Blimp-1 is shown. Results are means of three independent experiments ± SD. (M) Mutations in Blimp-1 binding sites in murine bdh2 promoter blunts LPS-mediated repression. Base substitutions are indicated below. RAW264.7 cells were transfected with WT (−1.5 to +0.5 kb) or mutant bdh2-luc reporter plasmids containing base substitutions and luciferase activity was determined as in G. Results are the means of three independent experiments ± SD. Statistical analysis by one-way analysis of variance followed by the Tukey HSD test: ***, P < 0.001. (N) Blimp-1 silencing abrogates TLR4-mediated repression of bdh2 in RAW264.7 macrophages. Bdh2 message was quantified in LPS treated and Blimp-1 deficient RAW264.7 cells. The relative mRNA levels in each sample were normalized to actin mRNA. Results are the means of three independent experiments ± SD. Statistical analysis by one-way analysis of variance followed by the Tukey HSD test: **, P < 0.01. (O) Luciferase activity in Blimp-1 repressed cells. RAW264.7 cells were co-transfected with the bdh2-luc reporter (−1.5 to +0.5 kb) and with either increasing amounts of blimp-1 siRNA or control siRNA and the luciferase activity was determined after LPS stimulation as in G. Results are the means of three independent experiments ± SD. Statistical analysis by one-way analysis of variance followed by the Tukey HSD test: ***, P < 0.001.
Figure 7.
Figure 7.
Analysis of iron parameters in E. coli H9049–infected WT and bdh2-null mice. (A) Serum iron in naive and E. coli H9049–infected C57BL/6 WT and bdh2-null mice. Mice were infected with 6 × 10⁷ CFU of E. coli H9049 and serum iron was determined 3 and 6 h after infection. Data are representative of two independent experiments, each with at least three mice per group. Statistical analysis by two-tailed unpaired Student’s t test: *, P < 0.05. (B) Quantification of hepcidin mRNA in WT or bdh2-null mice 3 or 6 h after infection with 6 × 10⁷ CFU of E. coli H9049. Expression levels of hepcidin mRNA in control mice was set at 1. The relative mRNA levels in each mouse were normalized to actin mRNA. Data are representative of two independent experiments, each with at least three mice per group. Statistical analysis by two-tailed unpaired Student’s t test: *, P < 0.05; **, P < 0.01. (C) Immunoblot analysis of ferroportin in spleen samples from WT or bdh2-null mice infected with 6 × 10⁷ CFU of E. coli H9049. Actin was used as a loading control. Spleen samples from three mice were used. Molecular weight markers are indicated on the right.

Comment in

Similar articles

Cited by

References

    1. Akira S., Taga T., Kishimoto T. 1993. Interleukin-6 in biology and medicine. Adv. Immunol. 54:1–78 10.1016/S0065-2776(08)60532-5 - DOI - PubMed
    1. Albrecht-Gary A.M., Crumbliss A.L. 1998. Coordination chemistry of siderophores: thermodynamics and kinetics of iron chelation and release. Met. Ions Biol. Syst. 35:239–327 - PubMed
    1. Almeida R.S., Wilson D., Hube B. 2009. Candida albicans iron acquisition within the host. FEM. Yeast Res. 9:1000–1012 10.1111/j.1567-1364.2009.00570.x - DOI - PubMed
    1. Anis M.M., Fulton S.A., Reba S.M., Harding C.V., Boom W.H. 2007. Modulation of naive CD4+ T-cell responses to an airway antigen during pulmonary mycobacterial infection. Infect. Immun. 75:2260–2268 10.1128/IAI.01709-06 - DOI - PMC - PubMed
    1. Aung H.T., Schroder K., Himes S.R., Brion K., van Zuylen W., Trieu A., Suzuki H., Hayashizaki Y., Hume D.A., Sweet M.J., Ravasi T. 2006. LPS regulates proinflammatory gene expression in macrophages by altering histone deacetylase expression. FASEB J. 20:1315–1327 10.1096/fj.05-5360com - DOI - PubMed

Publication types

MeSH terms