. 2014 Jun 2;211(6):1215-29.
doi: 10.1084/jem.20130914. Epub 2014 May 26.

B lymphocytes undergo TLR2-dependent apoptosis upon Shigella infection

Affiliations

B lymphocytes undergo TLR2-dependent apoptosis upon Shigella infection

Katharina Nothelfer et al. J Exp Med. .

Abstract

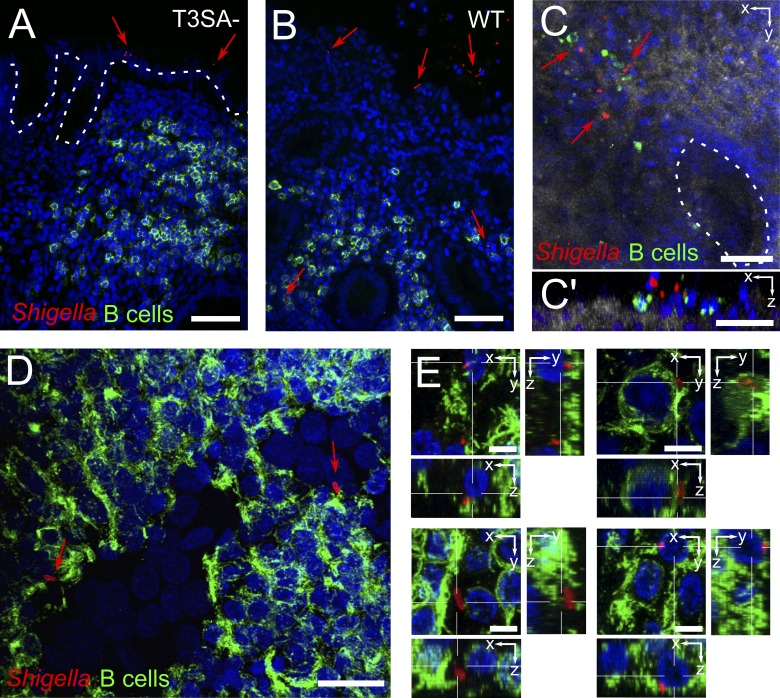
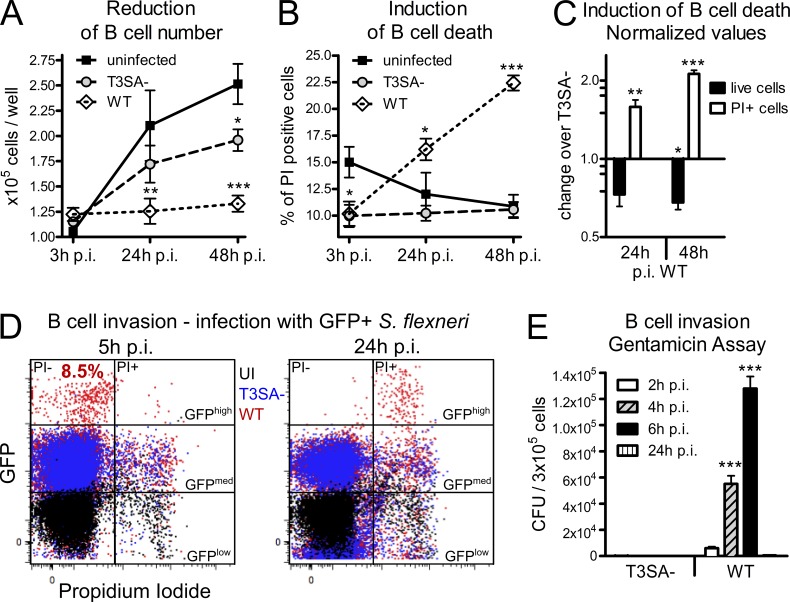
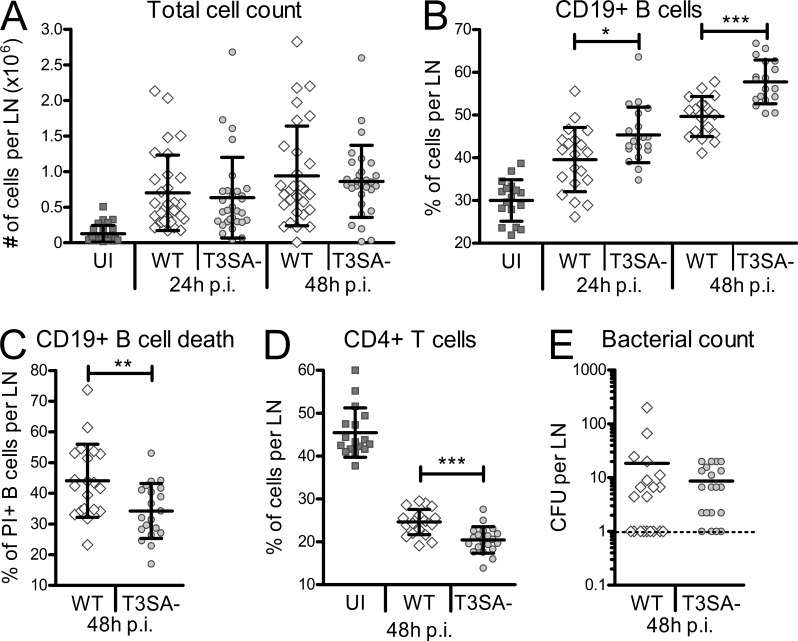
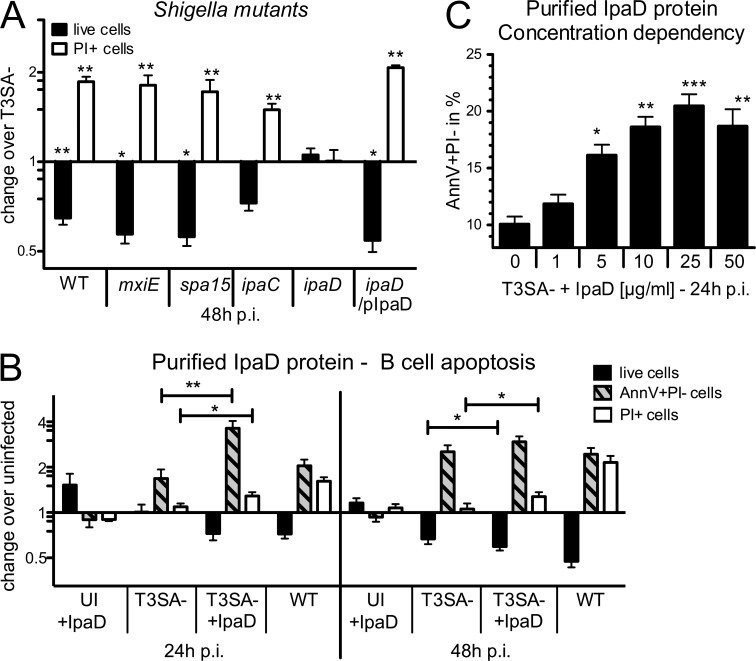
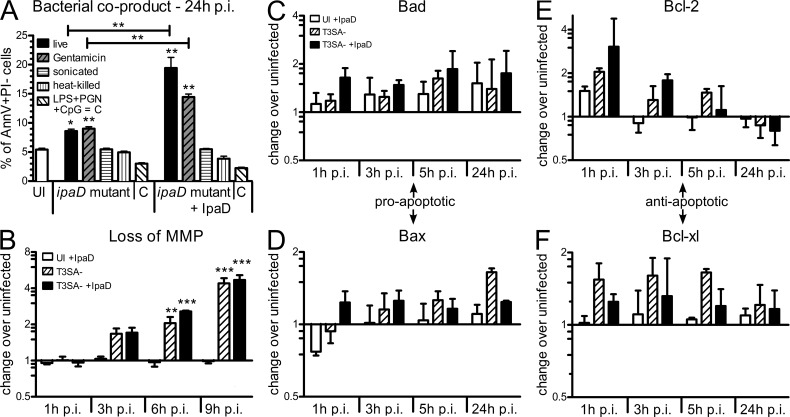
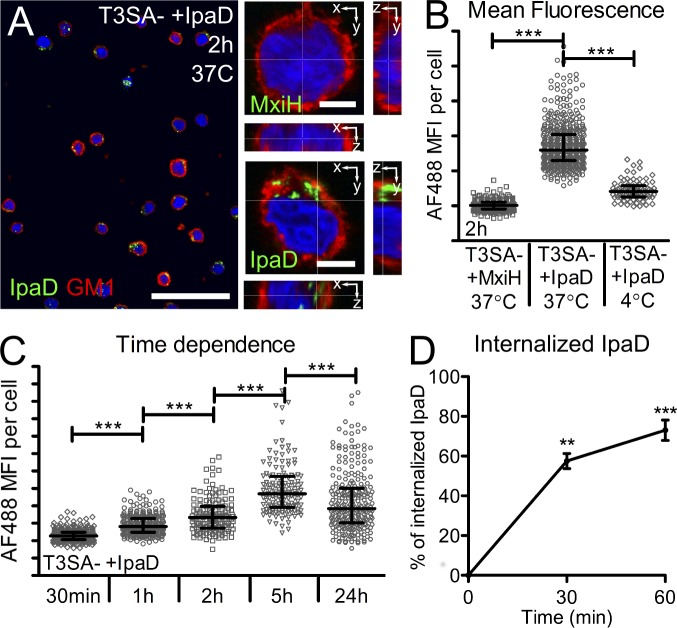
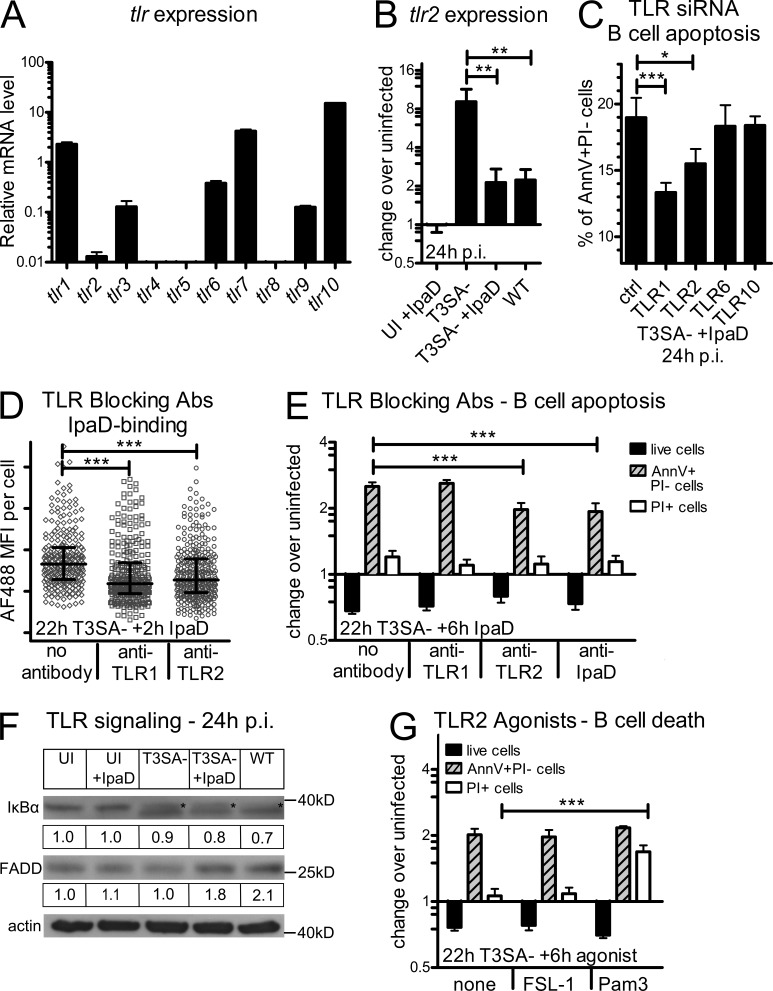
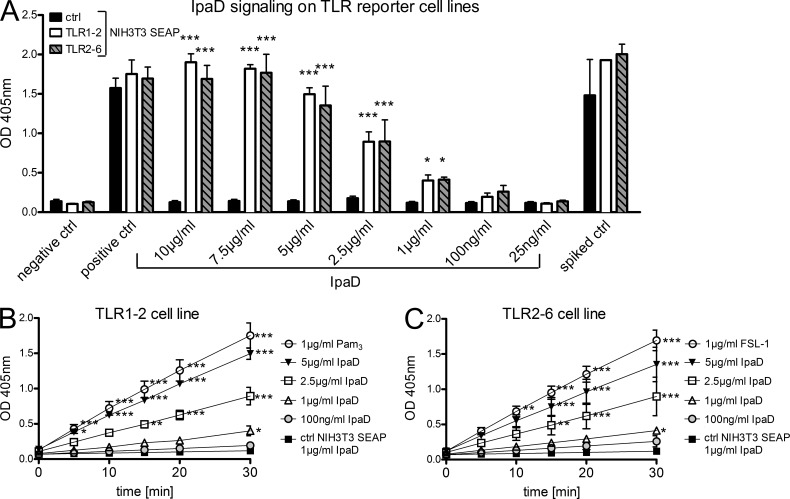
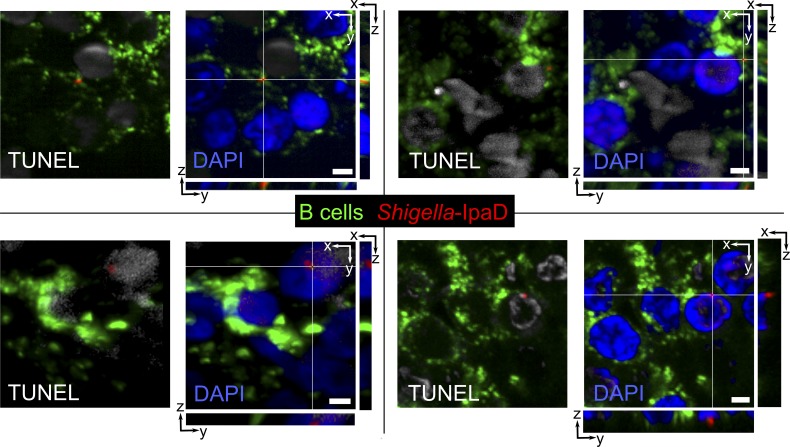
Antibody-mediated immunity to Shigella, the causative agent of bacillary dysentery, requires several episodes of infection to get primed and is short-lasting, suggesting that the B cell response is functionally impaired. We show that upon ex vivo infection of human colonic tissue, invasive S. flexneri interacts with and occasionally invades B lymphocytes. The induction of a type three secretion apparatus (T3SA)-dependent B cell death is observed in the human CL-01 B cell line in vitro, as well as in mouse B lymphocytes in vivo. In addition to cell death occurring in Shigella-invaded CL-01 B lymphocytes, we provide evidence that the T3SA needle tip protein IpaD can induce cell death in noninvaded cells. IpaD binds to and induces B cell apoptosis via TLR2, a signaling receptor thus far considered to result in activation of B lymphocytes. The presence of bacterial co-signals is required to sensitize B cells to apoptosis and to up-regulate tlr2, thus enhancing IpaD binding. Apoptotic B lymphocytes in contact with Shigella-IpaD are detected in rectal biopsies of infected individuals. This study therefore adds direct B lymphocyte targeting to the diversity of mechanisms used by Shigella to dampen the host immune response.


Figures

Figure 1.
Figure 1.
S. flexneri interacts with and invades B lymphocytes upon ex vivo infection of human colonic tissue. (A and B) Fluorescence microscopy of histological analysis. T3SA bacteria were found attached to the epithelium (A), whereas WT bacteria ruptured the epithelial barrier and got access to underlying tissue (B). (C) Confocal imaging of whole-mount tissue infected with WT bacteria, with top view (C) and orthogonal slice (C’). Reflection is shown in gray and crypts are outlined with a dashed line. (D and E) Confocal imaging of isolated lymph follicles in 150-µm-thick tissue sections, with top view (D) and orthogonal slices (E). Bacteria were stained with an antibody specific for S. flexneri 5a (red), B cells with anti-CD20cy (membrane receptor, green), and DAPI nuclei staining is shown in blue. Arrows point to bacteria. Bars: (A and B) 50 µm; (C and C’) 40 µm; (D) 20 µm; (E) 5 µm.
Figure 2.
Figure 2.
S. flexneri induces B cell death dependent on the T3SA in vitro. The human IgA+ CL-01 B cell line was infected for 30 min with WT or T3SA bacteria before addition of gentamicin. (A) Count of in vitroinfected human CL-01 B cells over time. Asterisks indicate statistical difference to the uninfected control. (B) Percentages of in vitro–infected PI+ human CL-01 B cells over time. Asterisks indicate statistical difference to the uninfected control. (C) Fold changes of live cell number and percentage of PI+ cells are presented for WT infection over infection with the T3SA mutant as normalized values. Asterisks indicate statistical difference to the T3SA strain. (D) Flow cytometry analysis of cells infected with GFP-expressing bacteria. GFPhigh PI B cells were detected 5 h p.i. with WT, but not T3SA bacteria (P < 0.001), representing 8.47 ± 1.1% (mean ± SEM) invaded cells. At 24 h p.i., GFPhigh cells are PI+. (E) Invasion assay for CL-01 B cells. The number of CFUs per 3 × 10⁵ infected cells is presented for WT and T3SA bacteria at 2, 4, 6, and 24 h p.i. Three independent experiments were performed in triplicate for A–E and data are presented as mean ± SEM. Statistically significant differences were determined by two-way ANOVA with Bonferroni post-test. *, P < 0.05; **, P < 0.01; ***, P < 0.001.
Figure 3.
Figure 3.
S. flexneri induces B cell death dependent on the T3SA in vivo. (A) Total cell count in murine LNs after footpad infection with S. flexneri. Cells were counted 24 and 48 h after WT and T3SA infection. (B) Percentages of CD19+ B cells in murine popliteal LNs 24 and 48 h after footpad infection. (C) Percentages of PI+ CD19+ B cells in murine popliteal LNs 48 h after footpad infection. (D) Percentages of CD4+ T cells in murine popliteal LNs 48 h after footpad infection. (E) Number of CFUs for WT and T3SA bacteria in murine LNs 48 h after footpad infection. Two independent experiments with each 5 mice per group (10 LNs) were performed and data are presented as mean ± SEM. Asterisks indicate statistical significant differences between WT and T3SA, determined by Mann-Whitney Student’s t test. *, P < 0.05; **, P < 0.01; ***, P < 0.001.
Figure 4.
Figure 4.
S. flexneri–induced B cell apoptosis is dependent on the virulence factor IpaD. (A) In vitro infections of the CL-01 B cell line with WT, mxiE, spa15, ipaC, ipaD, and complemented ipaD (ipaD/pIpaD) S. flexneri strains. Fold changes in cell number and percentages of PI+ cells are presented for infection with each strain over infection with the T3SA strain. Asterisks indicate statistical differences to T3SA bacteria. (B) CL-01 cell number and percentages of AnnV+PI (Annexin V+PI) and PI+ populations at 24 and 48 h p.i. for uninfected cells incubated with 25 µg/ml His-tagged IpaD protein (UI + IpaD), T3SA-infected cells, cells infected with T3SA and co-incubated with IpaD (T3SA + IpaD), and WT infected cells. Data are presented as fold change over the uninfected control. Asterisks indicate statistically significant differences between T3SA and T3SA + IpaD. (C) Percentages of apoptotic AnnV+PI cells after 24 h of co-incubation with T3SA and different concentrations of IpaD. Asterisks indicate statistical differences to T3SA bacteria alone. Three independent experiments were performed in triplicate for each condition/bacterial strain and data are presented as mean ± SEM. Statistically significant differences were determined by one-way (C) or two-way (A and B) ANOVA with Bonferroni post-test. *, P < 0.05; **, P < 0.01; ***, P < 0.001.
Figure 5.
Figure 5.
Bacterial co-signals sensitize human B lymphocytes to IpaD-mediated mitochondrial apoptosis. (A) Apoptotic CL-01 B cells after incubation for 24 h with live, gentamicin-treated, sonicated, or heat-killed ipaD bacteria or a cocktail of LPS, PGN, and CpG (C). Percentages of AnnV+PI cells are shown, in the presence (+IpaD) or absence of IpaD. Asterisks indicate statistical differences to the uninfected control (on column) or between conditions (indicated by bars) determined by one-way ANOVA with Bonferroni post-test. *, P < 0.05; **, P < 0.01. (B) Loss of MMP as assessed by flow cytometry with the fluorescent probe JC-1. Fold changes in the percentage of cells that lost MMP are presented for T3SA and T3SA + IpaD over the uninfected control. Asterisks indicate statistical differences to the uninfected control determined by two-way ANOVA with Bonferroni post-test. **, P < 0.01; ***, P < 0.001. (C–F) Dynamic regulation of mitochondrial pro- and anti-apoptotic proteins over time. Protein amounts were assessed by Western blot at 1, 3, 5, and 24 h p.i., and are presented as fold change over the uninfected control for IpaD alone, T3SA, and T3SA + IpaD after normalization to actin. (C and D) Protein amounts of pro-apoptotic Bad (C) and Bax (D). (E and F) Protein amounts of anti-apoptotic Bcl-2 (E) and Bcl-xL (F). All data are presented as mean ± SEM for three independent experiments.
Figure 6.
Figure 6.
IpaD binds to human CL-01 B lymphocytes and is internalized. (A) Confocal images of CL-01 B cells incubated with T3SA bacteria and IpaD or MxiH coupled to Alexa Fluor 488. An overview image (bar, 50 µm) is presented alongside single confocal slices of B cells (bars, 5 µm) after 2 h of incubation at 37°C. Cells were co-stained for GM1 (red, membrane) and DAPI (blue, nuclei). (B and C) Quantification of the AF488 mean fluorescence intensity (MFI) in a 15-µm radius around the center of the nuclei. (B) MFI of IpaD after co-incubation with T3SA for 2 h at 37°C. Values are compared with the MxiH control protein and to incubation at 4°C. (C) Time dependence of the MFI measured for IpaD. Cells were incubated with IpaD for different times at 37°C in the presence of T3SA bacteria. A minimum of 100 cells were analyzed for each condition for B and C. Data are presented as median ± interquartile range for one representative experiment and statistically significant differences were determined by Kruskal-Wallis test with Dunn’s post-test. ***, P < 0.0001. (D) IpaD internalization. Cells were incubated with fluorescent AF488-IpaD for 1 h at 4°C (time 0), and unbound AF488-IpaD was washed before incubation at 37°C for 30 min or 1 h. At each time point, IpaD bound to the cell surface was detected by flow cytometry using an anti-IpaD polyclonal serum, and a secondary antibody coupled to Alexa Fluor 647. Data are presented as mean ± SEM for three independent experiments and statistically significant differences to time 0 were determined by one-way ANOVA with Bonferroni post-test. **, P < 0.01; ***, P < 0.001.
Figure 7.
Figure 7.
IpaD induces B cell apoptosis via interaction with TLR2. (A) Relative TLR mRNA expression levels in the CL-01 B cell line as assessed by quantitative RT-PCR. (B) TLR2 mRNA expression levels after 24 h of incubation with IpaD alone, T3SA, WT, or T3SA + IpaD. mRNA levels are presented as fold change over the uninfected control. Asterisks indicate a statistical difference between T3SA and T3SA + IpaD/WT determined by one-way ANOVA with Bonferroni post-test. **, P < 0.01. (C) Apoptotic CL-01 B cells after transfection with TLR-targeting siRNA pools. Transfection was performed 24 h before incubation with T3SA + IpaD and percentages of AnnV+PI cells are presented 24 h p.i. Asterisks indicate statistical differences to the nontargeting control siRNA pool determined by one-way ANOVA with Bonferroni post-test. *, P < 0.05; ***, P < 0.001. (D) IpaD binding to B cells in the presence of TLR1 and 2 blocking antibodies. IpaD coupled to Alexa Fluor 488 was added for 2 h to cells preincubated with the T3SA mutant for 22 h. The blocking antibodies were added 1 h before IpaD addition. Asterisks indicate statistical differences to the control without antibody determined by Kruskal-Wallis test with Dunn’s post-test. ***, P < 0.0001. (E) B cell death in the presence of TLR1 and 2 blocking antibodies or an antibody against IpaD. IpaD was added for 6 h to cells preincubated with the T3SA mutant for 22 h. The TLR blocking antibodies were added to the cells, and the anti-IpaD antibody to the IpaD solution, 1 h before IpaD addition to the cells. Live cell numbers and percentages of AnnV+PI and PI+ cells are presented as fold changes over the uninfected control. Asterisks indicate statistical differences to the control without antibody determined by two-way ANOVA with Bonferroni post-test. ***, P < 0.001. (F) TLR signaling at 24 h p.i. as assessed by Western blot analysis. Protein amounts of IκBα were assessed as an indicator for NF-κB activation and FADD as an indicator of the TLR2 death pathway. Pictures of the blots and the correspondent fold change over the uninfected control after normalization to actin are shown for both proteins. (G) Induction of B cell death by a TLR2 agonist. The TLR2-6 agonist FSL-1 and the TLR2-1 agonist Pam3CSK4 were added for 6 h to cells preincubated with the T3SA mutant for 22 h. Live cell numbers and percentages of AnnV+PI and PI+ cells are presented as fold changes over the uninfected control. Asterisks indicate statistical differences to T3SA bacteria alone determined by two-way ANOVA with Bonferroni post-test. ***, P < 0.001. Data are presented as mean ± SEM (A–C, E, and G) and as median ± interquartile range in D. Three independent experiments were performed in triplicate for A–C, E, and G, and one representative out of two independent experiments is shown in D and F.
Figure 8.
Figure 8.
IpaD acts as a TLR2 agonist. The reporter system is based on NIH3T3 cells stably transfected with the NF-κB–inducible reporter gene SEAP together with the corresponding combinations of human TLRs. The amount of SEAP upon TLR induction can be compared in cell supernatants by addition of its substrate pNPP and measurement of the product OD at 405 nm. (A) OD at 405 nm 30 min after substrate incubation with supernatants from treated cells. Cells were treated for 18 h with indicated concentrations of IpaD in comparison to negative, positive, and spiked controls. The TLR2-1 and 2–6 reporter cell lines are shown in comparison to the control SEAP cell line without TLRs. (B) Induction of the TLR2-1 reporter cell line. The OD at 405 nm is presented over time for selected concentrations of IpaD in comparison to positive (Pam3CSK4) and negative (NIH3T3 control cell line) controls. (C) Induction of the TLR2-6 reporter cell line. The OD at 405nm is presented over time for selected concentrations of IpaD in comparison to positive (FSL-1) and negative (NIH3T3 control cell line) controls. Two independent experiments were performed in duplicate and all data are presented as mean ± SEM. Statistically significant differences to the control SEAP cell line were determined by two-way ANOVA with Bonferroni post-test. *, P < 0.05; **, P < 0.01; ***, P < 0.001.
Figure 9.
Figure 9.
S. flexneri interacts with B lymphocytes and induces B cell apoptosis upon natural infection. Representative fluorescence microscopy images of ILFs in colonic biopsy tissue slides from two patients presenting severe shigellosis are shown. Bacteria were stained with an antibody against IpaD (red), B cells with anti-CD20cy (green), and apoptotic cells with a TUNEL kit (gray). Orthogonal slices are shown for each confocal image. Bars, 2 µm.

Similar articles

Cited by

References

    1. Acosta Rodriguez E.V., Zuniga E.I., Montes C.L., Merino M.C., Bermejo D.A., Amezcua Vesely M.C., Motran C.C., Gruppi A. 2007. Trypanosoma cruzi infection beats the B-cell compartment favouring parasite establishment: can we strike first? Scand. J. Immunol. 66:137–142 10.1111/j.1365-3083.2007.01968.x - DOI - PubMed
    1. Ahmed F., Clemens J.D., Rao M.R., Sack D.A., Khan M.R., Haque E. 1992. Community-based evaluation of the effect of breast-feeding on the risk of microbiologically confirmed or clinically presumptive shigellosis in Bangladeshi children. Pediatrics. 90:406–411 - PubMed
    1. Aliprantis A.O., Yang R.B., Mark M.R., Suggett S., Devaux B., Radolf J.D., Klimpel G.R., Godowski P., Zychlinsky A. 1999. Cell activation and apoptosis by bacterial lipoproteins through toll-like receptor-2. Science. 285:736–739 10.1126/science.285.5428.736 - DOI - PubMed
    1. Aliprantis A.O., Yang R.B., Weiss D.S., Godowski P., Zychlinsky A. 2000. The apoptotic signaling pathway activated by Toll-like receptor-2. EMBO J. 19:3325–3336 10.1093/emboj/19.13.3325 - DOI - PMC - PubMed
    1. Bhunia A.K., Feng X. 1999. Examination of cytopathic effect and apoptosis in Listeria monocytogenes-infected hybridoma B-lymphocyte (Ped-2E9) line in vitro. J. Microbiol. Biotechnol. 9:398–403

Publication types

MeSH terms