. 2015 Jul;220(4):2333-53.
doi: 10.1007/s00429-014-0793-x. Epub 2014 May 27.

Virtual Electrode Recording Tool for EXtracellular potentials (VERTEX): comparing multi-electrode recordings from simulated and biological mammalian cortical tissue

Affiliations

Virtual Electrode Recording Tool for EXtracellular potentials (VERTEX): comparing multi-electrode recordings from simulated and biological mammalian cortical tissue

Richard J Tomsett et al. Brain Struct Funct. 2015 Jul.

Abstract

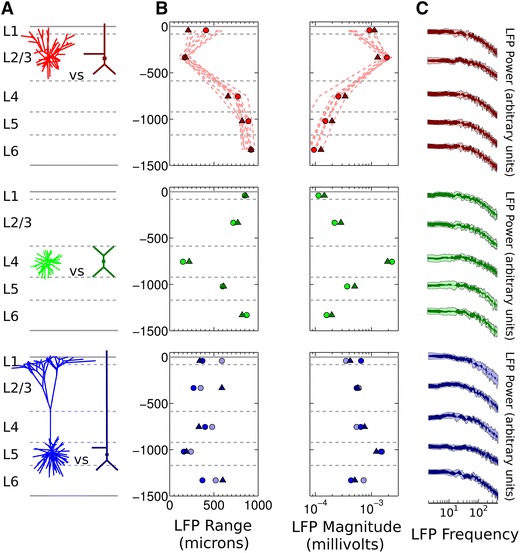
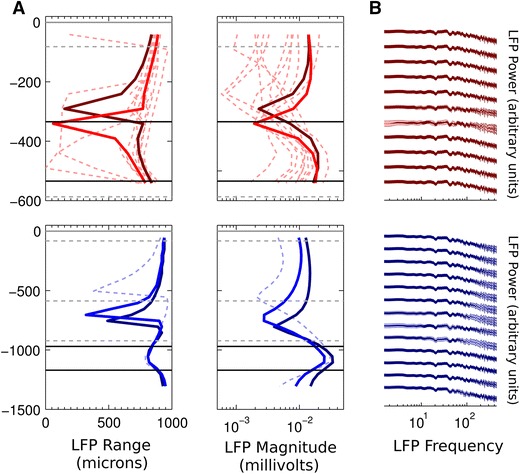
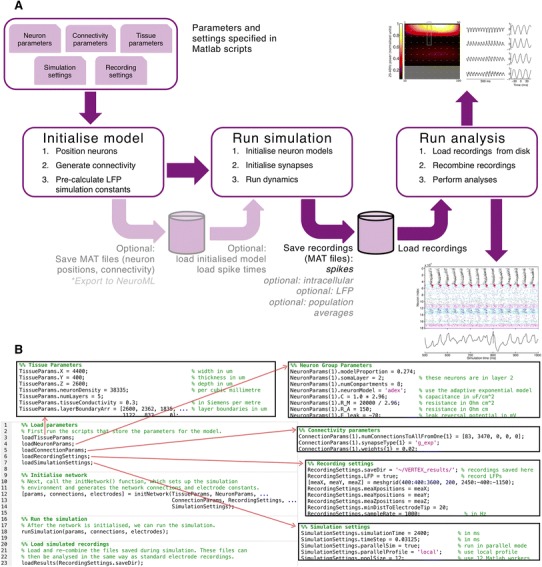
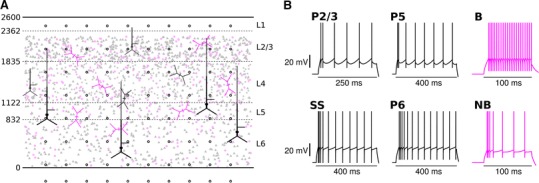
Local field potentials (LFPs) sampled with extracellular electrodes are frequently used as a measure of population neuronal activity. However, relating such measurements to underlying neuronal behaviour and connectivity is non-trivial. To help study this link, we developed the Virtual Electrode Recording Tool for EXtracellular potentials (VERTEX). We first identified a reduced neuron model that retained the spatial and frequency filtering characteristics of extracellular potentials from neocortical neurons. We then developed VERTEX as an easy-to-use Matlab tool for simulating LFPs from large populations (>100,000 neurons). A VERTEX-based simulation successfully reproduced features of the LFPs from an in vitro multi-electrode array recording of macaque neocortical tissue. Our model, with virtual electrodes placed anywhere in 3D, allows direct comparisons with the in vitro recording setup. We envisage that VERTEX will stimulate experimentalists, clinicians, and computational neuroscientists to use models to understand the mechanisms underlying measured brain dynamics in health and disease.


Figures

Fig. 1
Fig. 1
Comparison of simulated LFPs from the Bush and Mainen cell models. Top (red) L2/3 pyramidal neuron, middle (green) spiny stellate cell (morphology also used for interneurons), bottom (blue) L5 pyramidal neuron. a Comparison of original and reduced multi-compartment models of each neuron type. b Range and magnitude of simulated LFPs. Circles show values for the original cell reconstruction populations, triangles for the reduced neuron model populations. Light red dashed lines in the top panel and light blue circles in bottom panel show values for the extra cat pyramidal neurons tested, as described in the main text. All y-axis values in μm. c Overlap of the 95 % confidence intervals for the estimated LFP power spectra produced by each population in each layer shaded dark. Non-overlapping sections of the 95 % confidence intervals are shaded light. Power is plotted in dimensionless, normalised units for ease of comparison
Fig. 2
Fig. 2
Comparison of simulated LFPs from the Bush and Mainen cell models for highly correlated input at the soma compartment. Top (red) L2/3 pyramidal neurons, bottom (blue) L5 pyramidal neurons. a Range and magnitude of simulated LFPs. Bright red/blue lines show range and magnitude values for the Mainen cell populations, dark red/blue lines show range and magnitude values for the Bush cell populations. The faded red/blue dashed lines show these values for the additionally tested cell populations in L2/3 and in L5. Grey dashed lines show layer boundaries, black solid lines show the maximum and minimum soma depths. All y-axis values in μm. c Overlap of the 95 % confidence intervals for the estimated LFP power spectra produced by the L2/3 and L5 pyramidal neuron populations at each electrode location shaded dark (correlated input at soma). Non-overlapping sections of the 95 % confidence intervals are shaded light. Power is plotted in dimensionless, normalised units for ease of comparison. Comparisons for only 13 out of the 26 LFP measurement points for the L5 populations are shown for ease of visualisation
Fig. 3
Fig. 3
Overview of the VERTEX simulation software. a Simulation workflow. The user provides parameters as Matlab structures to setup the neuron populations, position them in layers, connect them together, and simulate their dynamics and the resultant LFPs. Functionality to export to NeuroML is currently under development. b Example program structure. The main simulation program only requires calls to the initNetwork() function and the runSimulation() function, with the information required to setup the simulation specified in separate script files
Fig. 4
Fig. 4
Parallel simulation performance with increasing numbers of Matlab workers (i.e. parallel processes). Top row model initialisation times for a the 9 881 neuron model and b the 123,517 neuron model. Bottom simulation times for 1 s of biological time for c the 9,881 neuron model and d the 123,517 neuron model. Thick black lines indicate linear speed scaling; legends indicate the number of electrodes used in each simulation run. The sub-linear speed-up in the small model is due to the decreasing relative performance influence of code vectorisation for smaller matrices (see “Results”)
Fig. 5
Fig. 5
Slice model structure and individual neuron dynamics. a Layer boundaries are given in µm. Subsets of soma locations from each neuron group are shown in faded black for excitatory neurons, or faded magenta for inhibitory neurons. Triangles represent pyramidal neuron somas, stars are spiny stellate cell somas, circles are basket interneuron somas and diamonds non-basket interneuron somas. One example full cell is shown for each neuron group, in solid black for excitatory neurons or solid magenta for inhibitory neurons. Compartment lengths are to scale; compartment diameters are not. Black circles are virtual electrode positions (first 8 rows shown). b Responses to step-current injections into the soma compartment of each neuron type. Spikes are detected and cut-off at V t + 5 mV; we extend the spike trace up to +10 mV for illustrative purposes. Step-current magnitudes were 0.5 nA for the P2/3 neuron, 0.333 nA for the SS neuron, 1.0 nA for the P5 neuron, 0.75 nA for the P6 neuron, and 0.4 nA for the B and NB interneurons
Fig. 6
Fig. 6
Changes in connectivity between neuron groups after slice cutting. a Expected number of connections from population of presynaptic neurons (columns) onto single postsynaptic neurons (rows) before slicing, based on the data from Binzegger et al. (2004). b Illustration of the effect of slice cutting on a presynaptic neuron’s (light green dot) axonal arborisation (shaded area). Figure orientation is as if looking down onto the surface of the brain, with slice boundaries indicated by the black bounding box. Connections within the green shaded area remain, but those in the grey shaded areas are removed by slicing. c Connectivity in the cortical slice model, as altered from a by slice cutting. While overall connection number decreases (note different scale bars), some connections are affected more than others because of differing axonal arborisation sizes. d Difference matrix showing the percentage change in number of synapses from slice cutting
Fig. 7
Fig. 7
Spike raster and individual neuron responses during gamma oscillation. a Spike raster showing spiking activity of 5 % of all the neurons in the model (reduced number shown for clarity). Boundaries between neuron groups marked in cyan. Note strong persistent gamma oscillation in L2/3, with weaker oscillation in L5. b Example soma membrane potential plots for the various neuron types. Most neurons fire sparsely, while B2/3 and B5 neurons fire on most oscillation periods. Note occasional spike doublet firing in the B2/3 neuron. Spikes are cut-off at V t + 5 mV in the simulation; we extend them up to 10 mV here for illustrative purposes. c Close-up of P2/3 neuron soma membrane potential (cut-off-45 mV). Scale bar 5 mV
Fig. 8
Fig. 8
Illustration of the gamma oscillation mechanism in the model. a Spike raster of 250 ms from a simulation of a model with the same parameters as that shown in Fig. 6. For clarity, spikes from only 5 % of the neurons are shown. A gamma oscillation is apparent in layers 2/3 and 5. b Zoomed spike raster showing only neurons in layer 2/3. Spikes from only 1 % of the neurons are shown. c LFP recording from the virtual electrode with the highest gamma power in the LFP. d Power spectrum of the LFP from this electrode, calculated for 1.5 s simulation time, showing a clear gamma peak. eh same as ad, but with synaptic weights from P2/3 cells to B2/3 cells reduced to 1 % of their original value. ef show B2/3 cell firing is greatly reduced, as they are not receiving excitation from the P2/3 cells. No gamma oscillation emerges. il same as ad, but with synaptic weights from B2/3 cells to P2/3 cells reduced to 1 % of their original value. B2/3 cells fire rapidly and randomly: they are driven by the P2/3 cells but they cannot synchronise them as their synapses are too weak. No gamma oscillation emerges. mp same as ad, but with the mean and standard deviation of the stochastic input current to the B2/3 cells increased by 50 %. P2/3 cell firing is suppressed by the increased B2/3 cell firing, so no gamma oscillation occurs
Fig. 9
Fig. 9
Comparison of experimental (ac) and simulated (df) MEA recordings. a Map of gamma frequency power across the electrode array in vitro. Electrode positions shown as grey dots, corner numbers indicate electrode IDs. Shaded areas show where electrodes were discounted because they fell either outside the slice boundaries or within the white matter. Gamma power is strongest at the top of the slice, corresponding to L2/3. b Example experimental LFP traces from electrodes 41–44 (indicated by grey rectangle in a). Traces have been normalised to unit standard deviation for ease of comparison. c Cross correlation of signals from electrodes 41–44 with signal from electrode 42, illustrating phase inversion in the signal from electrode 41. This electrode was identified as being in layer 1 by post hoc histology (not shown). Gamma map and cross-correlations estimated from 18 s of data. df as ac, but for the neocortical slice model (gamma map and cross-correlations estimated from 1.5 s of simulation data)

References

    1. Ainsworth M, Lee S, Cunningham MO, Roopun AK, Traub RD, Kopell NJ, Whittington MA. Dual gamma rhythm generators control interlaminar synchrony in auditory cortex. J Neurosci. 2011;31(47):17040–17051. doi: 10.1523/JNEUROSCI.2209-11.2011. - DOI - PMC - PubMed
    1. Anastassiou CA, Perin R, Markram H, Koch C. Ephaptic coupling of cortical neurons. Nat Neurosci. 2011;14(2):217–223. doi: 10.1038/nn.2727. - DOI - PubMed
    1. Andersen RA, Burdick JW, Musallam S, Pesaran B, Cham JG. Cognitive neural prosthetics. Trends Cogn Sci. 2004;8(11):486–493. doi: 10.1016/j.tics.2004.09.009. - DOI - PubMed
    1. Arsiero M, Luscher HR, Lundstrom BN, Giugliano M. The impact of input fluctuations on the frequency-current relationships of layer 5 pyramidal neurons in the rat medial prefrontal cortex. J Neurosci. 2007;27(12):3274–3284. doi: 10.1523/JNEUROSCI.4937-06.2007. - DOI - PMC - PubMed
    1. Ascoli GA, Donohue DE, Halavi M. NeuroMorpho.Org: a central resource for neuronal morphologies. J Neurosci. 2007;27(35):9247–9251. doi: 10.1523/JNEUROSCI.2055-07.2007. - DOI - PMC - PubMed

Publication types

LinkOut - more resources