. 2014 Aug;23(16):4089-102.
doi: 10.1111/mec.12807. Epub 2014 Jun 16.

Untangling the hybrid nature of modern pig genomes: a mosaic derived from biogeographically distinct and highly divergent Sus scrofa populations

Affiliations

Untangling the hybrid nature of modern pig genomes: a mosaic derived from biogeographically distinct and highly divergent Sus scrofa populations

Mirte Bosse et al. Mol Ecol. 2014 Aug.

Abstract

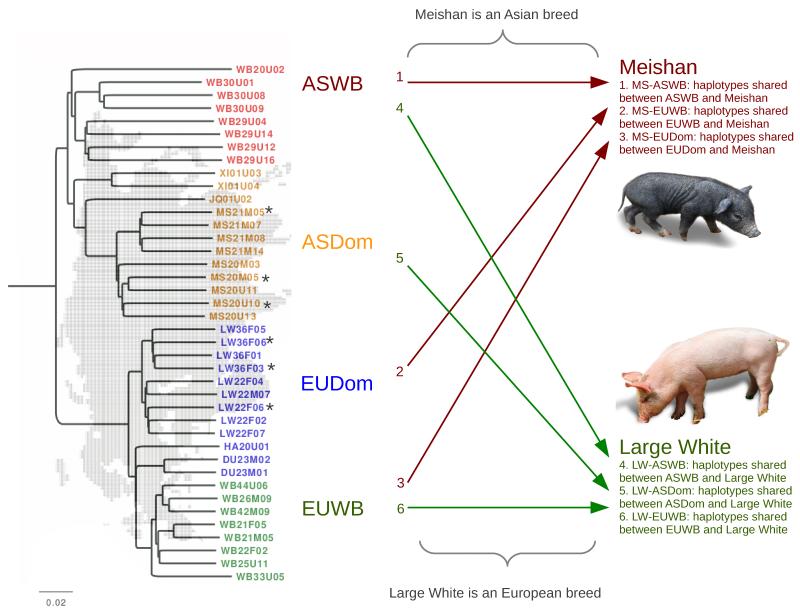
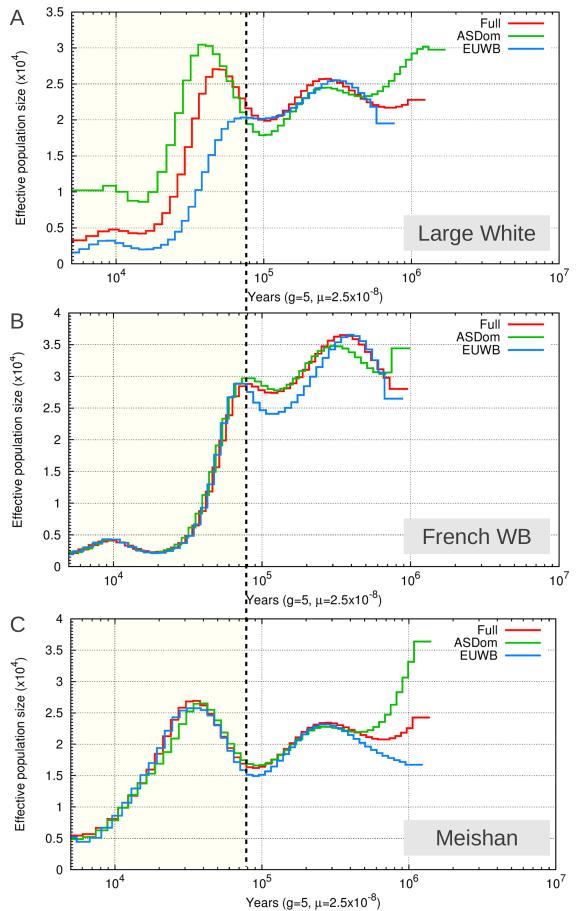
The merging of populations after an extended period of isolation and divergence is a common phenomenon, in natural settings as well as due to human interference. Individuals with such hybrid origins contain genomes that essentially form a mosaic of different histories and demographies. Pigs are an excellent model species to study hybridization because European and Asian wild boars diverged ~1.2 Mya, and pigs were domesticated independently in Europe and Asia. During the Industrial Revolution in England, pigs were imported from China to improve the local pigs. This study utilizes the latest genomics tools to identify the origin of haplotypes in European domesticated pigs that are descendant from Asian and European populations. Our results reveal fine-scale haplotype structure representing different ancient demographic events, as well as a mosaic composition of those distinct histories due to recently introgressed haplotypes in the pig genome. As a consequence, nucleotide diversity in the genome of European domesticated pigs is higher when at least one haplotype of Asian origin is present, and haplotype length correlates negatively with recombination frequency and nucleotide diversity. Another consequence is that the inference of past effective population size is influenced by the background of the haplotypes in an individual, but we demonstrate that by careful sorting based on the origin of haplotypes, both distinct demographic histories can be reconstructed. Future detailed mapping of the genomic distribution of variation will enable a targeted approach to increase genetic diversity of captive and wild populations, thus facilitating conservation efforts in the near future.

Keywords: Sus scrofa; conservation genetics; domestication; hybridization; identity by descent; introgression.


Figures

Figure 1
Figure 1. Experimental setup for the IBD detection
Arrows indicate all the pairwise comparisons between groups that are used for the IBD detection. Individuals from two breeds (LW: Large white and MS: Meishan) are used for all comparisons with four geographical and functional groups: European wild boars (EUWB), European domesticated pigs (EUDom), Asian wild boars (ASWB) and Asian domesticated pigs (ASDom). All individuals in the phylogenetic tree are used for the pairwise IBD detections. Three individuals from the LW and MS group (indicated with*) are also used for the representation of the EUDom and ASDom group, respectively, which means that they are used for IBD detection in both groups. Total numbers of IBD detection between 2 individuals for the 6 pairwise comparisons are: 1-72; 2-72; 3-54; 4-72; 5-54; 6-72 (see also figure S1).
Figure 2
Figure 2. Genomic structure and Fst of the four main pig groups used for analysis
2A. The percentage of Asian (red) and European (blue) genetic material is displayed on the y-axis, and each individual is displayed on the x-axis. We examined the genetic structure of all individuals when we force two populations (K=2) for four groups: Asian wild boars (ASWB), an Asian domesticated breeds (including MS), European wild boars (EUWB) and the European domesticated breeds (including LW). Asian wild boars are the most diverse group in terms of both within-individual and between-individual variation. 2B. Distribution of Fst between MS and EUWB (blue) and MS and ASWB (red). Fst was calculated for each bin of 10,000 bp over the full genome. 2C. Distribution of Fst between LW and EUWB (blue) and LW and ASWB (red).
Figure 3
Figure 3. Size and number of Pairwise IBD tracts
The average size of an IBD haplotype is plotted against the number of pairwise IBD haplotypes for each pairwise comparison between individuals. Coloration is based on five different groups of pairwise comparisons: The LW individuals compared with ASWB (red) and EUWB (light green); the MS individuals compared with ASWB (brown), and EUWB (dark green); and both domesticated groups compared with each other (LW-MS, in blue).
Figure 4
Figure 4. Recombination frequency and average length of IBD haplotypes over chromosome 1
Example of the distribution of recombination frequency and the average length of IBD haplotypes over the full length of chromosome 1 in bins of 1Mb. 3A. Recombination frequency per bin of 1Mb (Tortereau et al. 2012), the x-axis displays location on chromosome 1. 3B. Length of IBD fragments in LW shared with EUWB(green), ASDom (blue) and ASWB (red) over chromosome1. 3C. Correlation between log-transformed recombination frequency (x-axis) and log-transformed haplotype length (y-axis) over all autosomes for haplotypes in LW shared with EUWB(green), ASDom (blue) and ASWB (red).
Figure 5
Figure 5. Example of nucleotide diversity and shared haplotypes for a LW pig over chromosome 1
5A. The nucleotide diversity between two haplotypes per bin of 10Kbp is plotted against the physical position of the bin on chromosome 1. Regions in the genome in bins of 10Kbp where one of the two haplotypes is IBD with EUWB (green), ASDom (orange) or ASWB (red) are indicated in bars beneath the original plot. 5B. Histogram of nucleotide diversity between the two haplotypes in this individual in bins of 10Kbp. 5C-E. Histogram of nucleotide diversity between the two haplotypes in this individual in bins of 10Kbp, where at least one of the two haplotypes is IBD with EUWB (green, 5C), ASDom (orange, 5D) or ASWB (red, 5E).
Figure 6
Figure 6. Estimates of past effective population size based on parts of the genome with different demographic history for three pigs
Red lines indicate the effective population size when a pairwise sequential marcovian coalescent analysis is run on the consensus sequence for the full genome. Green lines are estimates for Ne based on only those segments in the genome where the LW pig contains an Asian haplotype, and blue lines indicate the Ne when the PSMC is run on only those segments where the LW contains an European wild haplotype and no Asian haplotype. These regions are filtered for a length of at least 100 kb and therefore we consider only the left side of the dotted black line to be accurate Ne estimates. 6A. Ne estimated for the LW individual LW22F07. 6B. Ne estimated for the French wild boar WB25U11. 6C. Ne estimated for the MS pig MS20U10.

Comment in

  • Mixed signals from hybrid genomes.
    Orozco-terWengel PA, Bruford MW. Orozco-terWengel PA, et al. Mol Ecol. 2014 Aug;23(16):3941-3. doi: 10.1111/mec.12863. Mol Ecol. 2014. PMID: 25088552

References

    1. Abi-Rached L, Jobin MJ, Kulkarni S, et al. The shaping of modern human immune systems by multiregional admixture with archaic humans. Science. 2011;334:89–94. - PMC - PubMed
    1. Aguilar A, Roemer G, Debenham S, et al. High MHC diversity maintained by balancing selection in an otherwise genetically monomorphic mammal. Proceedings of the National Academy of Sciences of the United States of America. 2004 Mar 9;101(10):3490–4. - PMC - PubMed
    1. Alexander DH, Novembre J, Lange K. Fast model-based estimation of ancestry in unrelated individuals. Genome Research. 2009;19:1655–1664. - PMC - PubMed
    1. Alves PC, Pinheiro I, Godinho R, et al. Genetic diversity of wild boar populations and domestic pig breeds (Sus scrofa) in South-western Europe. Biological Journal of the Linnean Society. 2010;101:797–822.
    1. Begun DJ, Aquadro CF. Levels of naturally occurring DNA polymorphism correlate with recombination rates in D. melanogaster. Nature. 1992;356:519–20. - PubMed

Publication types