. 2014 Jun;143(6):703-18.
doi: 10.1085/jgp.201411182.

Interactions between permeation and gating in the TMEM16B/anoctamin2 calcium-activated chloride channel

Affiliations

Interactions between permeation and gating in the TMEM16B/anoctamin2 calcium-activated chloride channel

Giulia Betto et al. J Gen Physiol. 2014 Jun.

Erratum in

  • J Gen Physiol. 2014 Jul;144(1):125

Abstract

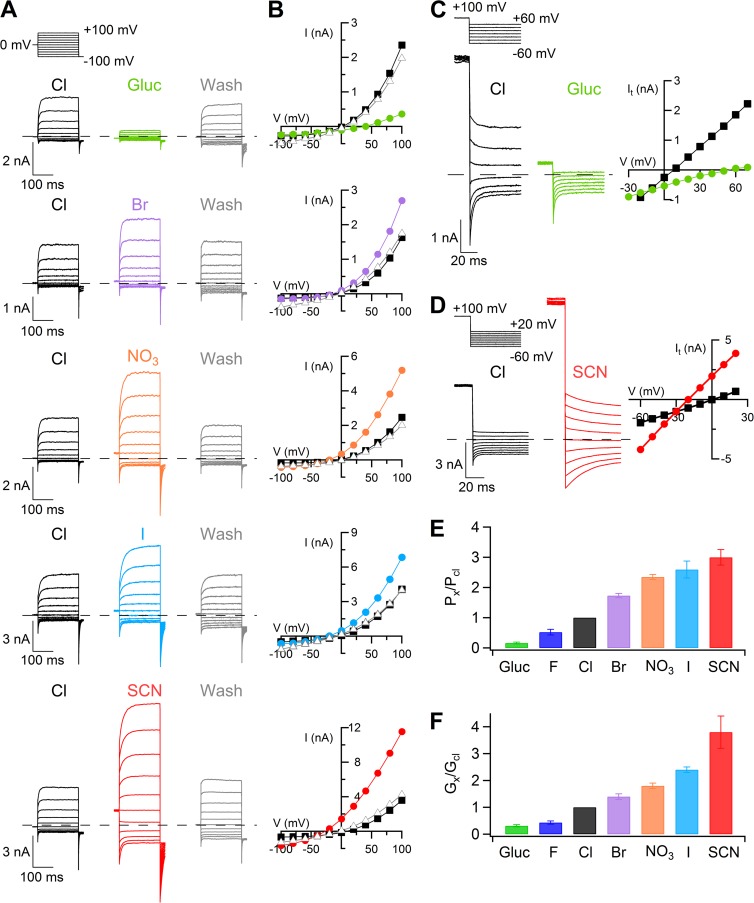
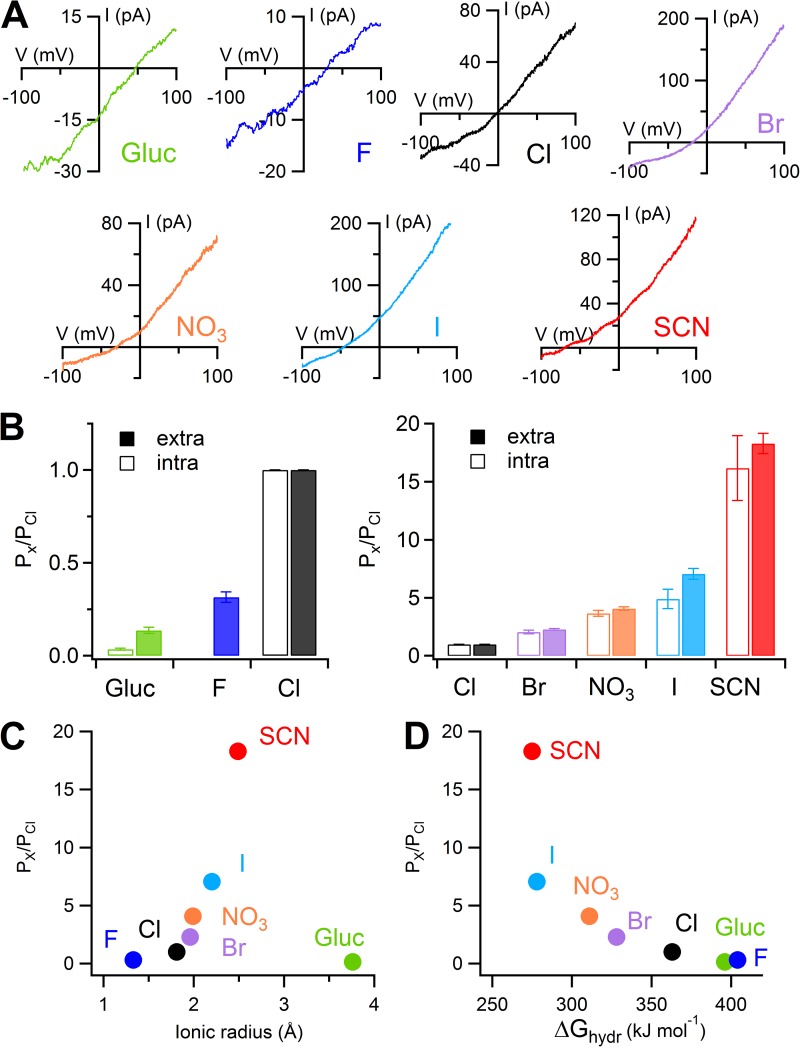
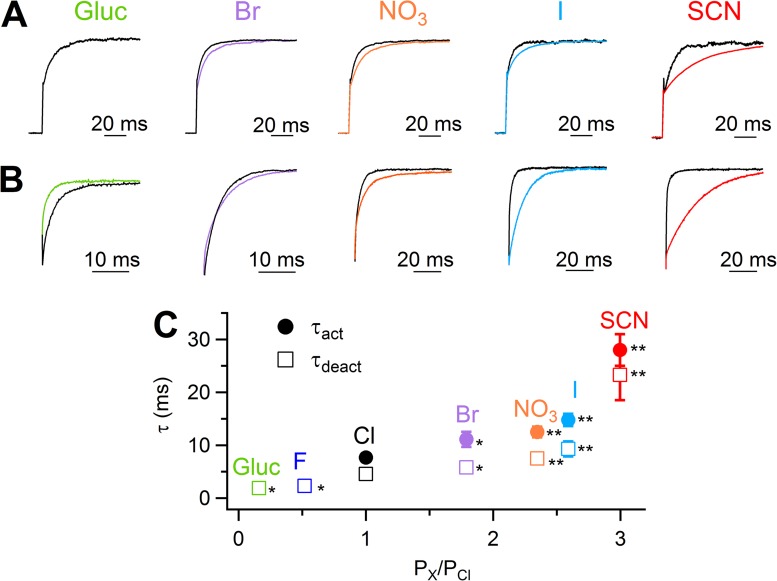
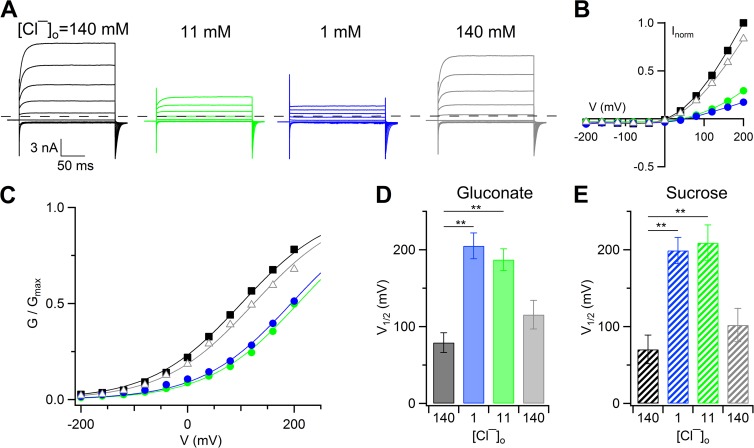
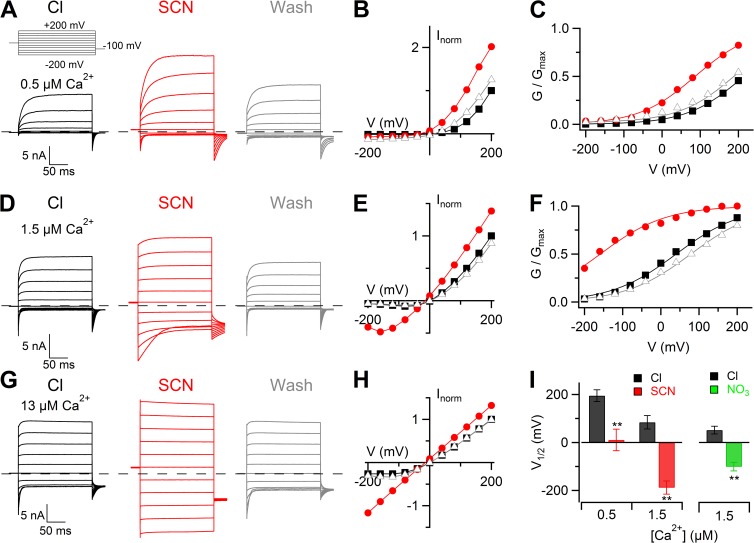
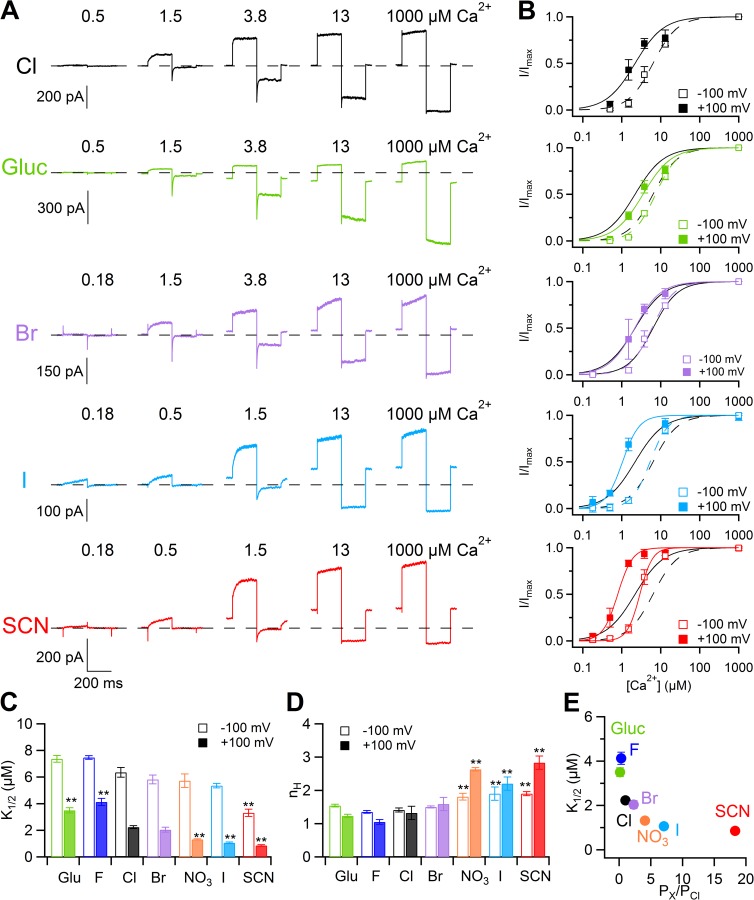
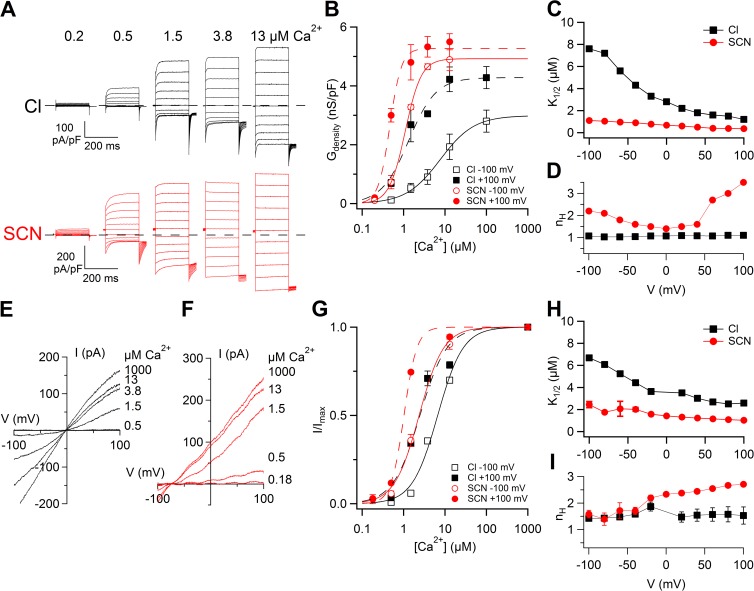
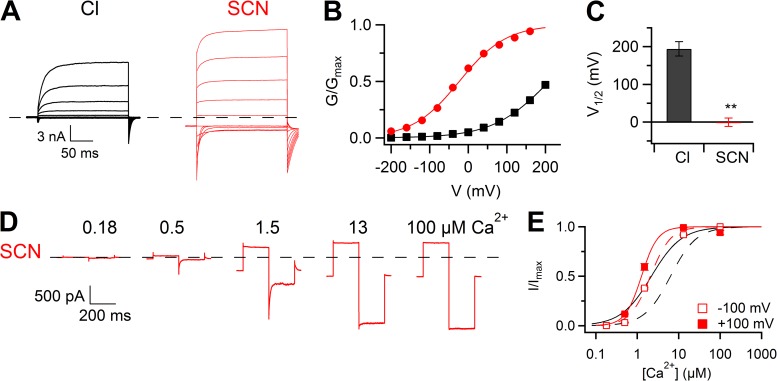
At least two members of the TMEM16/anoctamin family, TMEM16A (also known as anoctamin1) and TMEM16B (also known as anoctamin2), encode Ca(2+)-activated Cl(-) channels (CaCCs), which are found in various cell types and mediate numerous physiological functions. Here, we used whole-cell and excised inside-out patch-clamp to investigate the relationship between anion permeation and gating, two processes typically viewed as independent, in TMEM16B expressed in HEK 293T cells. The permeability ratio sequence determined by substituting Cl(-) with other anions (PX/PCl) was SCN(-) > I(-) > NO3 (-) > Br(-) > Cl(-) > F(-) > gluconate. When external Cl(-) was substituted with other anions, TMEM16B activation and deactivation kinetics at 0.5 µM Ca(2+) were modified according to the sequence of permeability ratios, with anions more permeant than Cl(-) slowing both activation and deactivation and anions less permeant than Cl(-) accelerating them. Moreover, replacement of external Cl(-) with gluconate, or sucrose, shifted the voltage dependence of steady-state activation (G-V relation) to more positive potentials, whereas substitution of extracellular or intracellular Cl(-) with SCN(-) shifted G-V to more negative potentials. Dose-response relationships for Ca(2+) in the presence of different extracellular anions indicated that the apparent affinity for Ca(2+) at +100 mV increased with increasing permeability ratio. The apparent affinity for Ca(2+) in the presence of intracellular SCN(-) also increased compared with that in Cl(-). Our results provide the first evidence that TMEM16B gating is modulated by permeant anions and provide the basis for future studies aimed at identifying the molecular determinants of TMEM16B ion selectivity and gating.


Figures

Figure 1.
Figure 1.
Extracellular anion selectivity in whole-cell recordings. (A) Representative whole-cell voltage-clamp recordings obtained with an intracellular solution containing 0.5 µM Ca2+. Voltage steps of 200-ms duration were given from a holding voltage of 0 mV to voltages between −100 and +100 mV in 20-mV steps followed by a step to −100 mV, as indicated in the top part of the panel. Each cell was exposed to a control solution containing NaCl (black traces) and NaX, where X was the indicated anion, followed by wash out in NaCl (gray traces). (B) Steady-state I-V relations measured at the end of the voltage steps from the cells shown at the left (A) in control (squares), NaX (circles), or after wash out from the NaX solution (triangles). (C and D) Representative recordings from two cells at 0.5 µM Ca2+ obtained with a voltage protocol consisting of a prepulse to +100 mV from a holding voltage of 0 mV, followed by voltage steps between −60 and +70 mV (C) or −60 and +20 mV (D) in 10-mV steps. Only current recordings every 20 mV are shown in C. I-V relations measured from tail currents in Cl (squares) or in the indicated anion (circles) are shown on the right of each cell. (E) Mean permeability ratios (PX/PCl) calculated with the Goldman-Hodgkin-Katz equation (n = 11–14). (F) Mean chord conductance ratios (GX/GCl) measured in a 40-mV interval around Vrev per each anion (n = 4–14). Error bars indicate SEM.
Figure 2.
Figure 2.
Anion selectivity in inside-out patches. (A) I-V relations in 1.5 µM Ca2+ obtained from a ramp protocol in inside-out membrane patches. In each patch, the pipette solution contained 140 mM NaCl or the Na salt of the indicated anion. Leakage currents measured in 0 Ca2+ were subtracted. (B) Comparison of mean permeability ratios (PX/PCl) calculated with the Goldman-Hodgkin-Katz equation with different anions in the internal (n = 5–6; data for intracellular I, NO3, and Br are from Pifferi et al. [2009]) or external solution (n = 6–12; as experiments shown in A). Error bars indicate SEM. (C and D) Permeability ratios (PX/PCl), obtained from experiments as in A, plotted versus ionic radius (C) or free energy of hydration (D) of the extracellular anion. Ionic radius and free energy of hydration were taken from Table 1 of Smith et al. (1999).
Figure 3.
Figure 3.
Activation and deactivation kinetics in whole cell with various extracellular anions. (A and B) Normalized single traces from whole-cell currents in the presence of extracellular NaCl or the Na salt of the indicated anion in 0.5 µM Ca2+. Voltage protocol similar to Fig. 1 (C and D), with a voltage step to +100 mV (A) from a holding voltage of 0 mV and followed by a step to −60 mV (B). Trace in gluconate in A is not shown because at the test potential there is a negligible time-dependent component. (C) Current activation and deactivation were fitted with a single exponential (fit not depicted for clarity). Mean activation time constants (τact) at +100 mV and deactivation time constants (τdeact) at −60 mV were plotted versus permeability ratios (n = 8–14; *, P < 0.05; **, P < 0.01, paired t test with Cl). Error bars indicate SEM.
Figure 4.
Figure 4.
Changes of voltage dependence in whole cell when extracellular Cl was substituted with less permeant gluconate or sucrose. (A) Representative whole-cell voltage-clamp recordings at 1.5 µM Ca2+. The same cell was exposed to a solution containing NaCl (black traces), Na-gluconate (green and blue traces), and back to NaCl (gray traces). Voltage steps of 200-ms duration were given from a holding voltage of 0 mV to voltages between −200 and +200 mV in 40-mV steps, followed by a step to −100 mV. (B) Steady-state I-V relations measured at the end of the voltage steps from the cell shown at the left (A) normalized to the control value at +200 mV. Control values are represented by black squares, wash out by gray triangles, and 11 mM and 1 mM Cl, respectively, by the green and blue circles. (C) Normalized conductances calculated from tail currents at −100 mV after prepulses between −200 and +200 mV plotted versus the prepulse voltage for the experiment shown in A. Symbols as in B. Lines are the fit to the Boltzmann equation (Eq. 1). (D and E) Mean V1/2 values in the presence of gluconate (D; n = 10) or sucrose (E; n = 3) at the indicated [Cl]o (**, P < 0.01, Tukey’s test after ANOVA for repeated measurements). Error bars indicate SEM.
Figure 5.
Figure 5.
Changes of voltage dependence in whole cell when extracellular Cl was substituted with more permeant anions. (A, D, and G) Representative whole-cell voltage-clamp recordings at the indicated [Ca2+]i. The same cell was exposed to a solution containing NaCl (black traces), NaSCN (red traces), and back to NaCl (gray traces). Voltage steps of 200-ms duration were given from a holding voltage of 0 mV to voltages between −200 and +200 mV in 40-mV steps, followed by a step to −100 mV, as indicated in the top part of A. (B, E, and H) Steady-state I-V relations measured at the end of the voltage steps from the cell shown at the left (A, D, and G, respectively) in control (squares), NaSCN (circles), and after wash out (triangles). (C and F) Normalized conductances calculated from tail currents at −100 mV after prepulses between −200 and +200 mV plotted versus the prepulse voltage. Symbols as in B and E. Lines are the fit to the Boltzmann equation (Eq. 1). (I) Mean V1/2 values at 0.5 µM Ca2+ (n = 4) or 1.5 µM Ca2+ (n = 9 in Cl, 6 in NO3) for Cl, SCN, or NO3 (**, P < 0.01 paired t test). Error bars indicate SEM.
Figure 6.
Figure 6.
Ca2+ sensitivity in inside-out patches with various extracellular anions. (A) Each row shows current traces from the same inside-out patch with the indicated anion in the pipette. The cytoplasmic side was exposed to [Ca2+]i ranging from 0.18 to 1 mM. Voltage steps of 200-ms duration were given from a holding voltage of 0 mV to +100 mV, followed by a 200-ms step to −100 mV. Leakage currents measured in 0 Ca2+ were subtracted. (B) Dose–response relations of activation by Ca2+ obtained by normalized currents at −100 or +100 mV, fitted to the Hill equation (Eq. 2). Black lines are the fit to the Hill equation in external Cl. (C) Comparison of the mean K1/2 values at −100 or +100 mV in the presence of various anions (n = 5–13; **, P < 0.01 comparison with Cl by Tukey’s test after ANOVA). (D) Comparison of the mean nH values at −100 or +100 mV in the presence of various anions (n = 5–13; **, P < 0.01 comparison with Cl by Tukey’s test after ANOVA). (E) Mean K1/2 values at +100 mV plotted versus permeability ratios. Error bars indicate SEM.
Figure 7.
Figure 7.
Comparison of Ca2+ sensitivity in whole-cell and inside-out patches. (A) Whole-cell recordings obtained with various [Ca2+]i in extracellular Cl or SCN. The same cells were recorded in Cl or SCN for each [Ca2+]i. Voltage protocol as in Fig. 1 A. (B) Comparison of dose–responses in Cl or SCN at −100 and +100 mV in whole cell obtained from conductance density calculated from tail currents plotted versus [Ca2+]i (n = 3–5). Lines are the fit to the Hill equation (Eq. 3). (C and D) Mean K1/2 and nH values from whole-cell recordings plotted versus voltage. (E and F) Currents in an inside-out patch activated by voltage ramps at the indicated [Ca2+]i in symmetrical Cl (E) or in extracellular SCN (F). Leakage currents measured in 0 Ca2+ were subtracted. (G) Comparison of dose–responses in Cl or SCN obtained by normalized currents at −100 or +100 mV, fitted to the Hill equation (Eq. 2). (H and I) Mean K1/2 and nH values from inside-out patch recordings plotted versus voltage (n = 6–7). Error bars indicate SEM.
Figure 8.
Figure 8.
Effect of intracellular SCN. (A) Whole-cell recordings at 0.5 µM Ca2+ with a standard intracellular solution containing Cl (same traces of Fig. 5 A) or SCN. Voltage steps as in Fig. 5. (B) Normalized conductances calculated from tail currents at −100 mV after prepulses between −200 and +200 mV plotted versus the prepulse voltage for the experiments shown in A. Lines are the fit to the Boltzmann equation (Eq. 1). (C) Mean V1/2 values in the presence of Cl (n = 4; same data of Fig. 5 I) or SCN (n = 11; **, P < 0.01 unpaired t test). Error bars indicate SEM. (D) Traces from an inside-out patch with SCN at the intracellular side. [Ca2+]i ranged from 0.18 to 100 µM. Voltage steps of 200-ms duration were given from a holding voltage of 0 to +100 mV, followed by a 200-ms step to −100 mV. Leakage currents measured in 0 Ca2+ were subtracted. (E) Dose–response relations of activation by Ca2+ obtained by normalized currents at −100 or +100 mV (n = 11), fitted to the Hill equation (Eq. 2). Black lines are the fit to the Hill equation in symmetrical Cl solutions.

Similar articles

Cited by

References

    1. Adomaviciene A., Smith K.J., Garnett H., Tammaro P. 2013. Putative pore-loops of TMEM16/anoctamin channels affect channel density in cell membranes. J. Physiol. 591:3487–3505 10.1113/jphysiol.2013.251660 - DOI - PMC - PubMed
    1. Armstrong C.M. 1971. Interaction of tetraethylammonium ion derivatives with the potassium channels of giant axons. J. Gen. Physiol. 58:413–437 10.1085/jgp.58.4.413 - DOI - PMC - PubMed
    1. Berg J., Yang H., Jan L.Y. 2012. Ca2+-activated Cl− channels at a glance. J. Cell Sci. 125:1367–1371 10.1242/jcs.093260 - DOI - PMC - PubMed
    1. Billig G.M., Pál B., Fidzinski P., Jentsch T.J. 2011. Ca2+-activated Cl− currents are dispensable for olfaction. Nat. Neurosci. 14:763–769 10.1038/nn.2821 - DOI - PubMed
    1. Caputo A., Caci E., Ferrera L., Pedemonte N., Barsanti C., Sondo E., Pfeffer U., Ravazzolo R., Zegarra-Moran O., Galietta L.J.V. 2008. TMEM16A, a membrane protein associated with calcium-dependent chloride channel activity. Science. 322:590–594 10.1126/science.1163518 - DOI - PubMed

Publication types